Diagnostics Screen
In this section we will have a closer look at the Diagnostics screen with settings and additional diagnostics of the Roson system.
Navigation
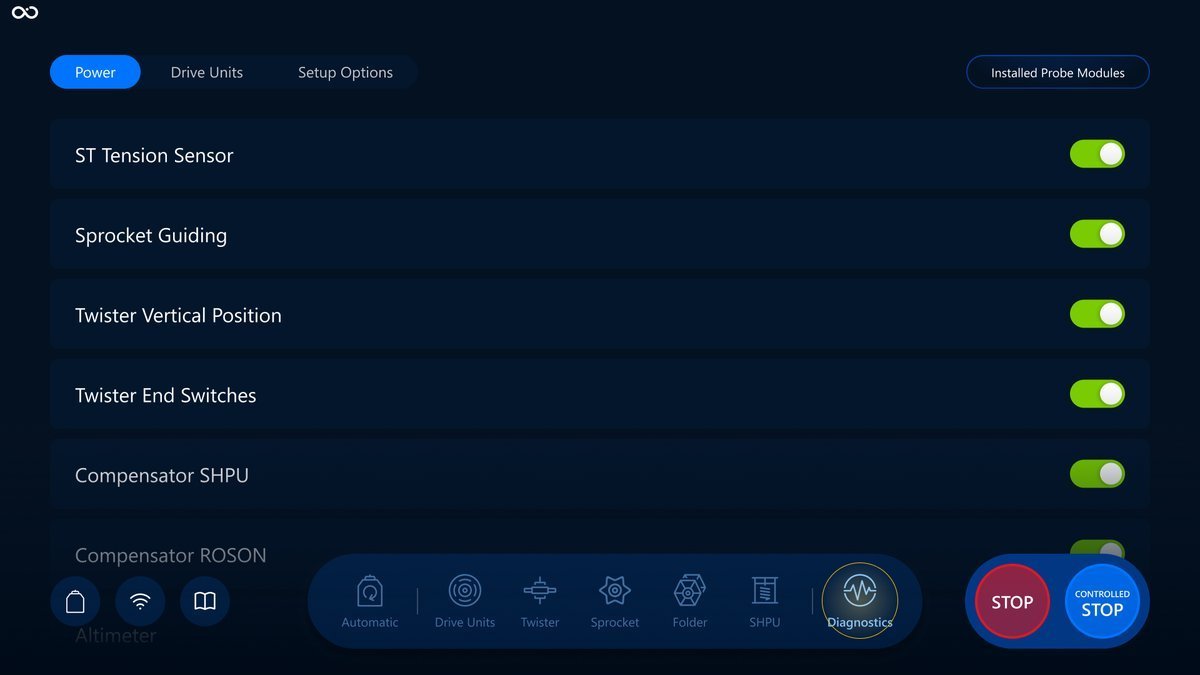
Choose the Diagnostics icon in the navigation bar for navigation:
Toggles
On the Diagnostics screen, we will mostly use toggles rather than action buttons. By using toggles you can switch between two values (on and off):
Here is an example with the "on" option:

With the "off" option:

Secondary statuses for toggles
Other than On and Off, there are situational and intermediary statuses, such as disabled, waiting, warning and error:
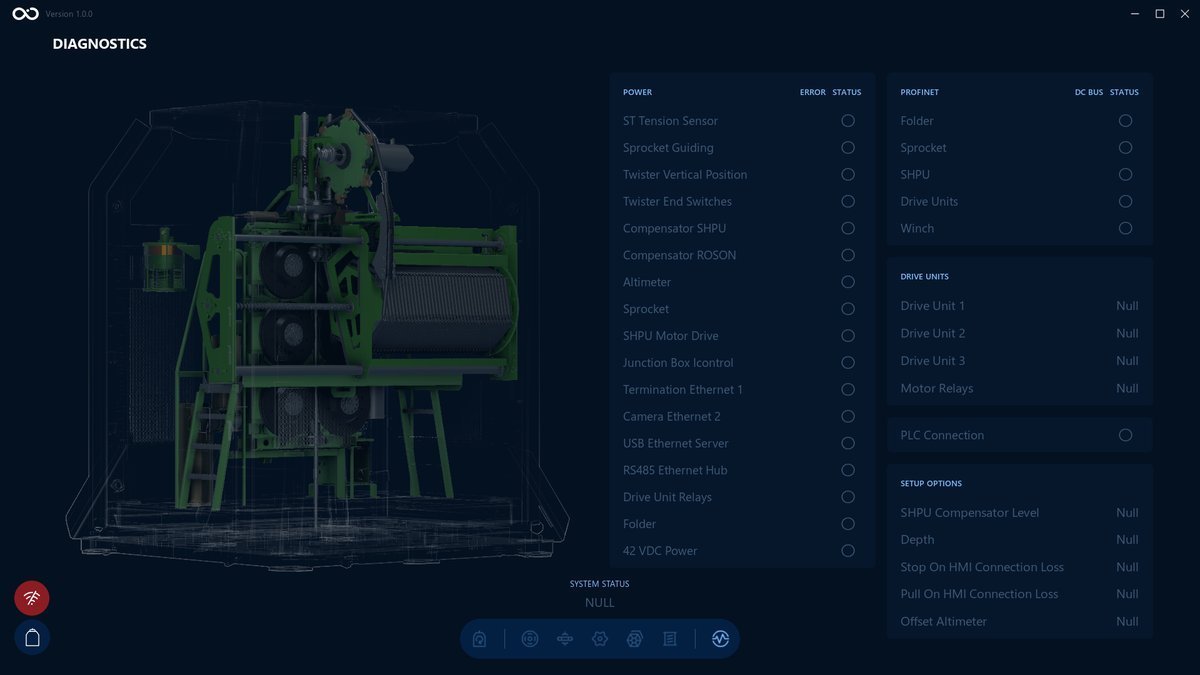
Disabled
Indicates that the toggle is currently not interactive:

Waiting
Indicates that the operation is pending, and you need to wait until the moment it turns to another status. You can't interact with the toggle during the time this status is active:

Activated
If response was successful than toggle would receive the Activated status. After 5 sec status will switch into Enabled.

Warning
Indicates that there is a connection problem. It's also not interactive:

Read the system status message to see what went wrong.
Error
Indicates that one of the Roson’s components has an error:
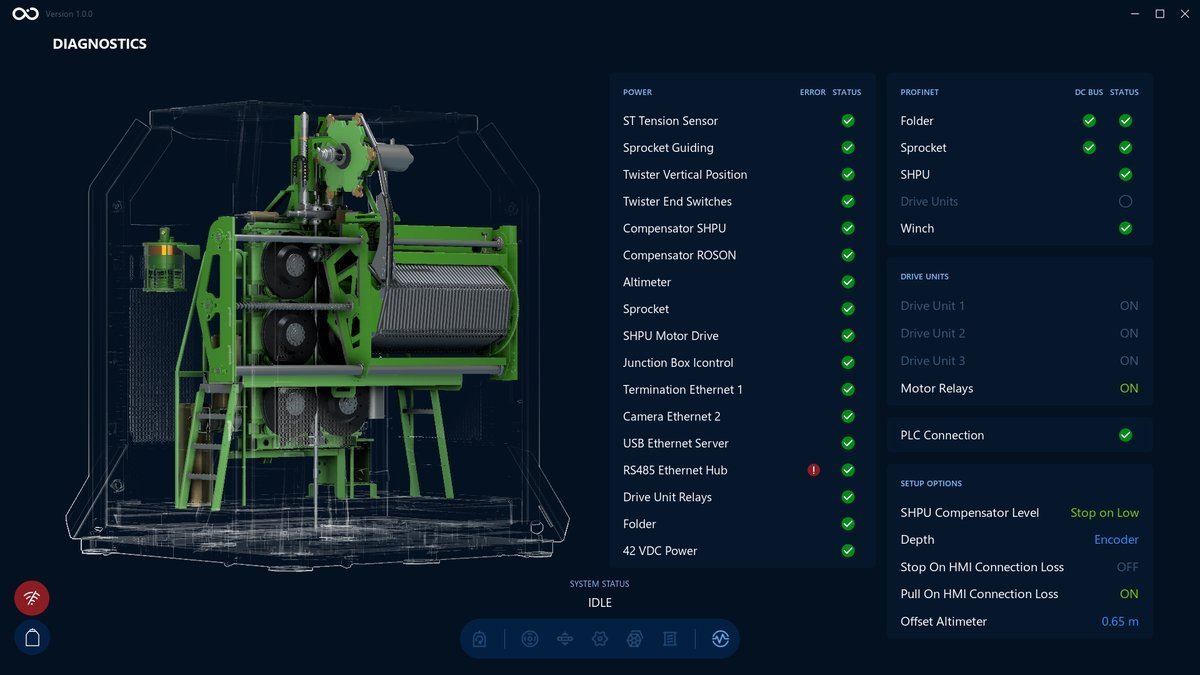

Read the system status message to know why the operation failed.
Controls
We will have a look at a brief description of the controls, their responsibilities and also how it reflects on the Visualization screen.
There are 3 available tabs with the different controls (Power, Drive Units and Setup Options) and Installed Probe Modules.
Power tab
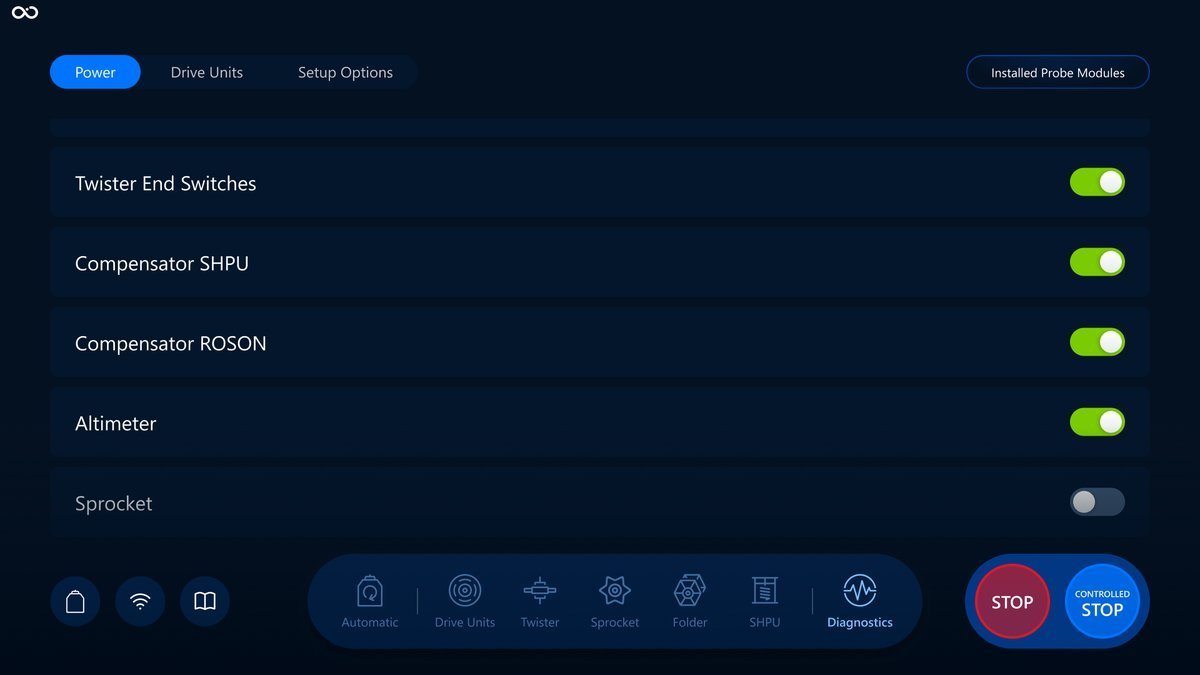
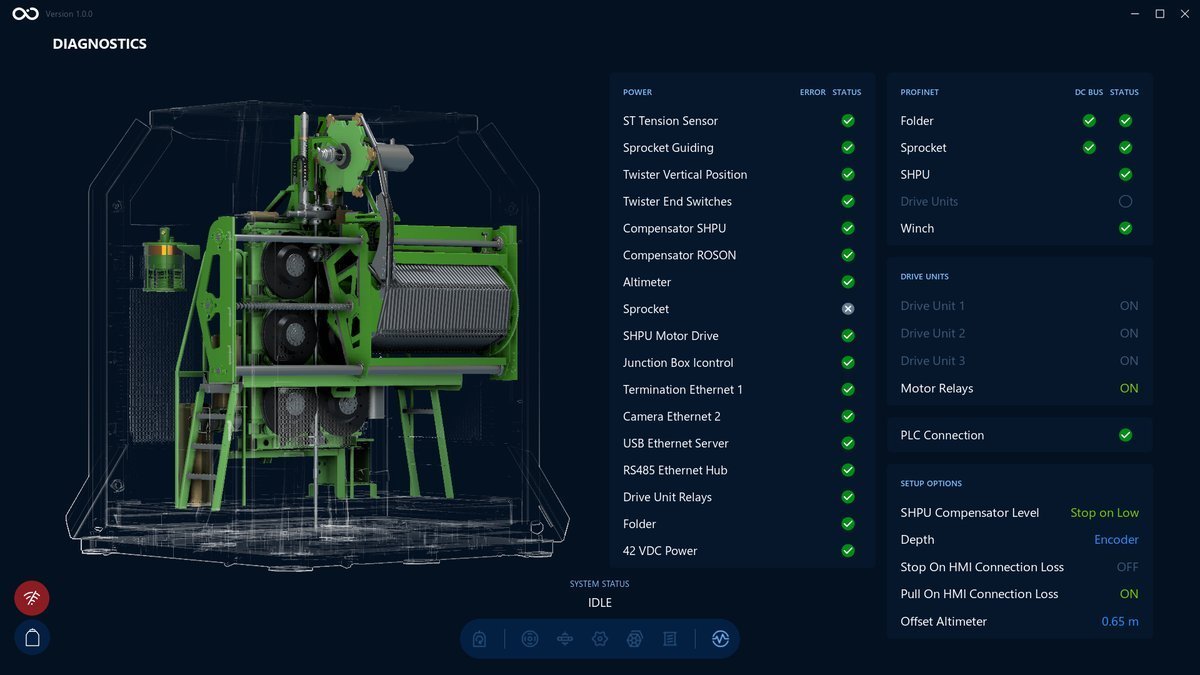
In the power tab, the corresponding function can be powered on or powered off. Next, you will see an example of an interaction with the toggle that powers off the Sprocket and how it reflects on the visualization screen:
Control action:
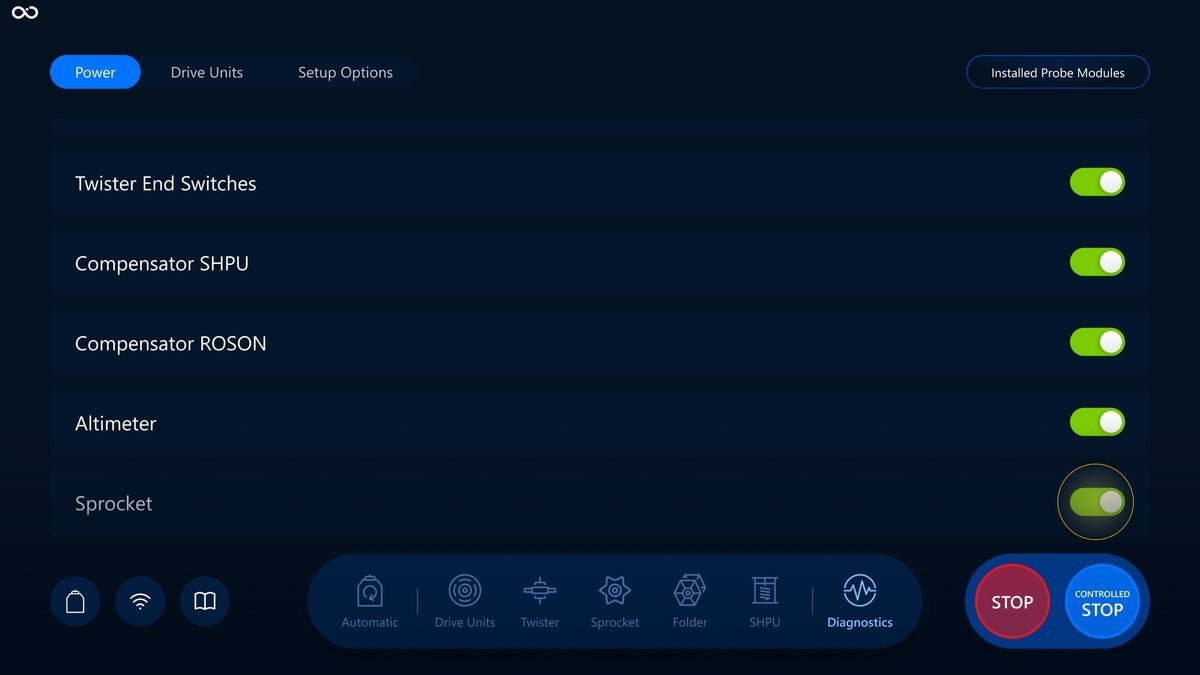
Toggle is turned off:
The Sprocket is powered off on the Visualization screen:
The same logic applies to other toggles in the power tab.
Termination Ethernet 1 button and toggle are disabled for clicking. As an exception, this toggle is disabled at all times because it directly affects the connection between HMI/OPC Server and the PLC.
Drive Units tab
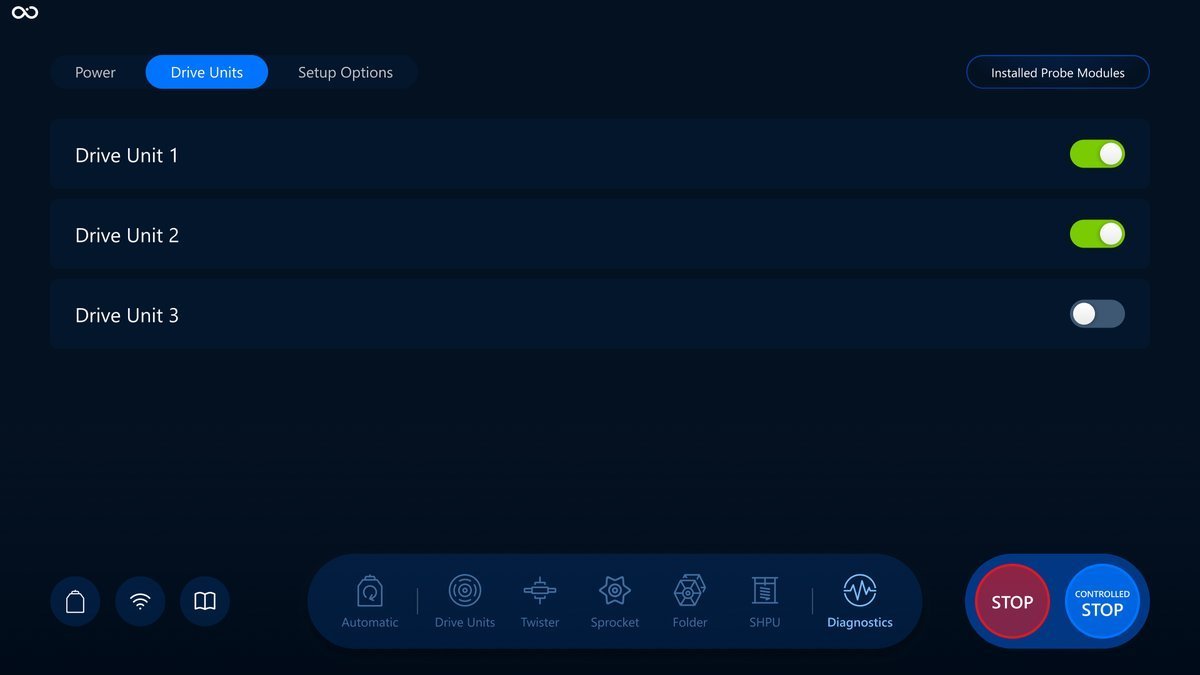
In the Drive Units tab, you can turn on or turn off each Drive Units power individually. Here is an example of an interaction with the toggle that turns off the Drive Unit 3 and how it reflects on the visualization screen:
When Drive Unit Powered By switched to Relays, Diagnostics: Drive Units tab is disabled.
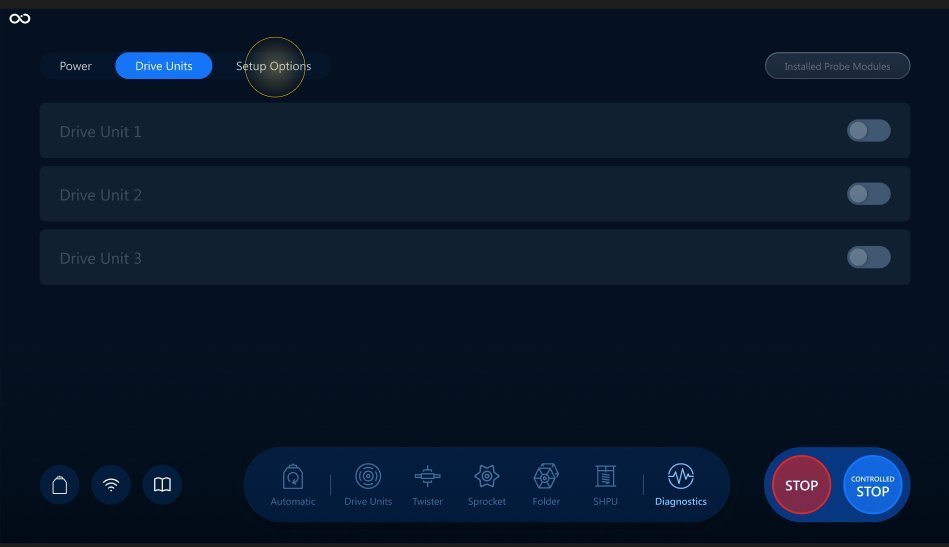
Control action:
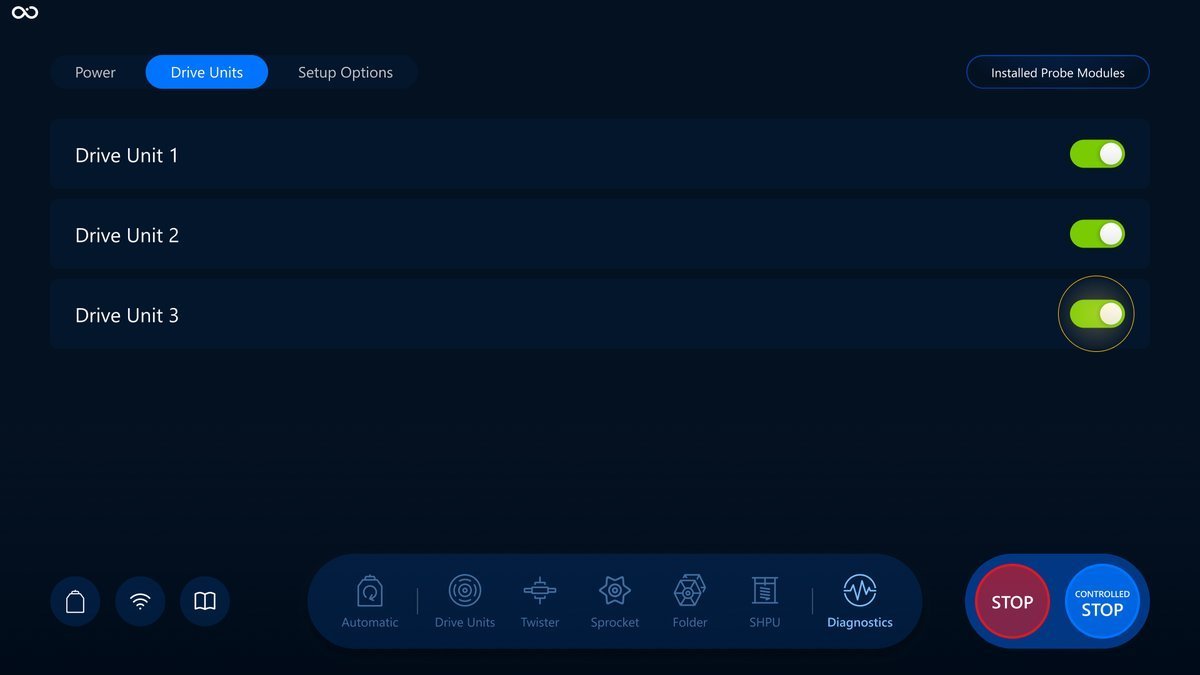
Toggle is turned off:
The Drive Unit 3 is turned off on the Visualization screen:
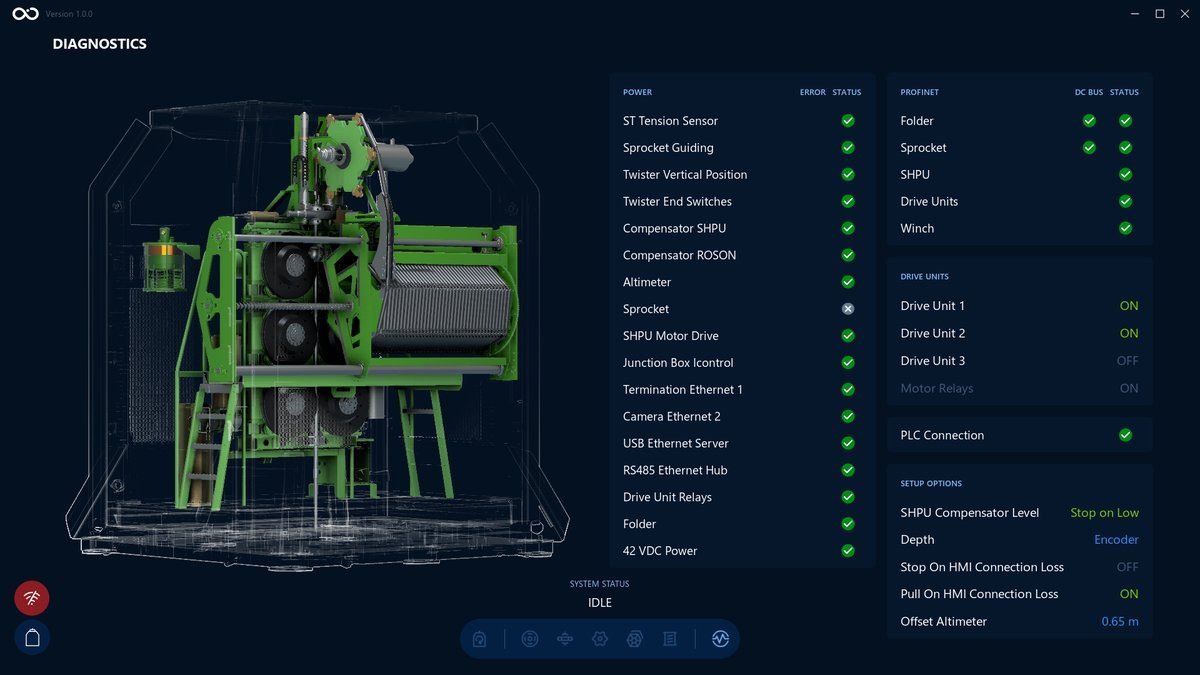
The same logic applies to other toggles in the drive units tab.
Setup Options tab
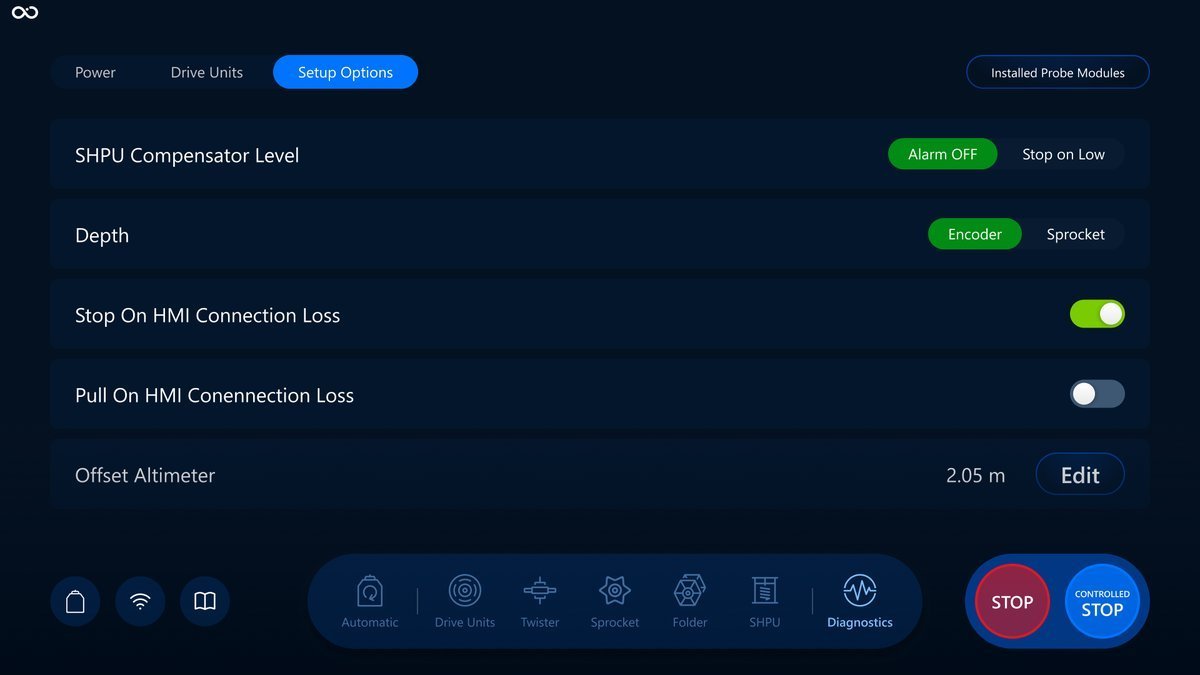
In the Setup Options tab, there are different functions you can manage, lets take a closer look:
SHPU Compensator Level
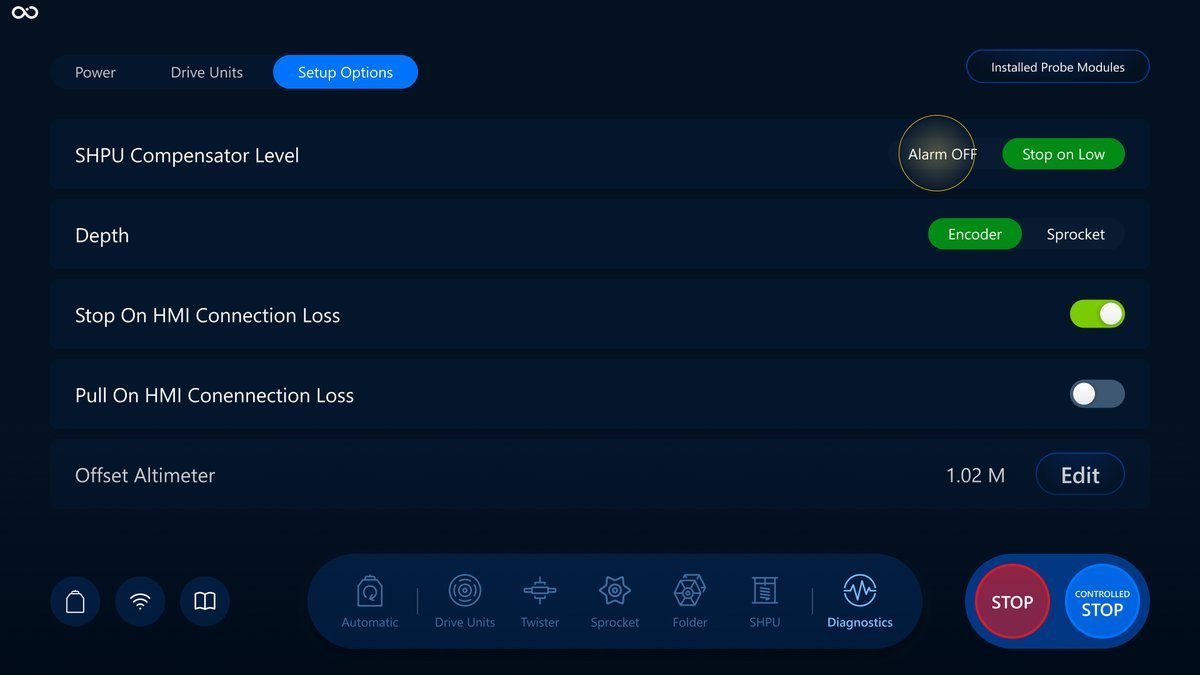
You can switch between Alarm OFF and Stop On Low functions by tapping on the desired option.
Tap to switch SHPU Compensator Level to Alarm OFF:
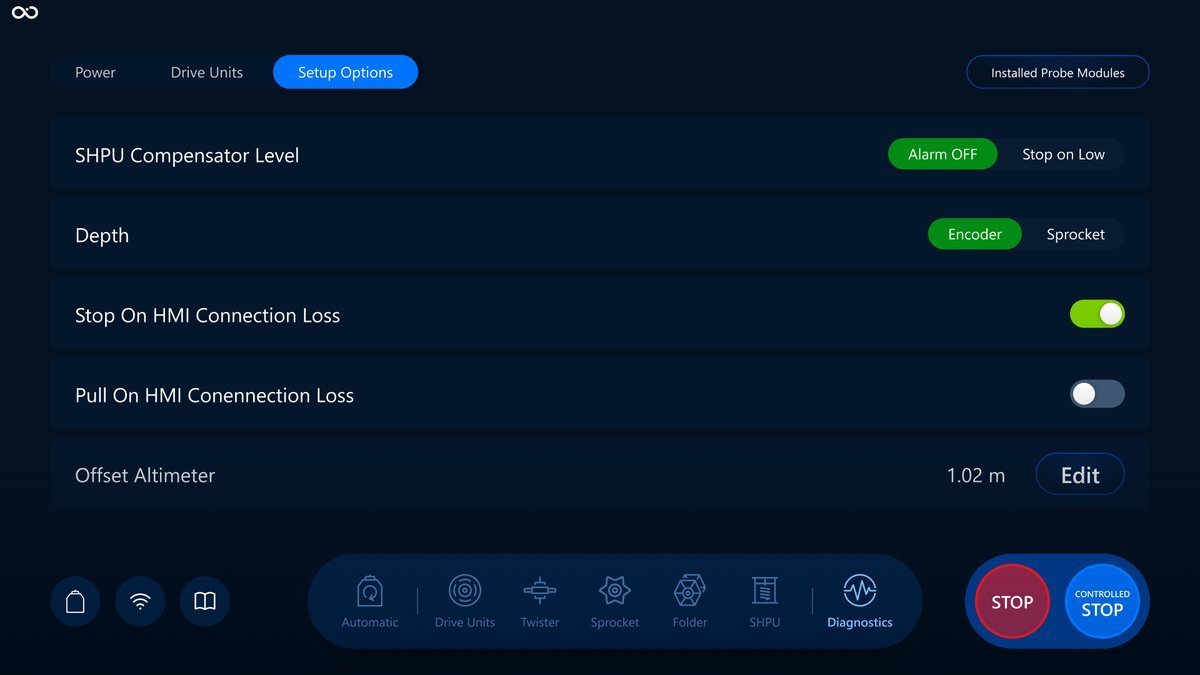
Visualization screen:
Depth
You can switch between Encoder and Sprocket functions by tapping on the desired option.
Tap to switch Sprocket to Encoder:
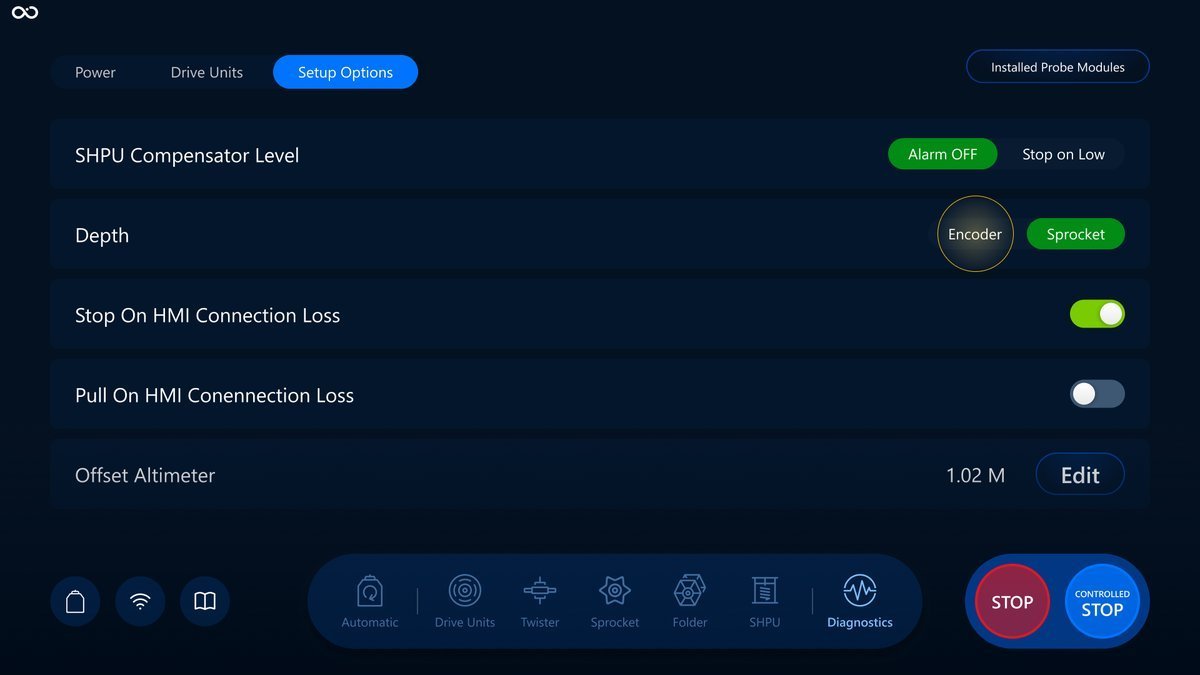
Visualization screen:
Stop On HMI Connection Loss
Pull On HMI Connection Loss is Disabled when Stop on HMI Connection loss is Off.
Tap Stop on HMI Connection loss to turn on the function:
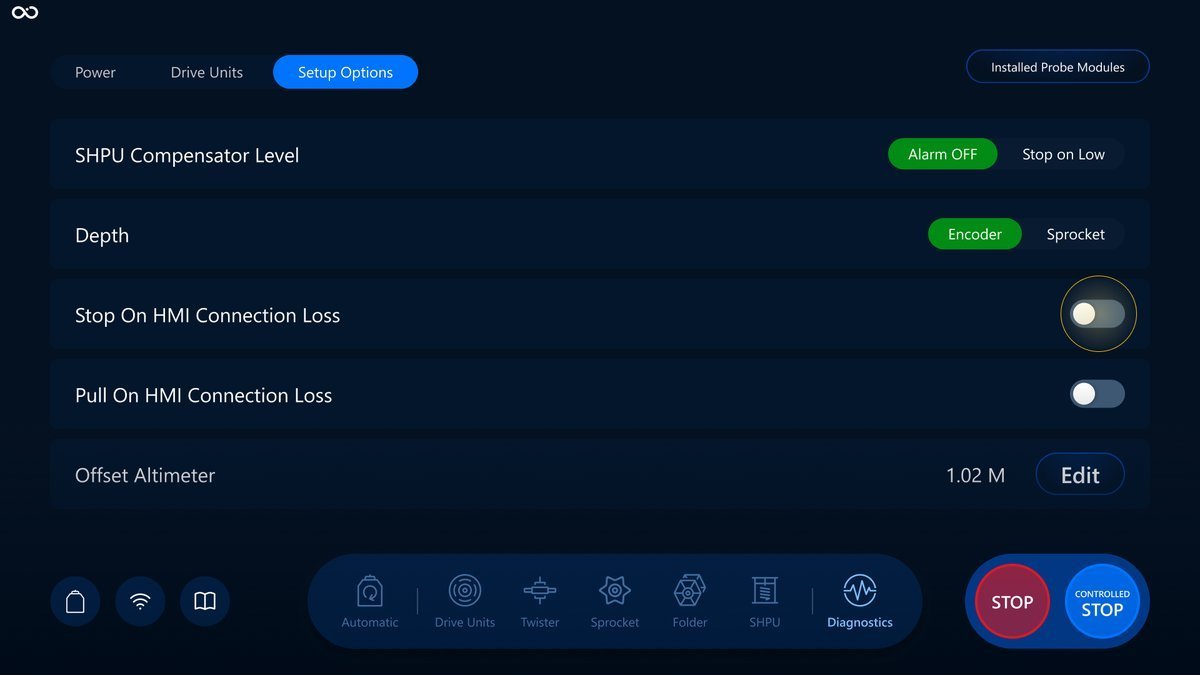
Toggle is turned on:
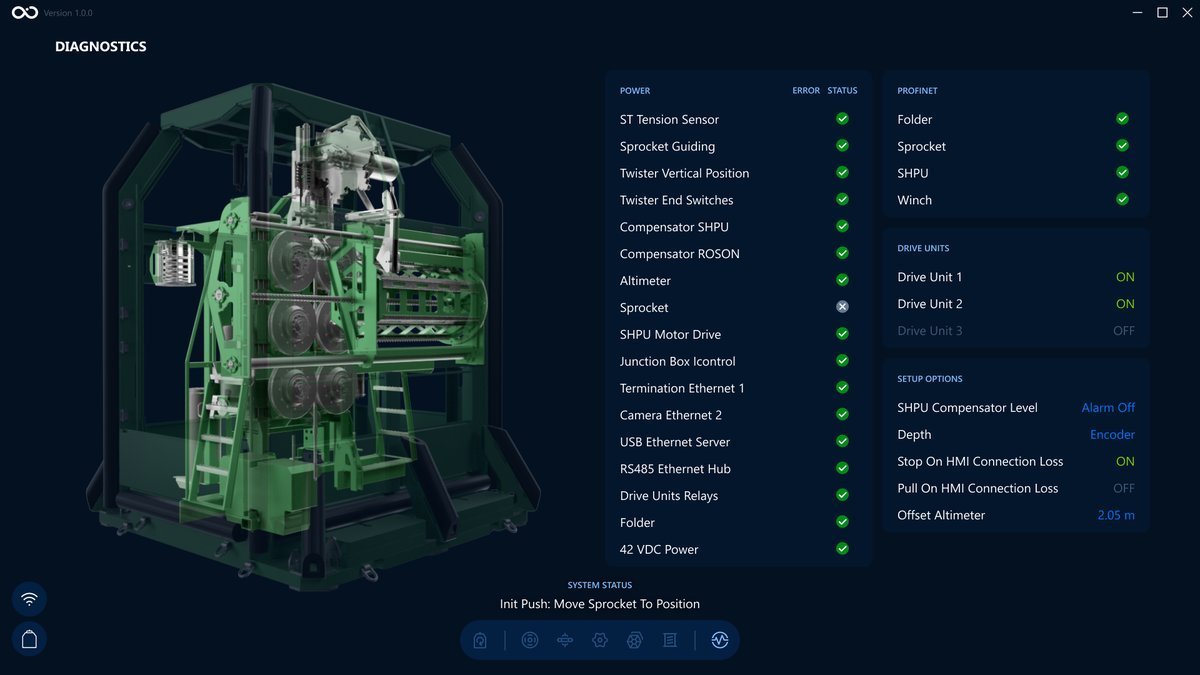
The Stop On HMI Connection Loss is turned on. Visualization screen:
The same logic applies to the Pull On HMI Connection Loss toggle.
Offset Altimeter
Tap the Edit button to open the modal to change the value. A number on the left side of the button shows the current value. If there is no number, the value still needs to be set.
Here is an example of changing the value for the Offset Altimeter:
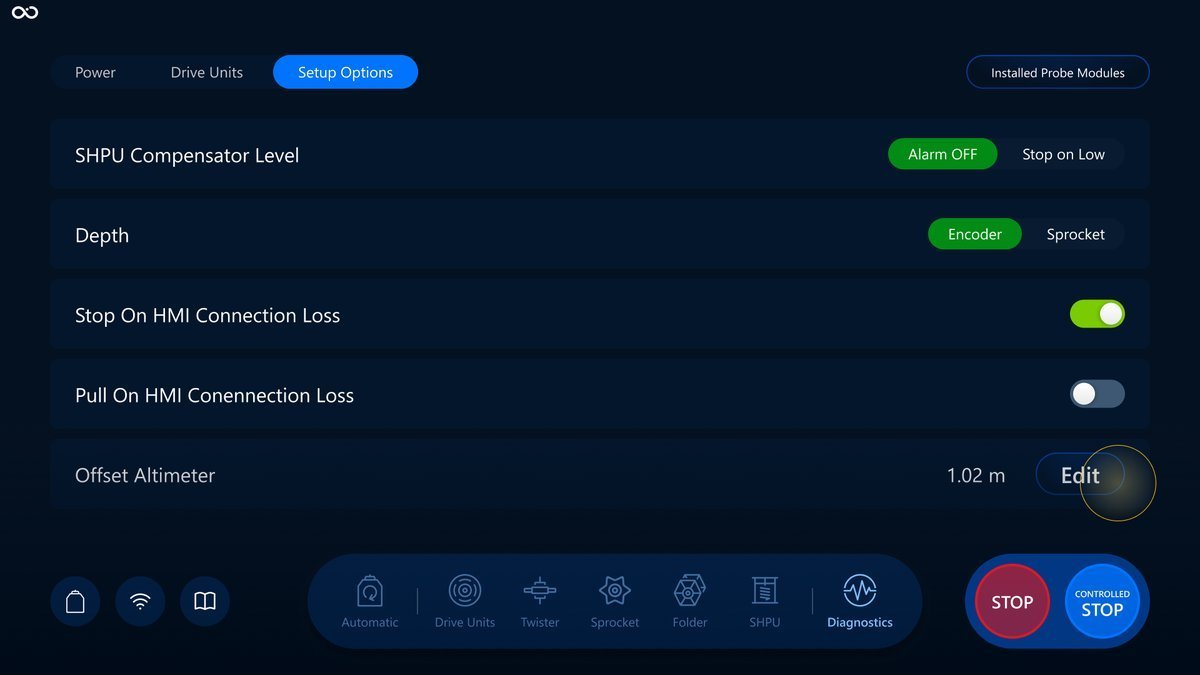
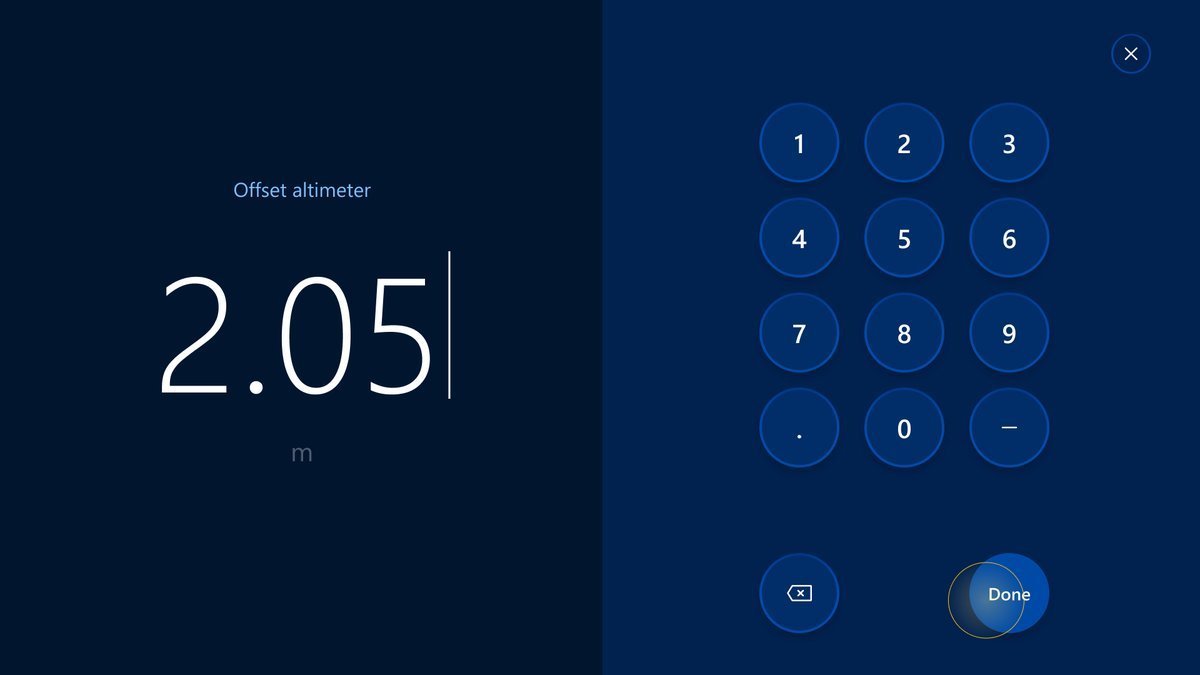
After you set the value into Offset Altimeter it receive Waiting status.

If response was successful than toggle would receive the Activated status. After 5 sec status will switch into Enabled.

If connection failed, Offset Altimeter will receive Warning status.

The value changed to "2.05m" on the Visualization screen and on the label next to the "Edit" button:
Installed Probe Modules
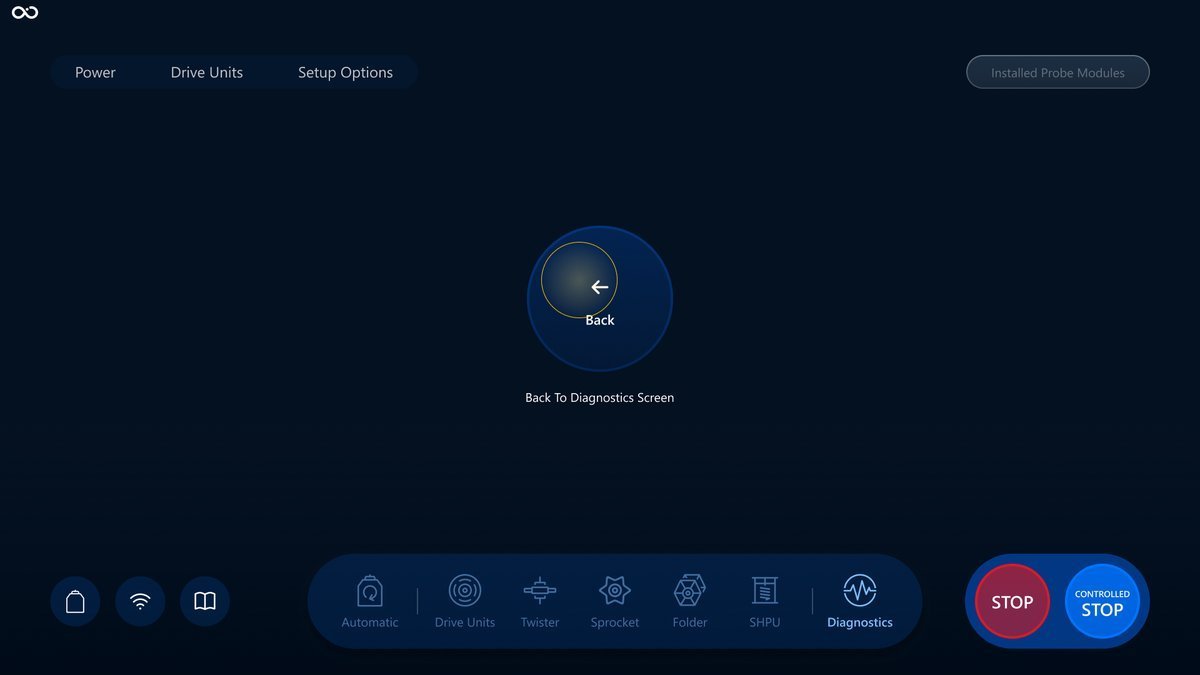
The button opens the modal on the Visualization screen with the modules installed in the Roson. The button is enabled if there is an active connection to ROSON.
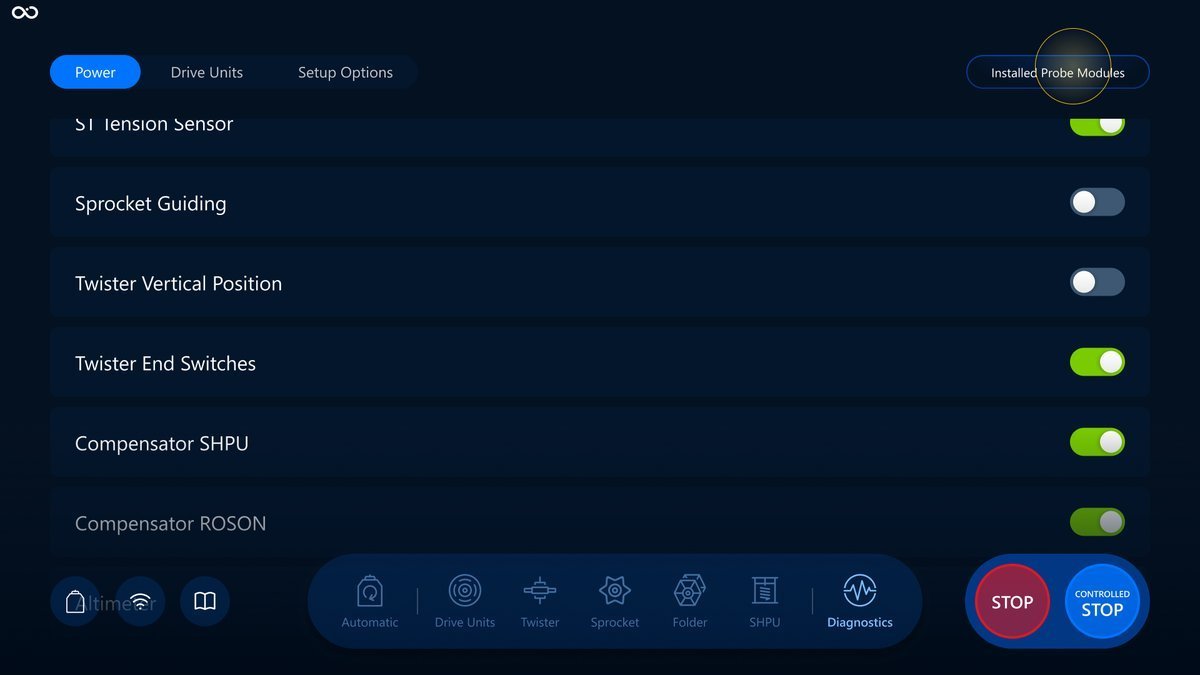
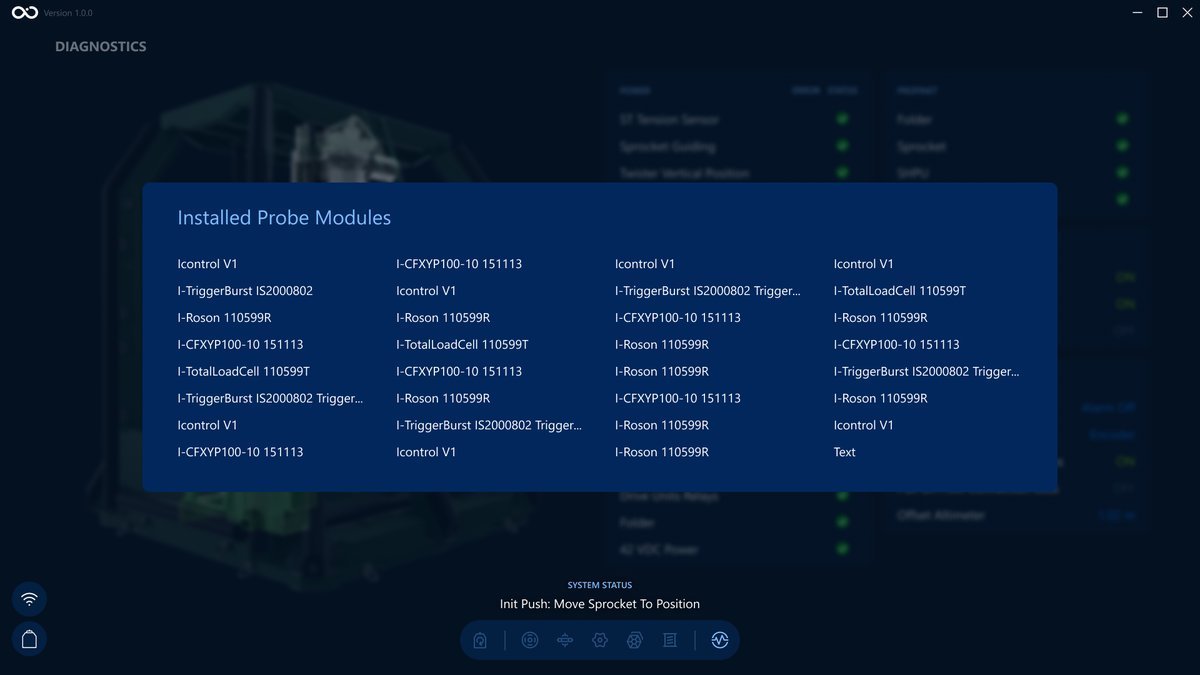
To close the modal tap the Back button which will be displayed right after you open the modal.
What's next?
Feel free to have a deeper dive into the Network section by following this link: Network overview.