Graph Presets
You can configure graph presets to customize the Data Acquisition phase of the CPTs.
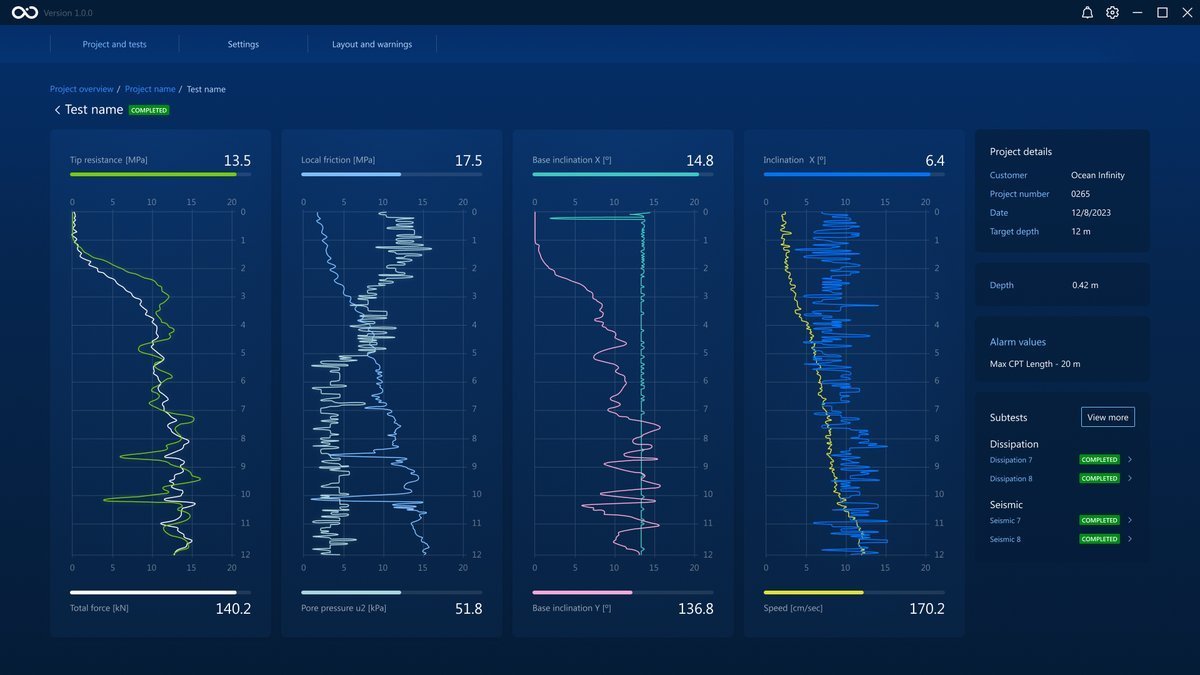
Graph presets let you choose which type of data (channels) you can see being plotted in the four available graphs and customize the colors of the graphs for better visualization. The image below shows a test with a custom preset in which eight different channels can be seen being plotted, two per graph, each in a different colored line.
Configure Graph Presets
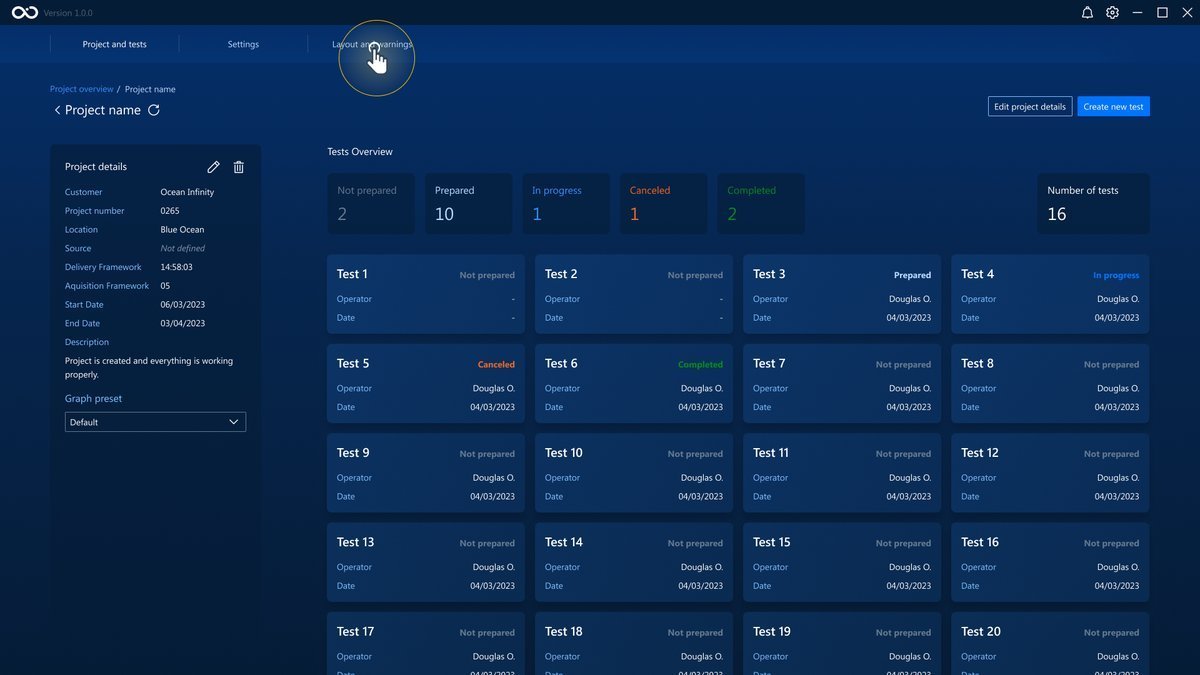
The page to configure graph presets is accessed by clicking on the Layout and warnings button on the top bar.
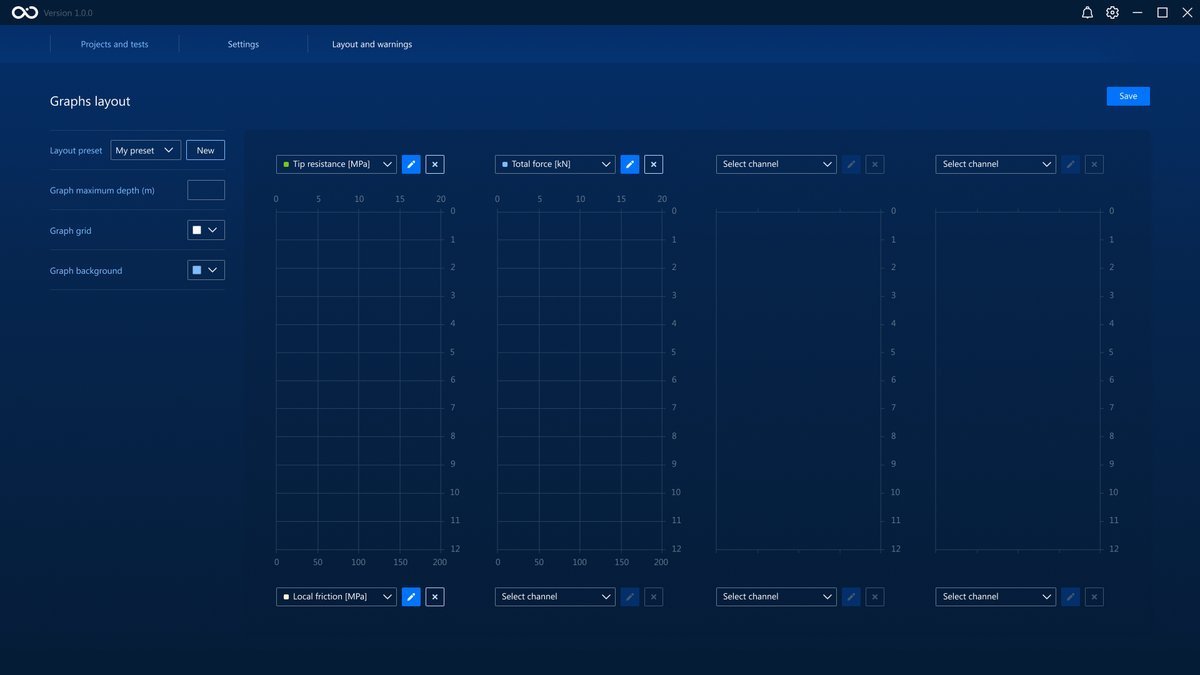
On this page you can:
- Create a new preset
- Define general graphic properties for a preset
- Define properties of a channel belonging to a preset
Create a new preset
To create a new preset, click the New button next to the dropdown menu Layout preset to the left of the screen.
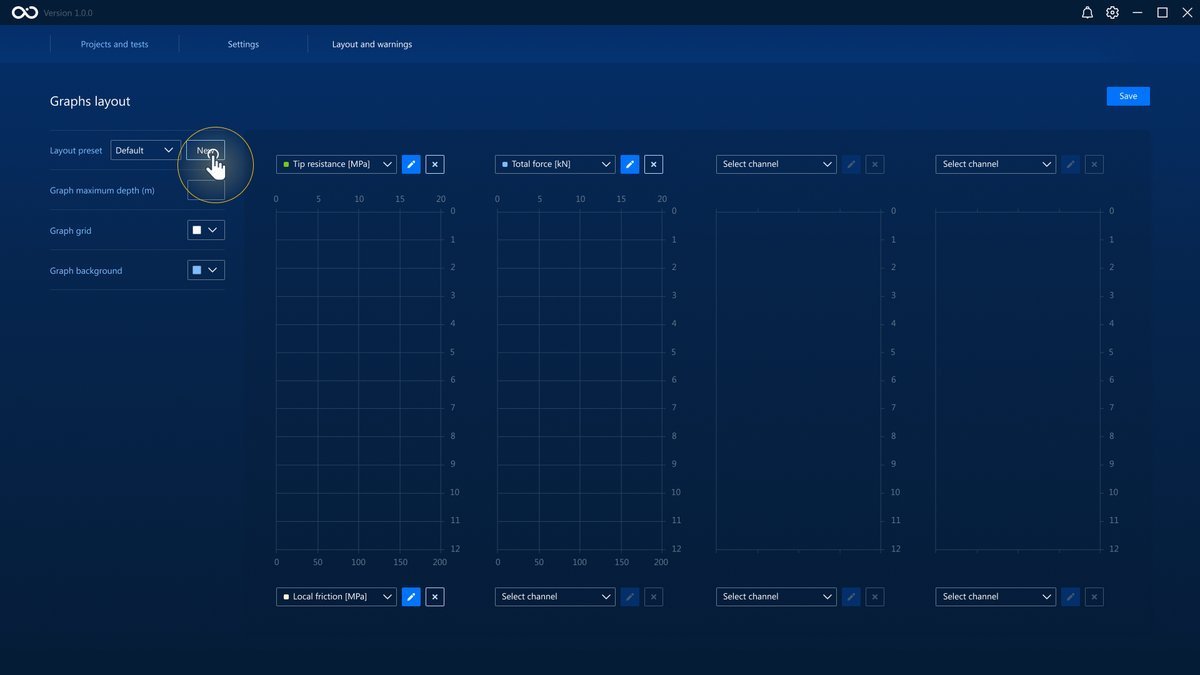
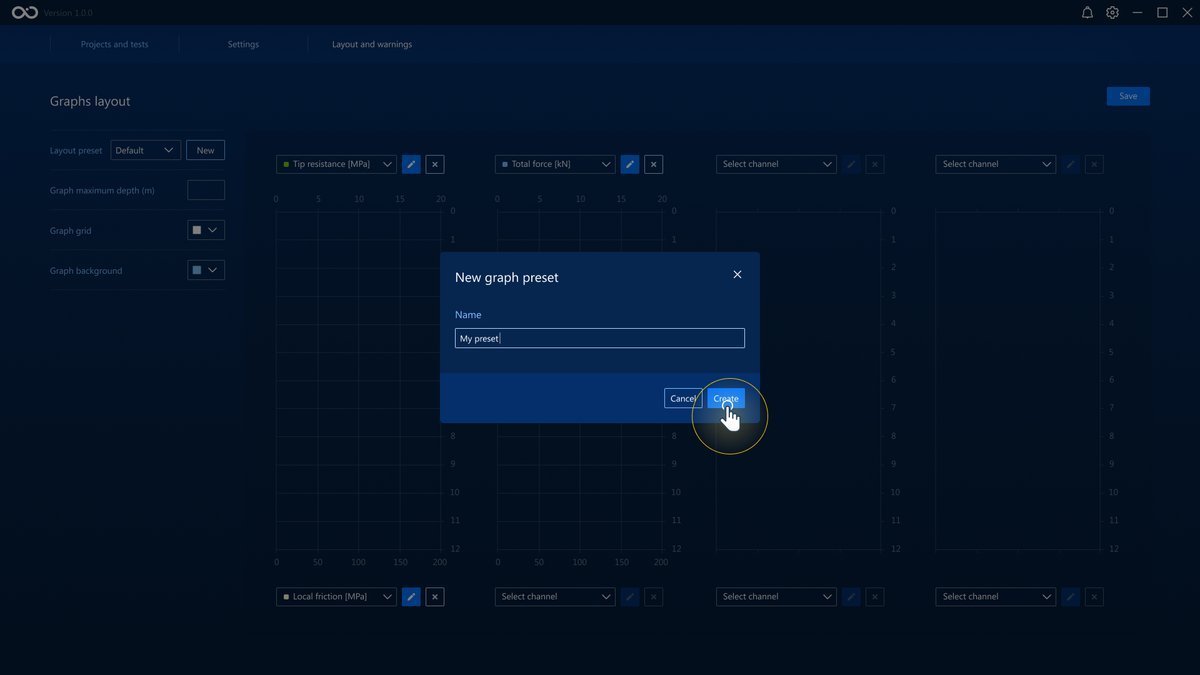
A new window will show where you can input a name for the new preset.
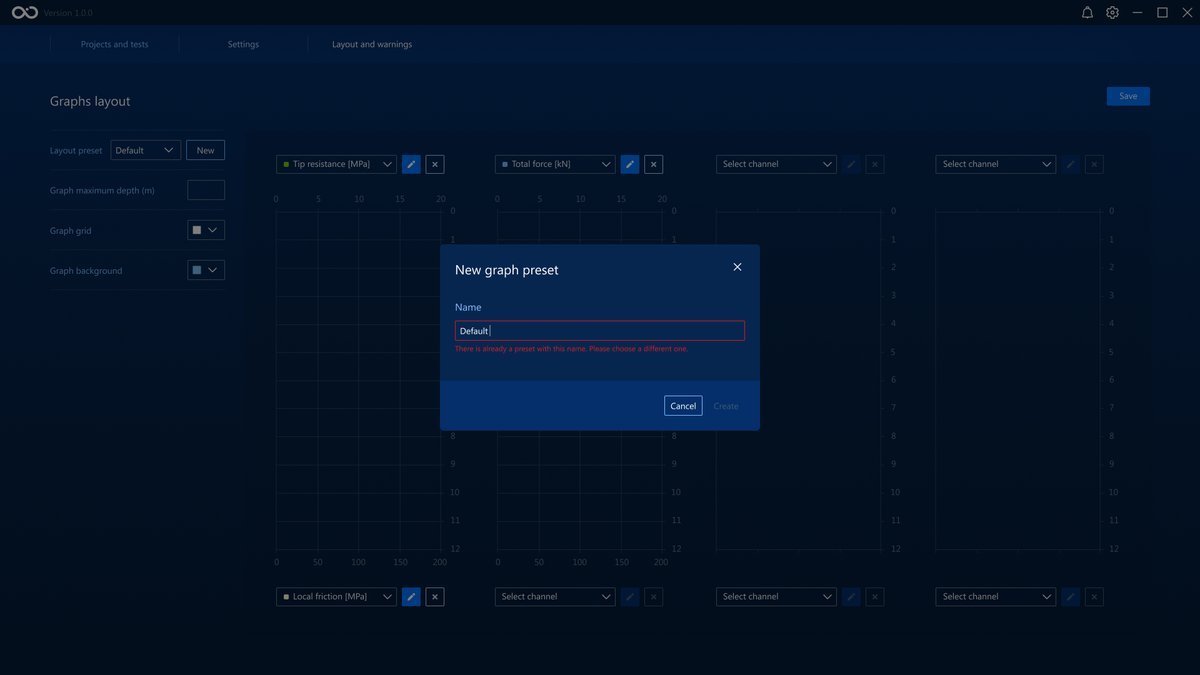
There cannot be two presets with the same name. If you try to write an existing name, an error will show under the text box.
Click on the Create button, and the new preset will be created and automatically selected.
Define preset properties
Select the preset you want to edit on the Layout Preset dropdown button.
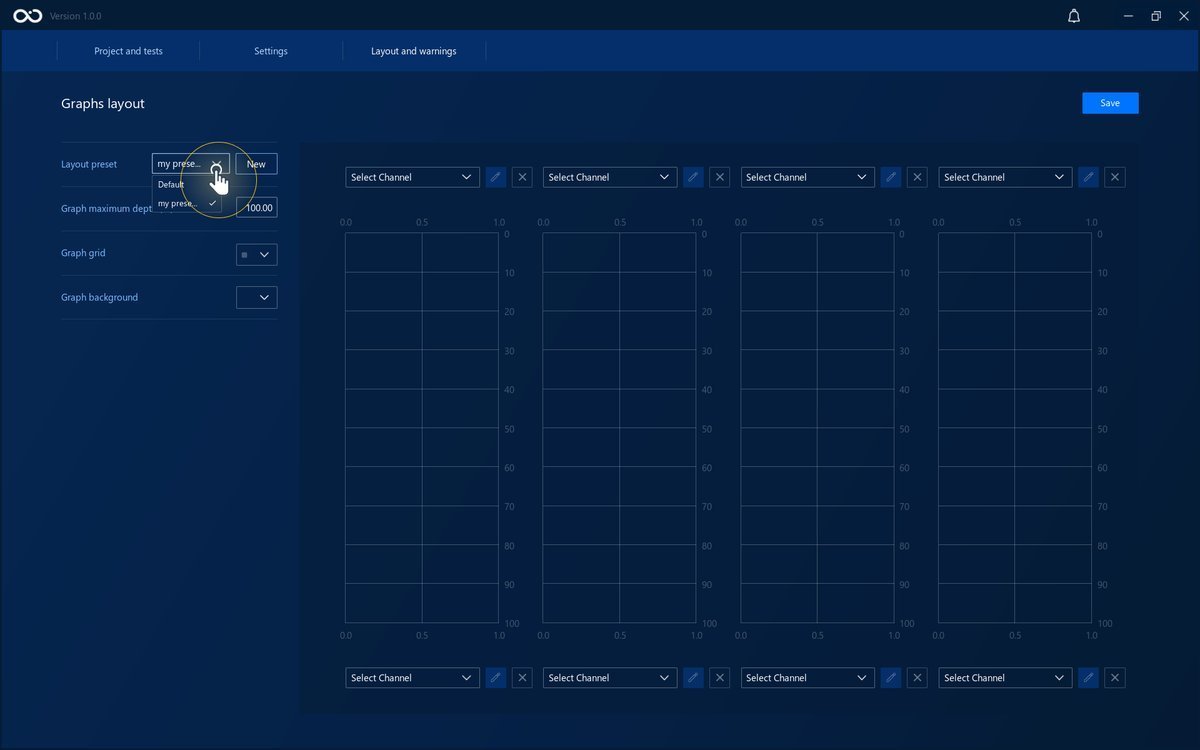
You can change three properties for each preset: Graph maximum depth, Graph grid color and Graph background color.
| Property | Explanation | Example |
|---|---|---|
| Graph maximum depth (m) | Every graph in this preset will show data between 1 and the defined maximum depth (in meters). | 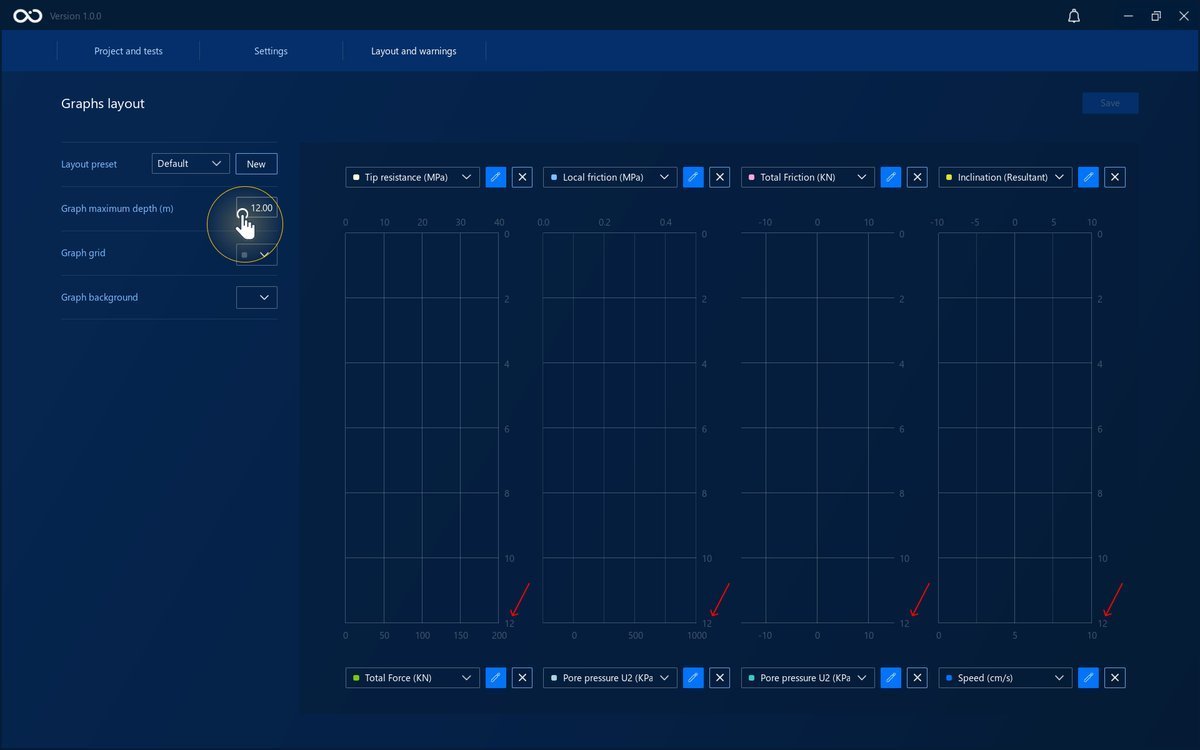 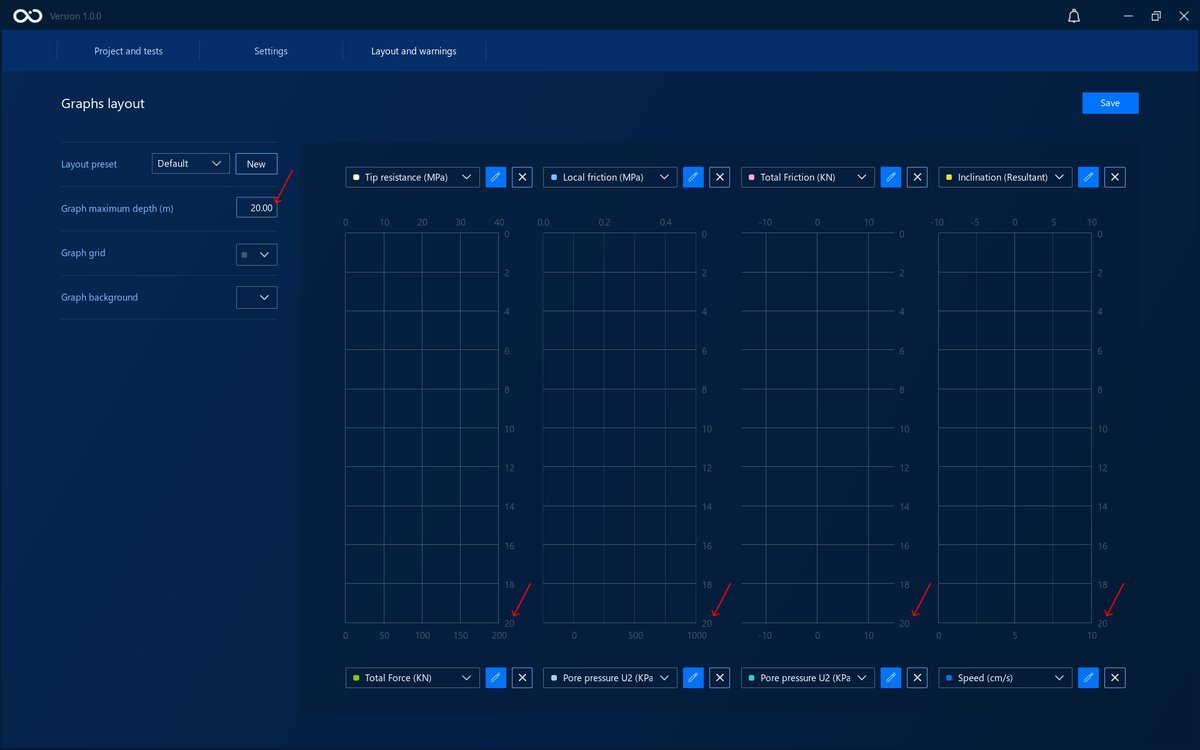 |
| Graph grid | The grid's color of every graph | 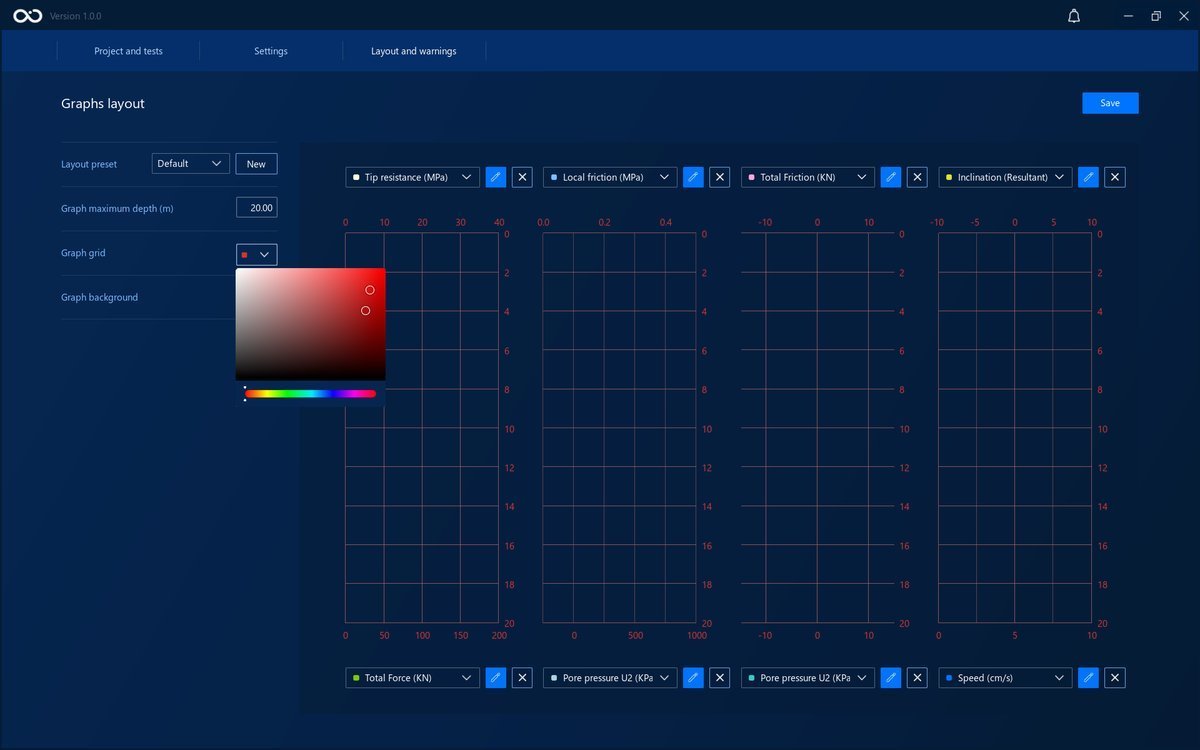 |
| Graph background | The background's color of every graph | 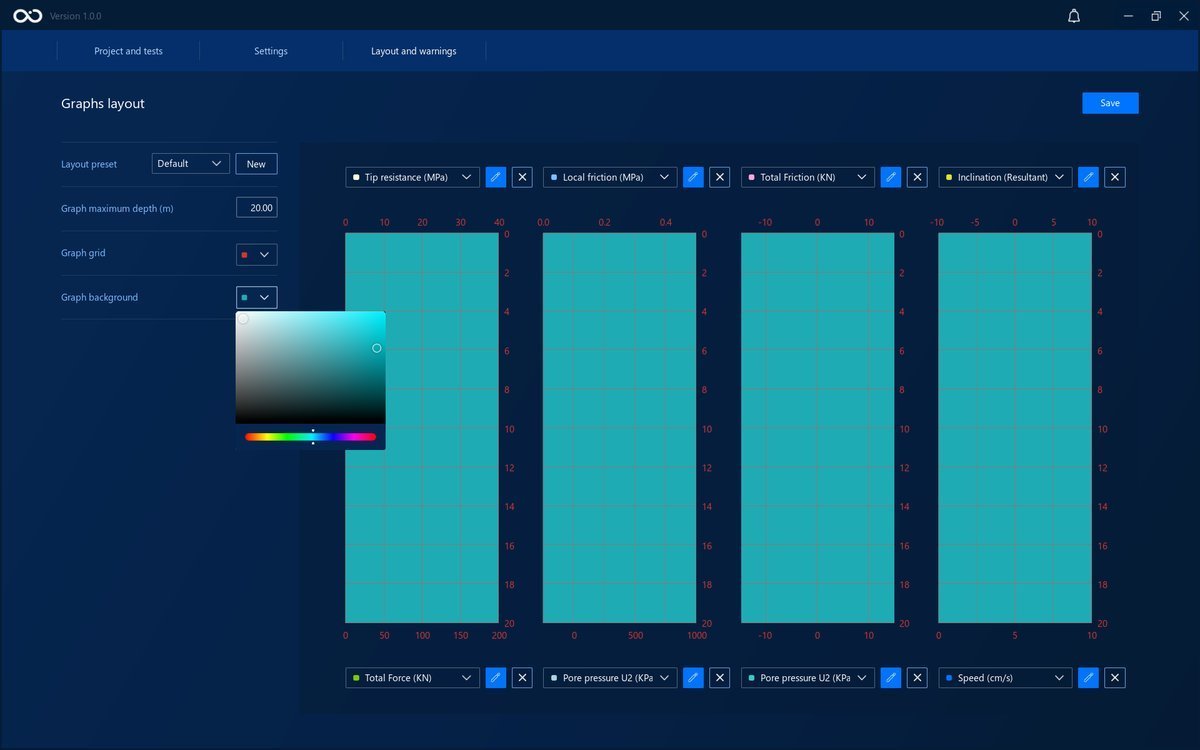 |
Define channel properties
A preset can hold up to eight channels, with a maximum of two per graph. You can add, switch, or remove channels from the presets. You can also edit the graph's line colors and the graph's range for that channel.
| Property | Explanation | Example |
|---|---|---|
| Add/Switch a channel | Add or switch a channel to a specific graph using the dropboxes above or below the graphs | 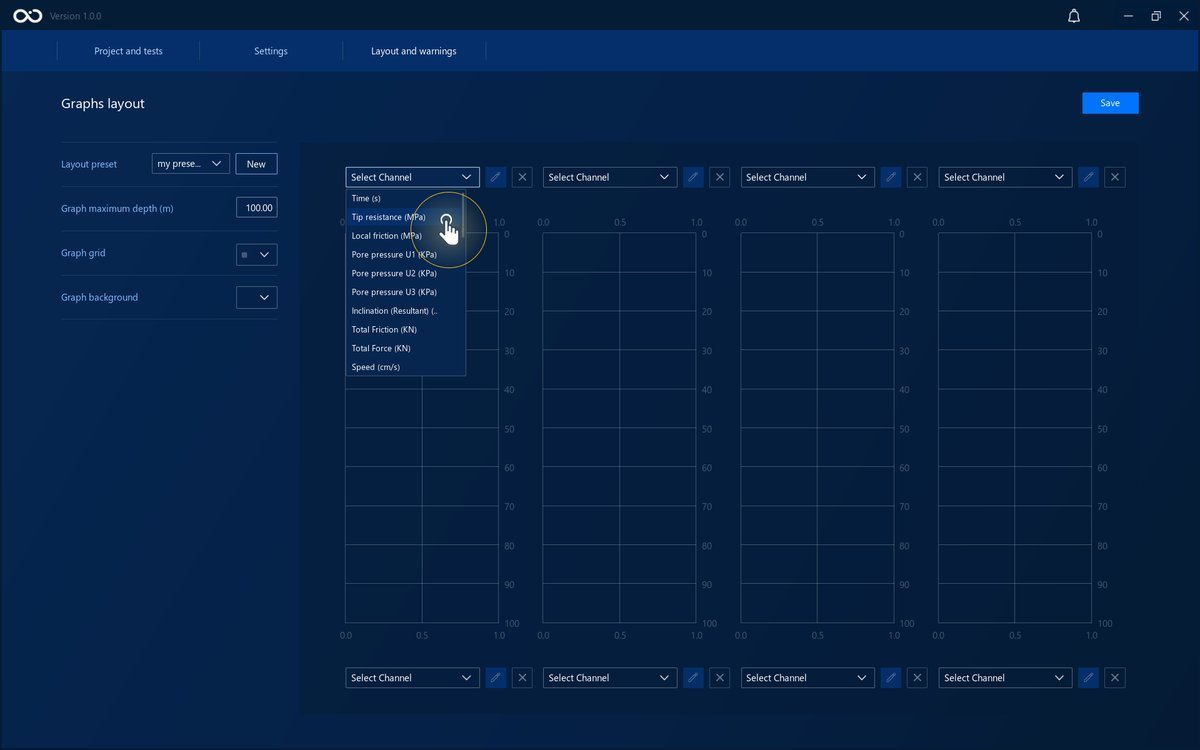 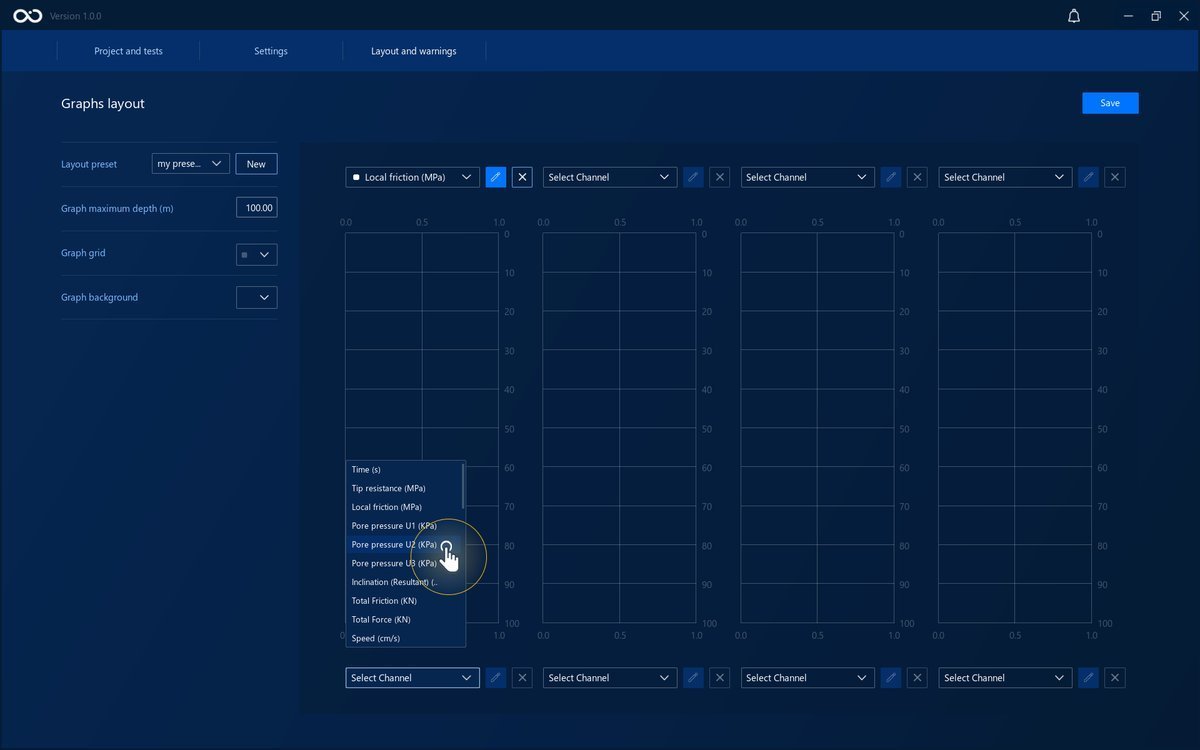 |
| Remove a channel | Remove a channel from the preset. If a graph has no channels, nothing will be plotted in it | 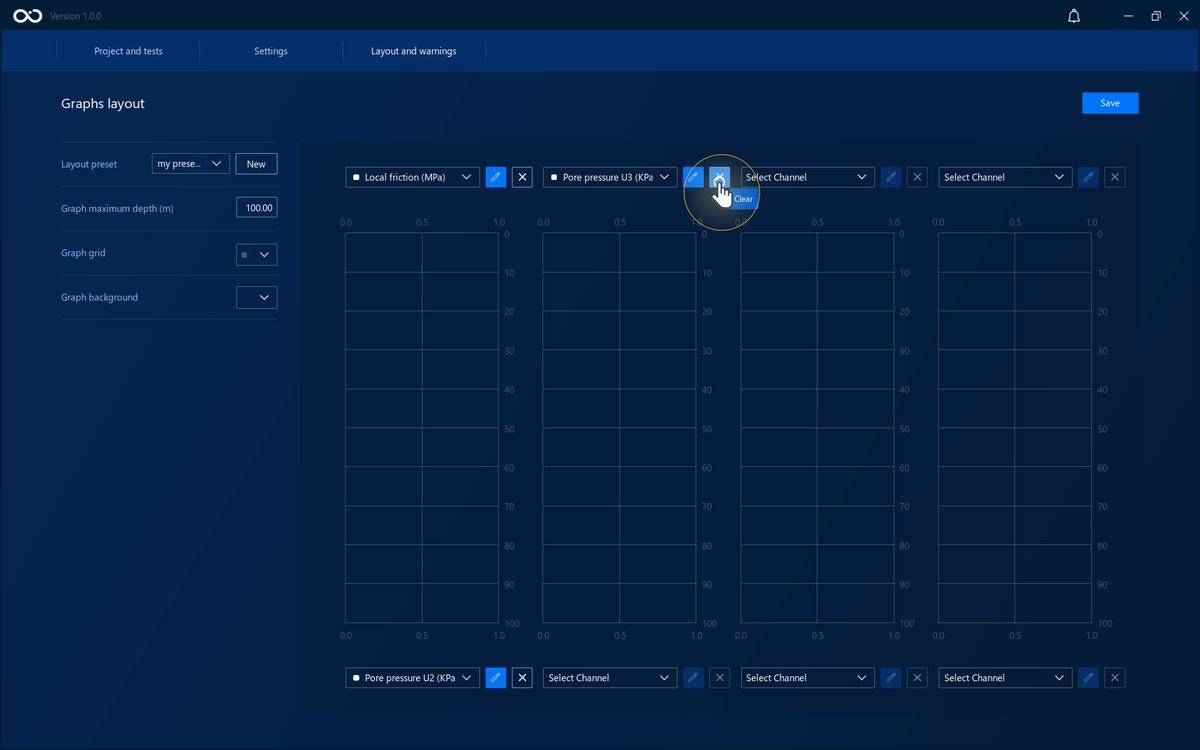 |
| Set range | Set minimum and maximum values for the graph to plot for that specific channel | 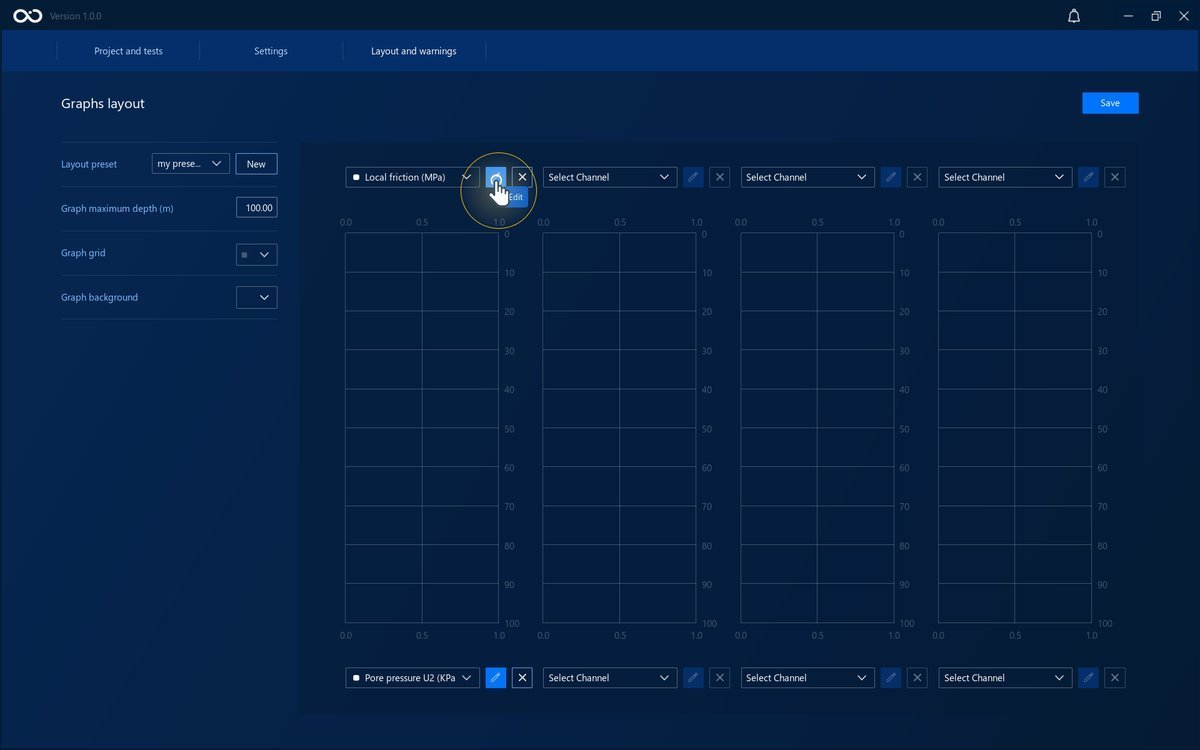 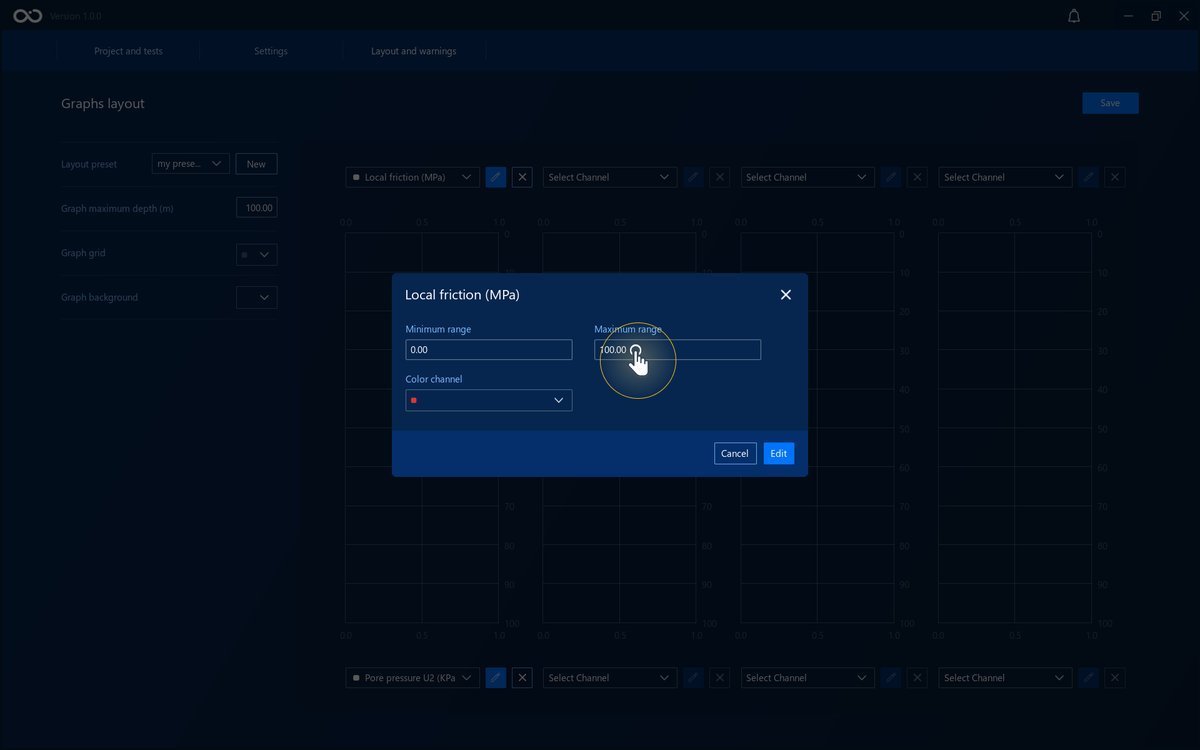 |
| Set line color | Set the line color that will be plotted for that channel | 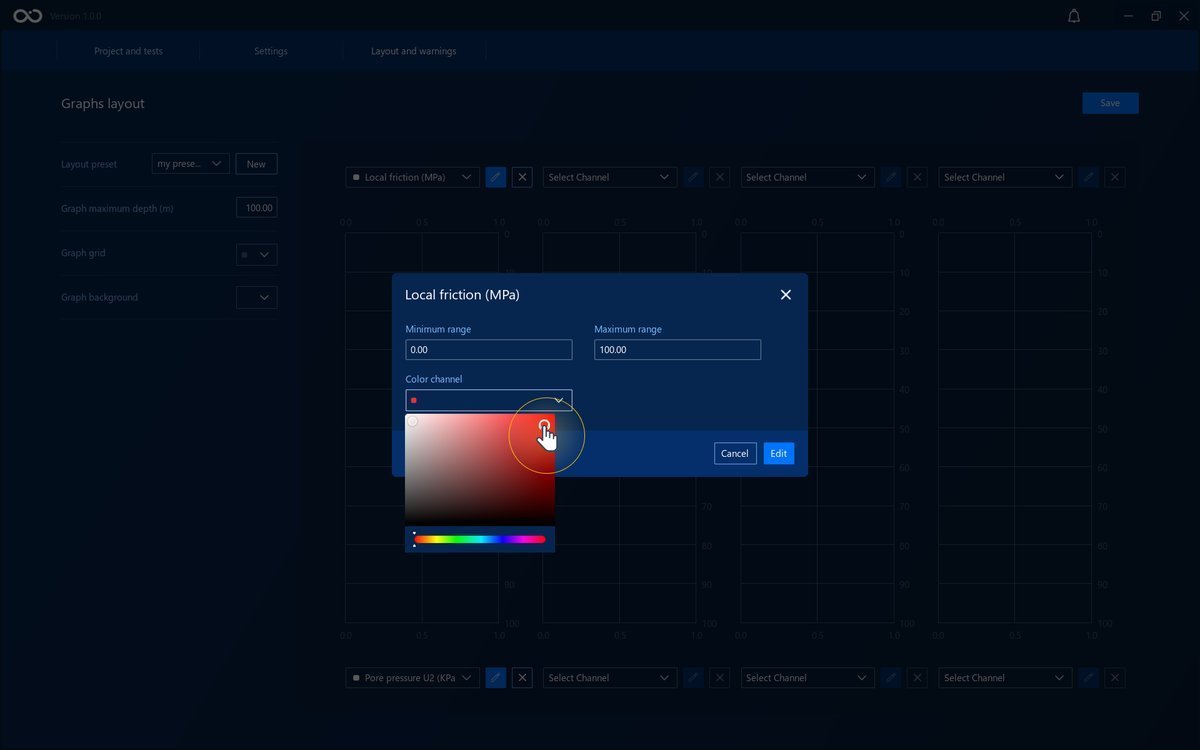 |
Save preset or Discard Changes
To save your changes to the preset, click the Save button.
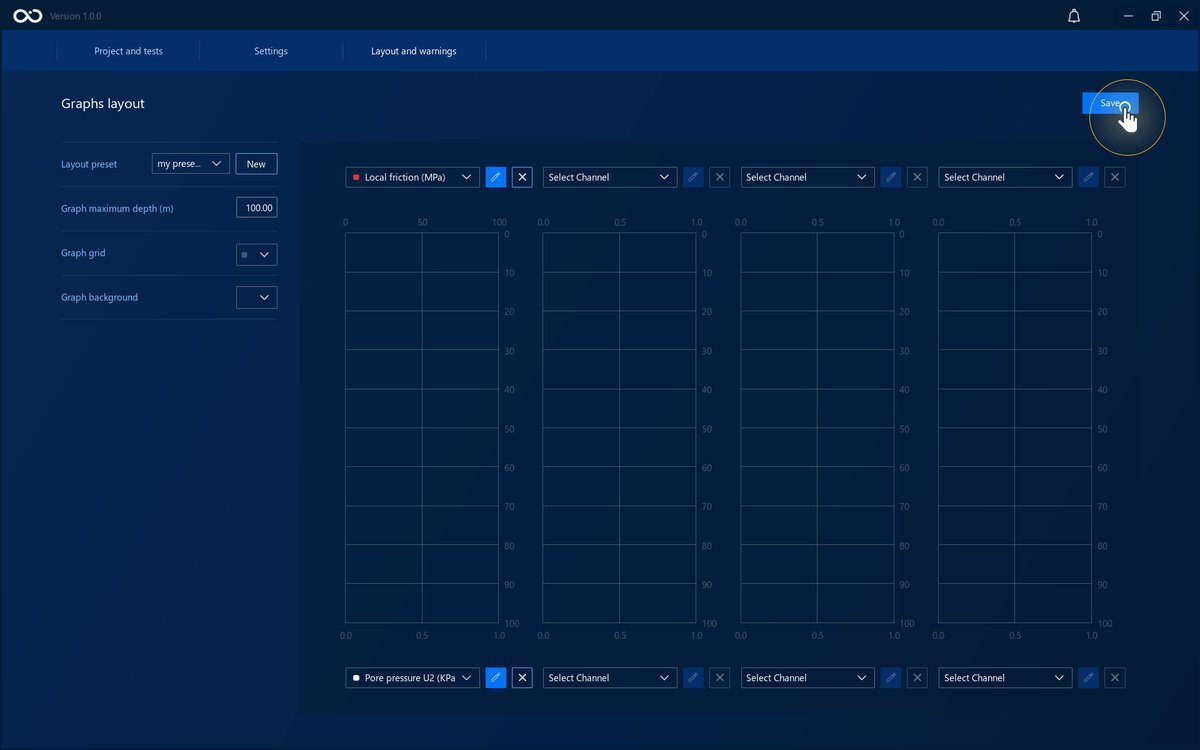
To discard any changes that were made, leave the page.
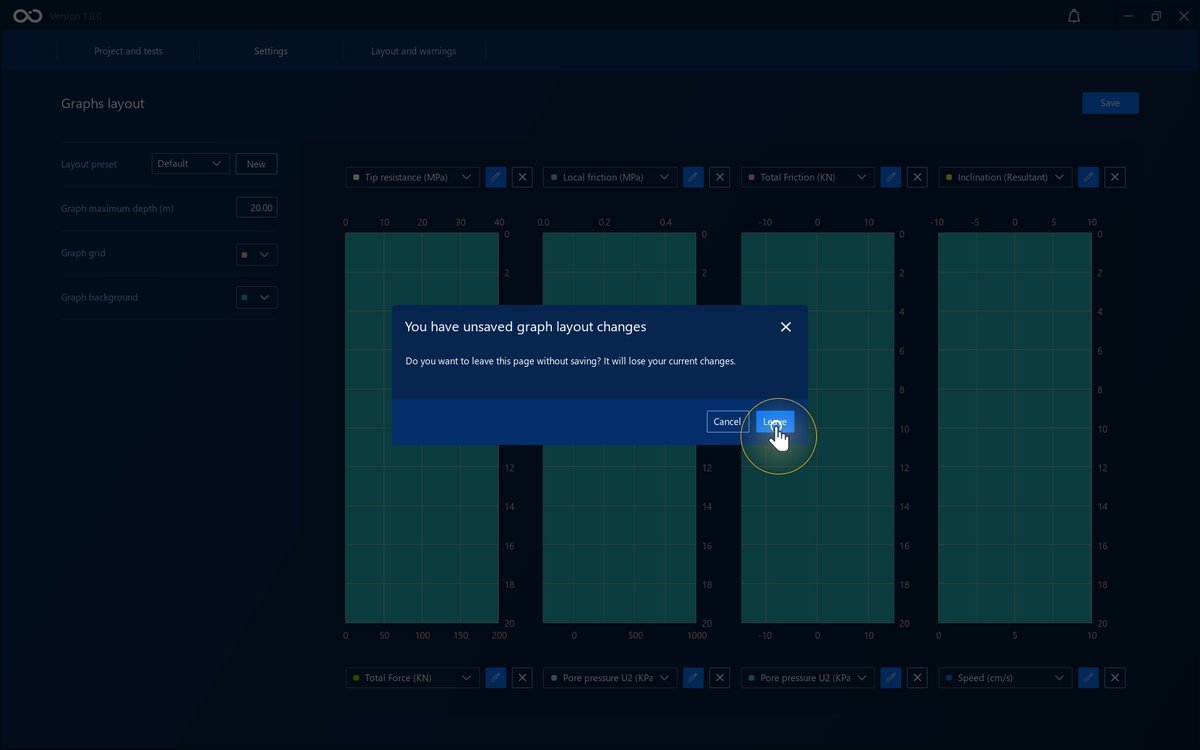
Select a Preset
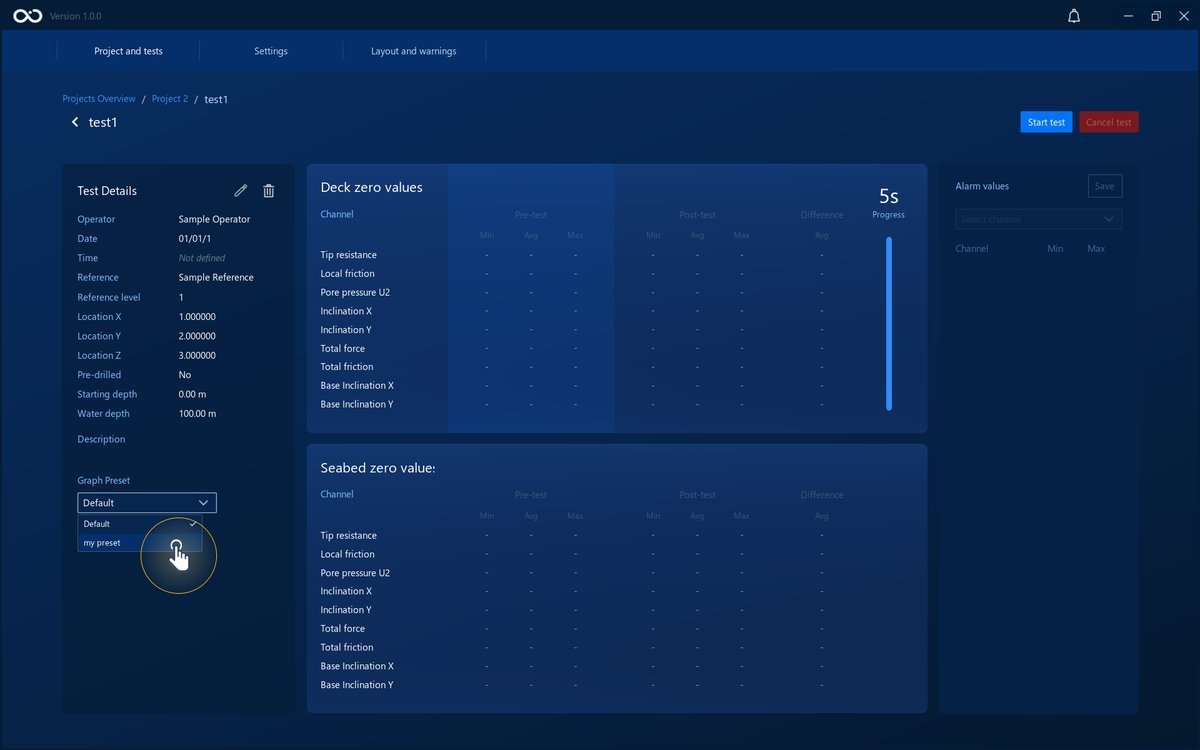
You can select a preset for all the tests in a project or for a specific test. This is only possible for tests that were not Completed or To Review.
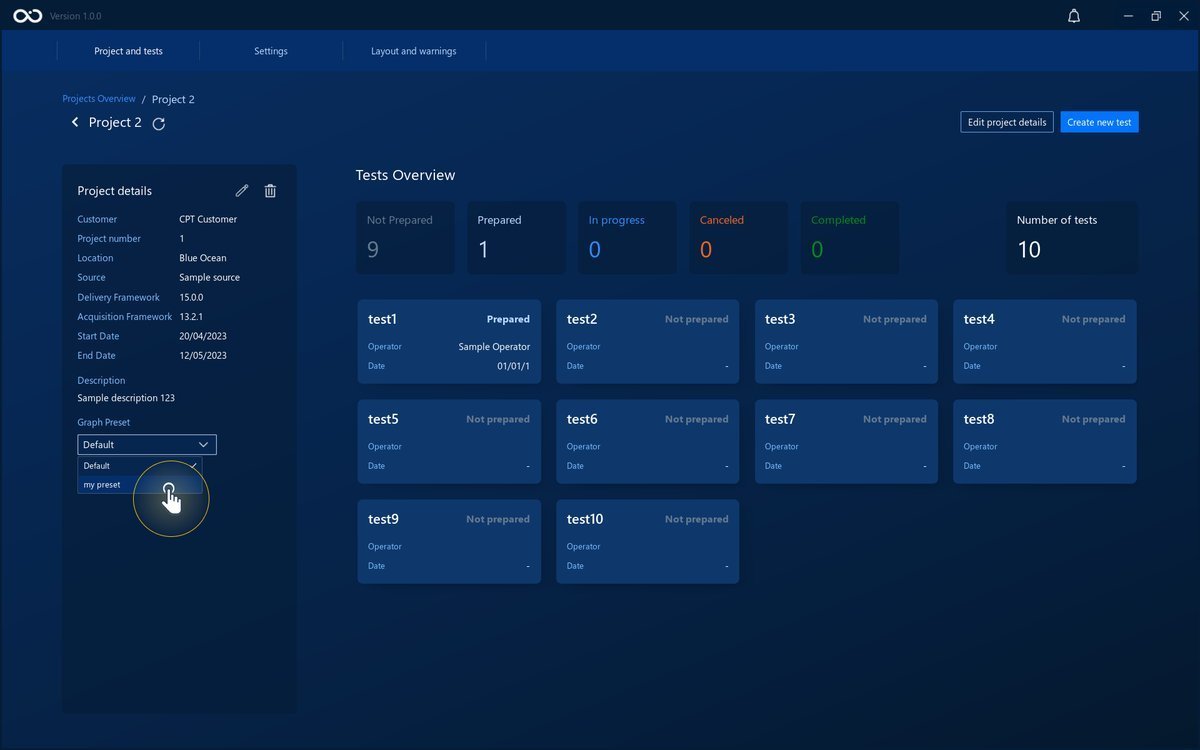
To select the same preset for all tests, use the dropdown button in the Project Dashboard.
Use the dropdown button in the Test Dashboard to select a specific preset for one test.