CPT Software Manual
This User Manual describes the software and environment that enables the remote operation of CPT Systems within the Armada infrastructure and via RCC.
The software allows:
- Operating the Roson remotely via an HMI interface.
- Preparing an Operation consisting of multiple CPTs.
- Viewing past CPTs.
- Handling live data acquisition from a CPT.
- Handling live data acquisition from Seismic and Dissipation Tests.
To properly operate a CPT System, it's strongly recommended to read the following documentation before operating the Remote CPT Software:
- DW-ROSON-ST-200-V5.pdf: Operating Instructions to operate the Roson
- Ifield-legacy.pdf: Legacy Ifield Manual.
About ↵
Glossary
| Abbreviation | Description |
|---|---|
CPT |
Cone Penetration Test |
CW |
Clockwise |
CCW |
CounterClockwise |
DPC |
Dynamic Payload Controller |
RCC |
Remote Control Center |
SW |
Software |
HMI |
Human Machine Interface |
Ifield |
Data Acquisition Software. Also known as ICC |
Ended: About
Introduction ↵
Software Organization
Screens Organization
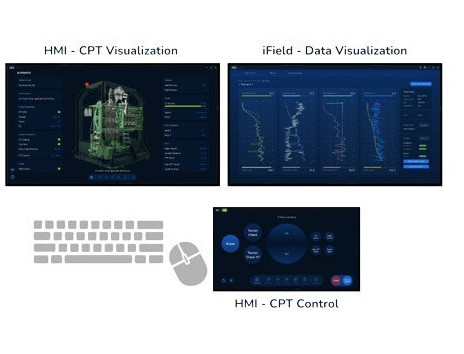
The following applications constitute the CPT Software:
- HMI - CPT Visualization: will present Roson’s digital twin and additional telemetry while operating.
- Ifield - Data Visualization: This will allow the operator to set up an operation and view the data acquisition while executing a push.
- HMI - CPT Control: This will allow the Operator to control the CPT.
Infrastructure Organization
To fully enable the remote control of the CPT SW, we have a complete set of software to support the UIs above. This software runs on the OI's on-premise infrastructure.
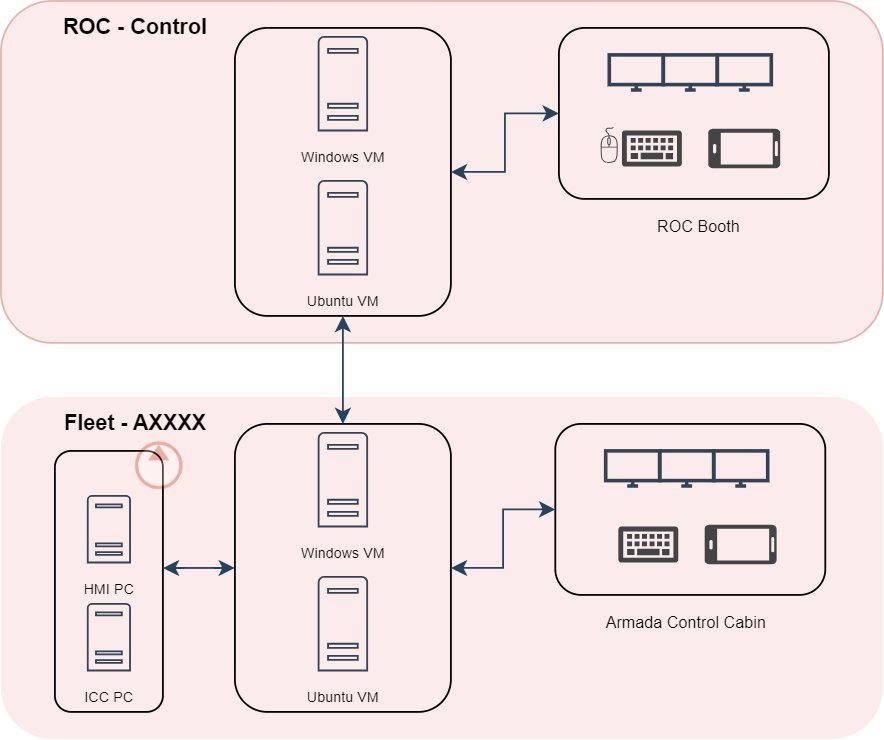
- Fleet AXXXX
- CPT System: These are the Control Boxes that directly control the ROSON-ST. A connection should exist to the control boxes to control the CPT system properly. Read more on Setup Instructions and Network.
- Armada Control Cabin: Computers connected to the vessel's server via RDP.
- Ubuntu/Windows VMs: VMs that run our Software.
- ROC - Control
- Vessel Control Interface: RCC Booth connected to the RCC server via Citrix.
- Ubuntu/Windows VMs: VMs that run our Software on RCC and are connected with the vessel's VMs.
Note
For further information on the Infrastructure, please reach out to the Software Team.
Setup Instructions
1. Red Gateway Access
To access the CPT SW application, like the other applications both in the RCC and Vessel, we need to do it via Jump Servers. You should have access to the Jump Servers via Red Gateway. In order to have access via Red Gateway, please open a Support Ticket with the IT Ops team.
| Access Point | Link |
|---|---|
| Red Gateway | link |
2. Jump Server Access
Once you are within the Red Network, you should have access to the Jump Server. Jump Servers are a middle step you need to make before accessing the machines running the Control Software.

From here, you can access any jump server, which will allow you access the target VM running the Control Software.
3. VM Access
Note
To access the VMs on RCCUK, you should use the A7801 Jump Server at the time of writing.
Once inside the Jump Server, you are able to access the VMs. Please check below how to access each VM:
| Vessel | VM Name | Access Details |
|---|---|---|
| A7803 | RCCUK-R-VM-88 | RDP using the Red Gateway credentials |
| A7803 | A7803-R-VM-11 | RDP using credentials supplied by the IT Ops team |
| ----------- | ----------- | ------------- |
| A7804 | RCCUK-R-VM-94 | RDP using the Red Gateway credentials |
| A7804 | A7804-R-VM-31 | RDP using credentials supplied by the IT Ops team |
| ----------- | ----------- | ------------- |
| A7805 | RCCUK-R-VM-91 | RDP using the Red Gateway credentials |
| A7805 | A7805-R-VM-XX | RDP using credentials supplied by the IT Ops team |
4. Run Applications
To run the applications, please refer to the HMI - Getting Started and Ifield - Getting Started sections.
Ended: Introduction
HMI ↵
HMI Introduction
In this section you will get some brief information about:
-
What is the Roson Control Interface.
-
A general organization of the screens on the monitors.
-
How to work with touchscreens.
Roson Control Interface
Control interface is an application developed for operating a Roson. It consists of three parts:
- Automatic screen is used to operate the Roson in an automatic mode. Navigate to this screen by tapping the Automatic label on the navigation bar.
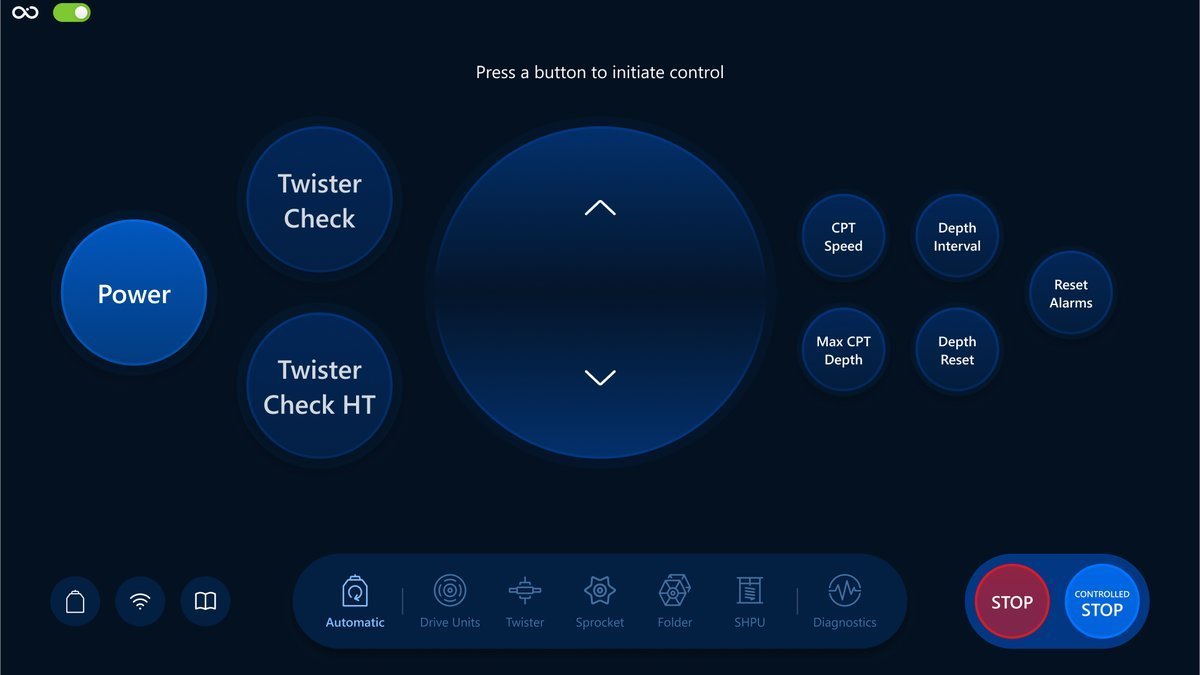
Follow this link to find more information about Automatic mode screen: Automatic screen overview.
- Manual Control screens is used to operate the Roson in a manual mode. The Operator can use different manual control screens by using the navigation bar on the bottom of the screen, which are: Drive Units, Twister, Sprocket, Folder and SHPU.
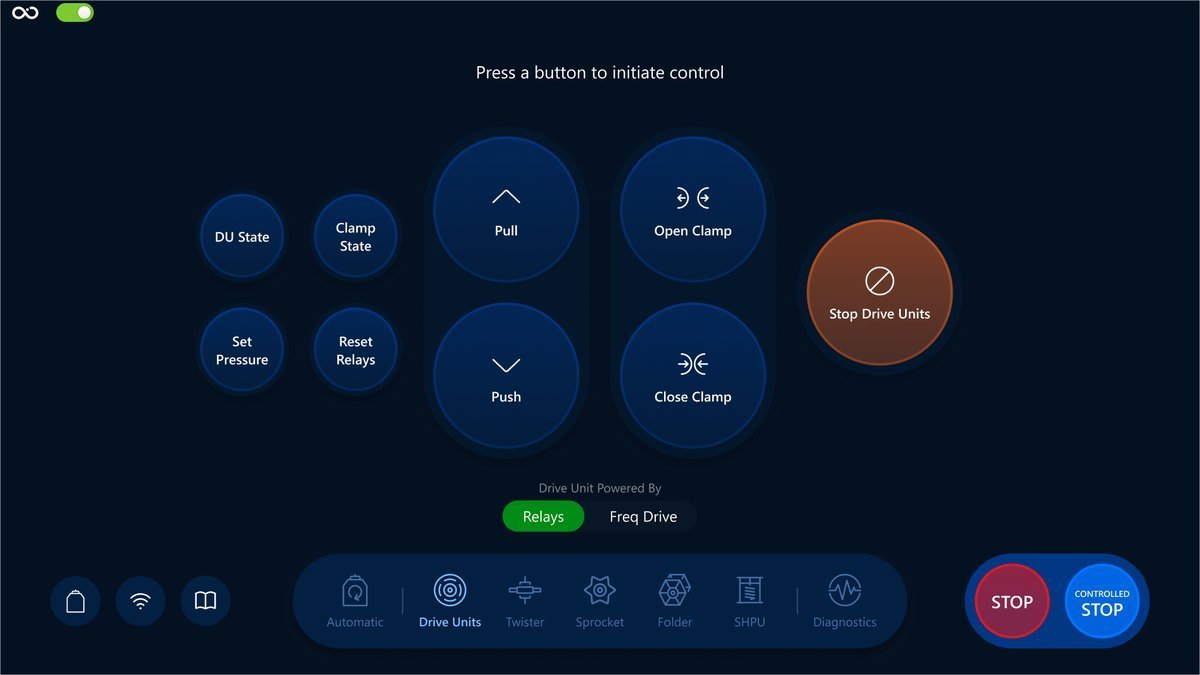
For more information about Manual Controls screens, follow the link: Manual Mode overview.
- Diagnostics screen which is used for managing the settings and additional diagnostics of the Roson. Tap the Diagnostics label on the navigation bar to navigate to this screen.
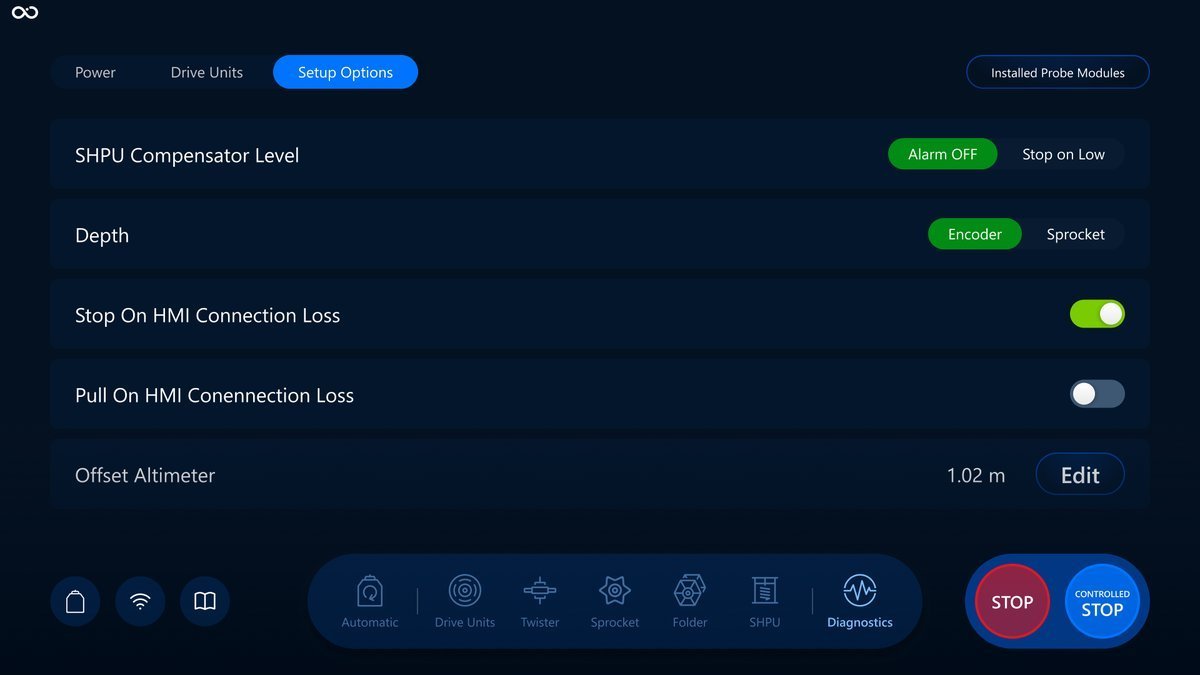
You can read more about this screen here: Diagnostics screen overview.
Organization of the screens on the monitors
There are two monitors available for displaying the necessary screens.
First monitor always displays the Visualization screen, which is responsible for displaying the information:
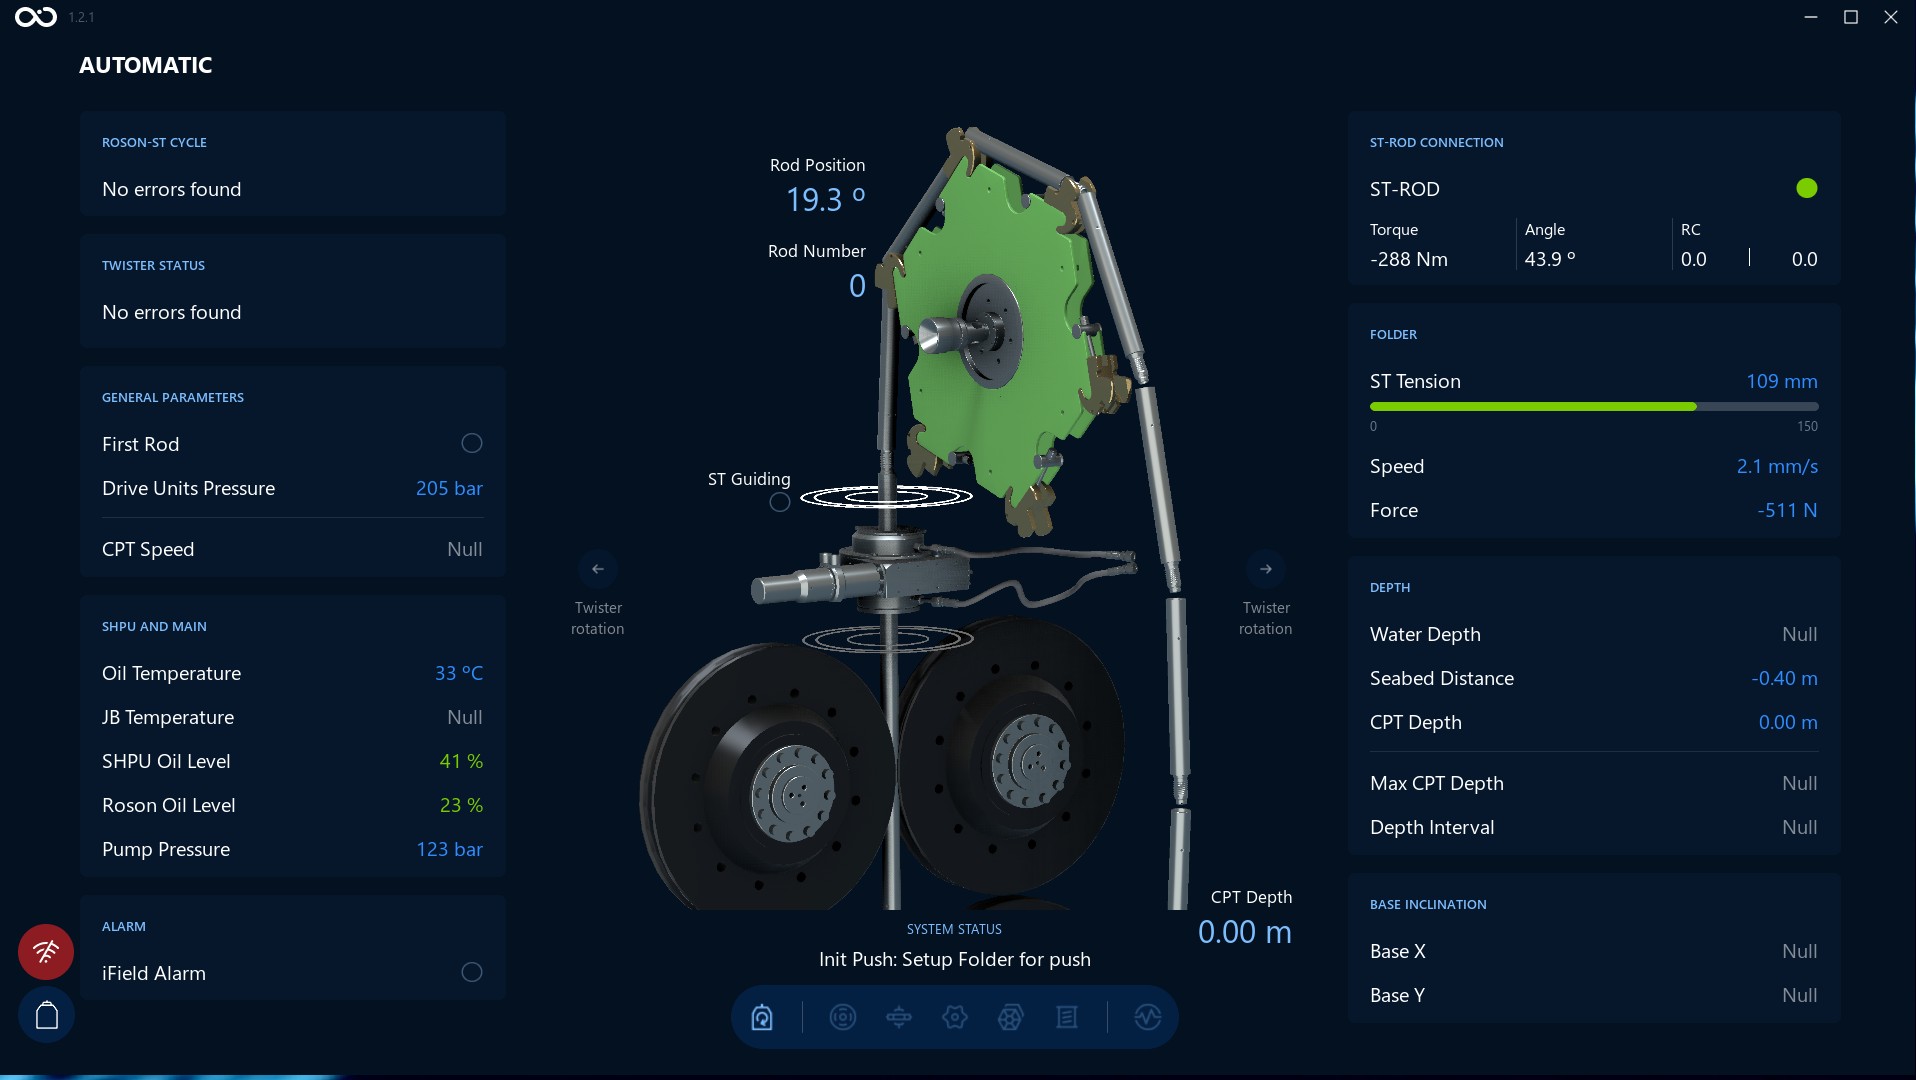
Second monitor (touchscreen) is responsible for displaying the Controls screens, some of them (Automatic and Diagnostics) were shown previously in this section. This is the interface to control the Rosons.
Here is another example - of the Twister Control screen:
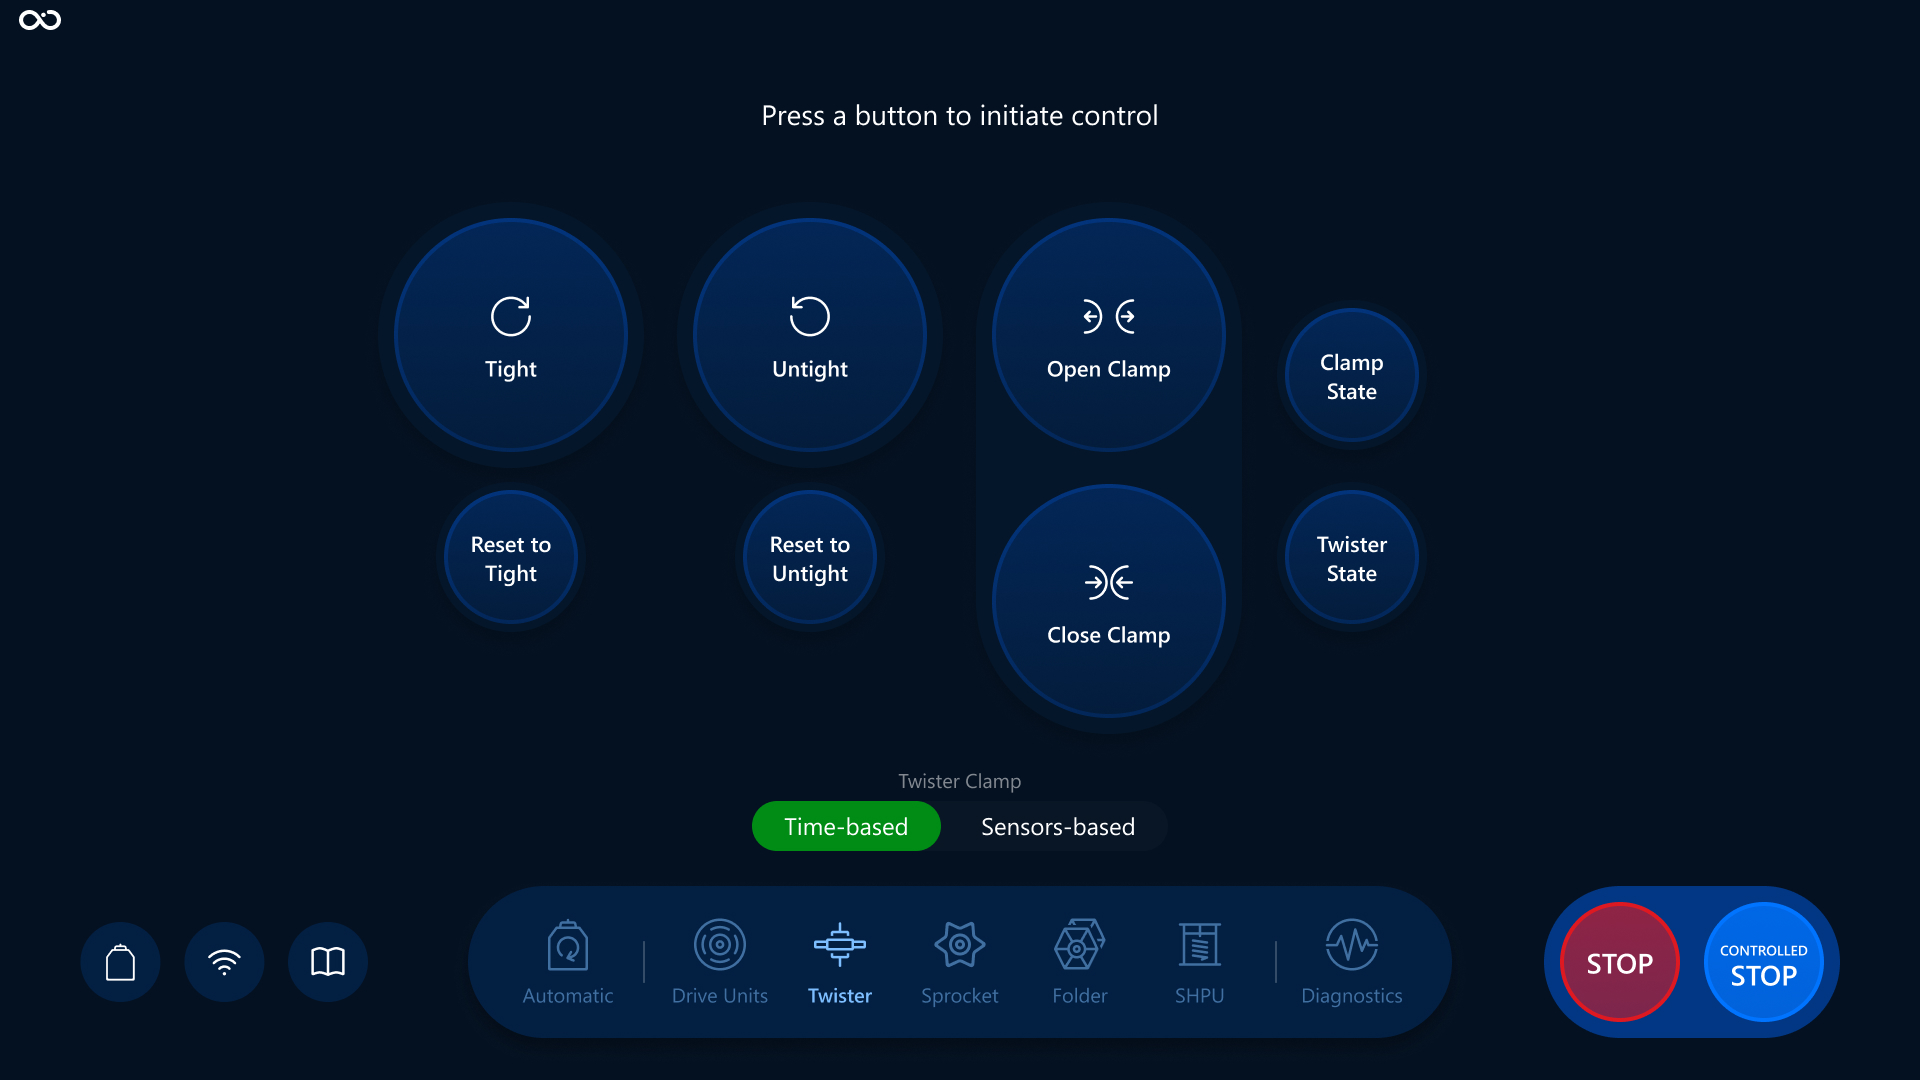
How to use a touchscreen
To tap, lightly place the tip of your index finger onto the screen and raise it again, quickly. The touch only needs to be for a fraction of a second for the screen to respond and you don't need to press down hard. Tapping can be used for typing text and numbers or to select buttons.
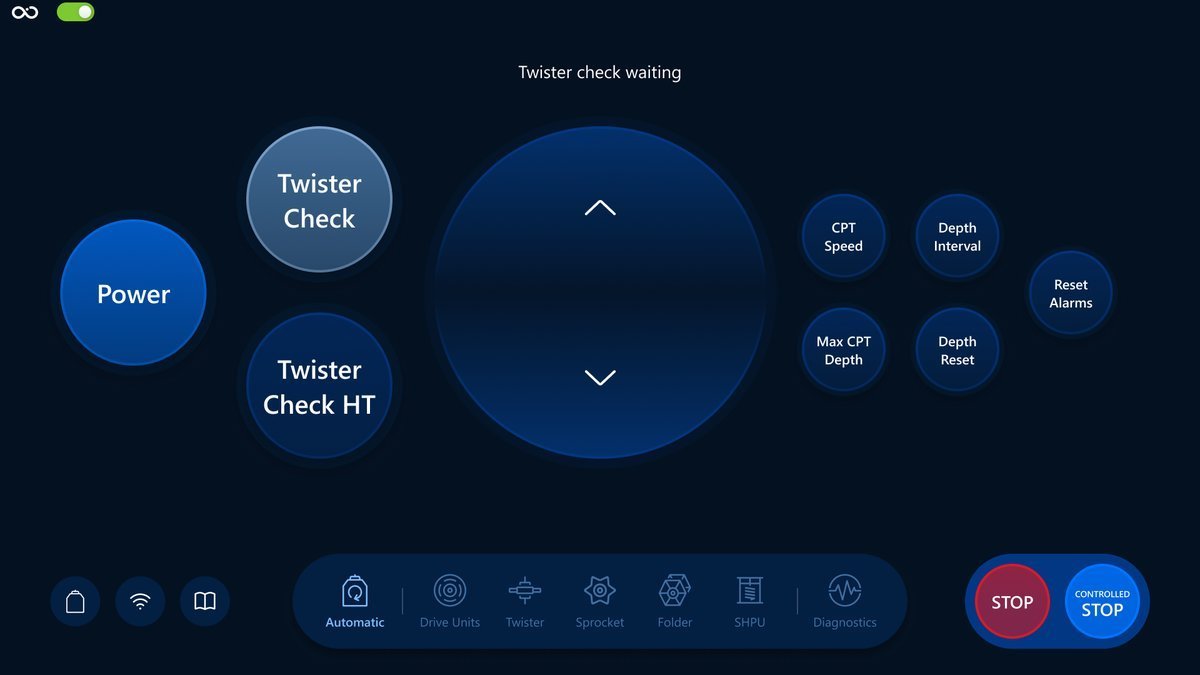
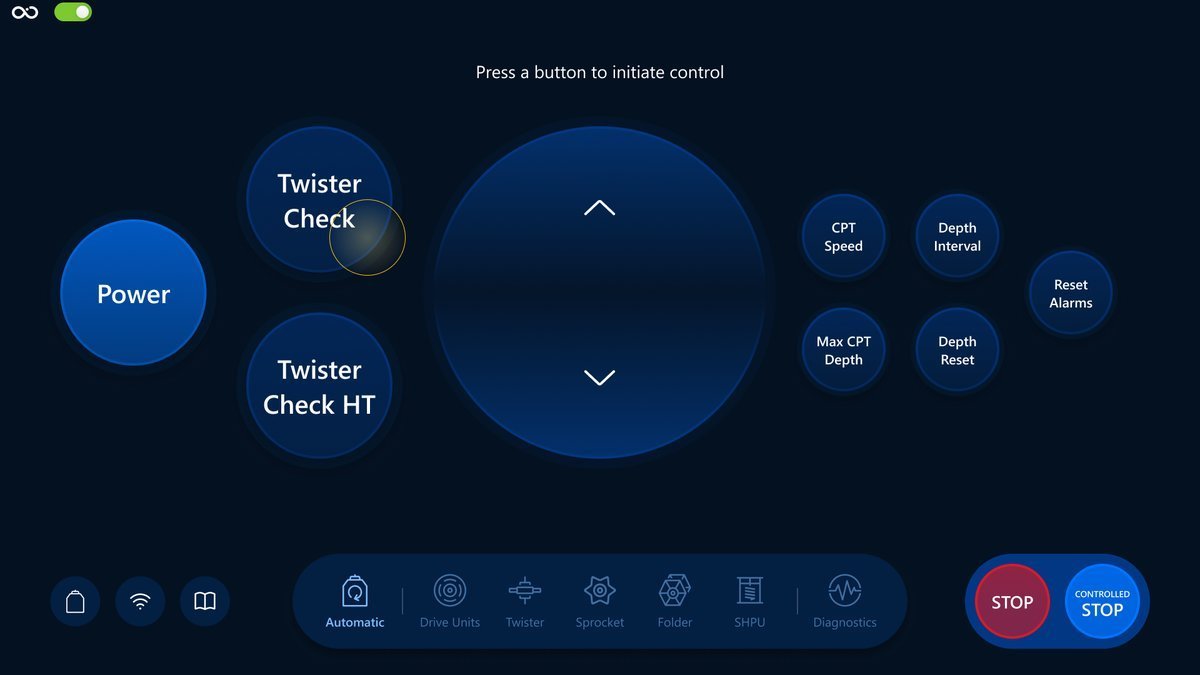
For example, to run the Twister check command, tap on a Twister Check button (tap action illustrated as an orange circle) and after raising a finger the button will change color, which means the operation started:
Tap action:
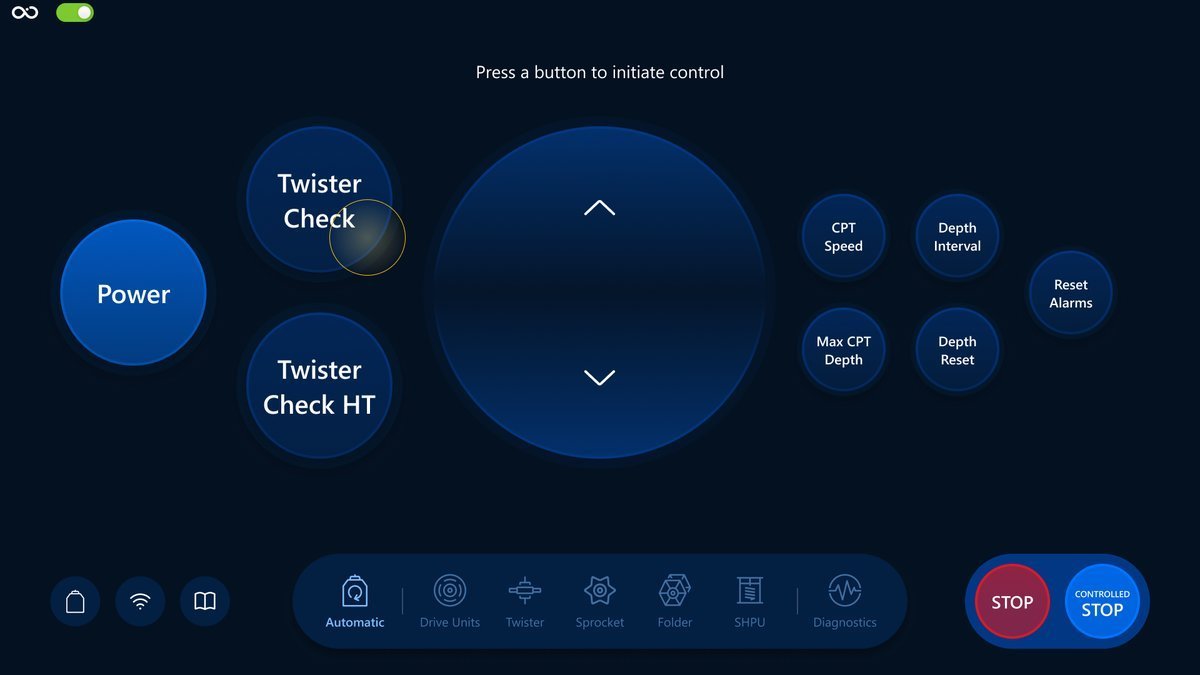
Action started:
Next section
In this section you've learned what is the Roson Control Interface, the general organization of the screens on the monitors and how to use the touchscreen. Feel free to start learning the controls by following this link: Control Interface.
Getting Started
In this section you will learn how to prepare and start operating CPT Control Software.
First steps
Firstly, the operator should launch the CPT Control Software by double-clicking on an executable:
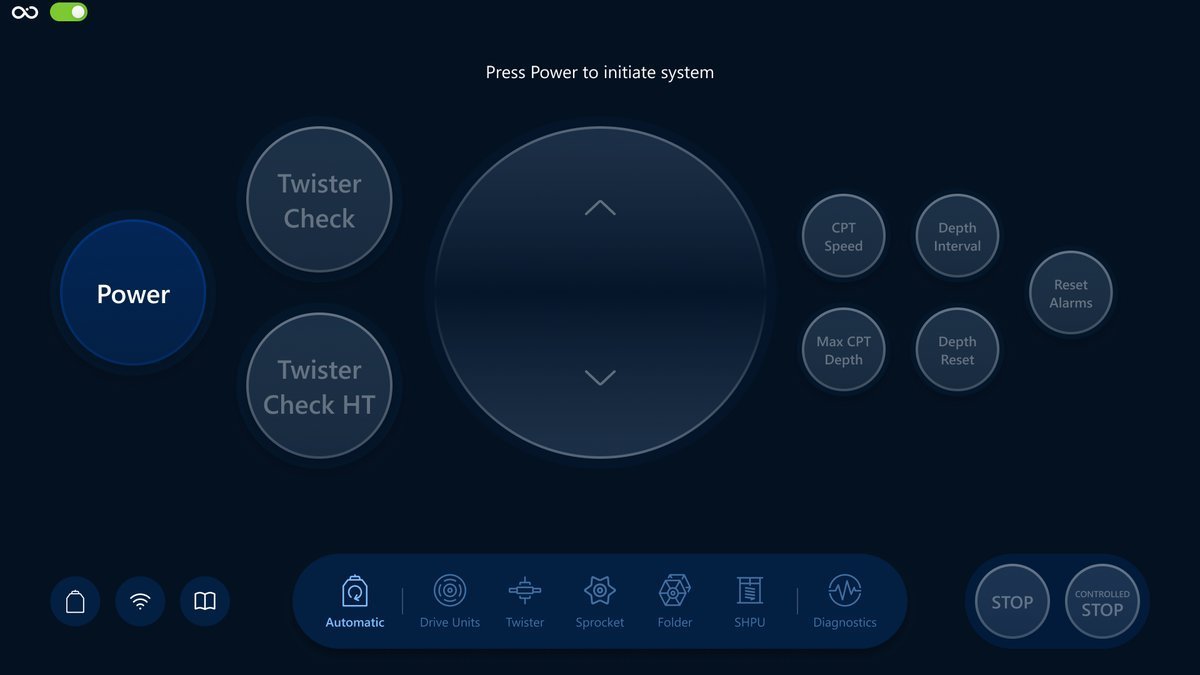
Once the software is ready, you'll see one of the CPT Control screens, for example, the Automatic screen:
Refreshing HMI Application
If the application becomes unresponsive, use CTRL + R to refresh its state.
Closing HMI Application
If you need to close the application, please press alt + f4 or terminate the process in the task manager.
What is status?
In our case, the status is the current condition or state of a system or the button. When you see the color of a button change, it means the status of this button has also changed.
You can track the status change and see the meaning of it by looking at the system status message, which is displayed on the top of each screen, besides Diagnostics.
On a previous picture the status of the Power button is enabled and has a blue color, indicating that this button is ready for interaction.
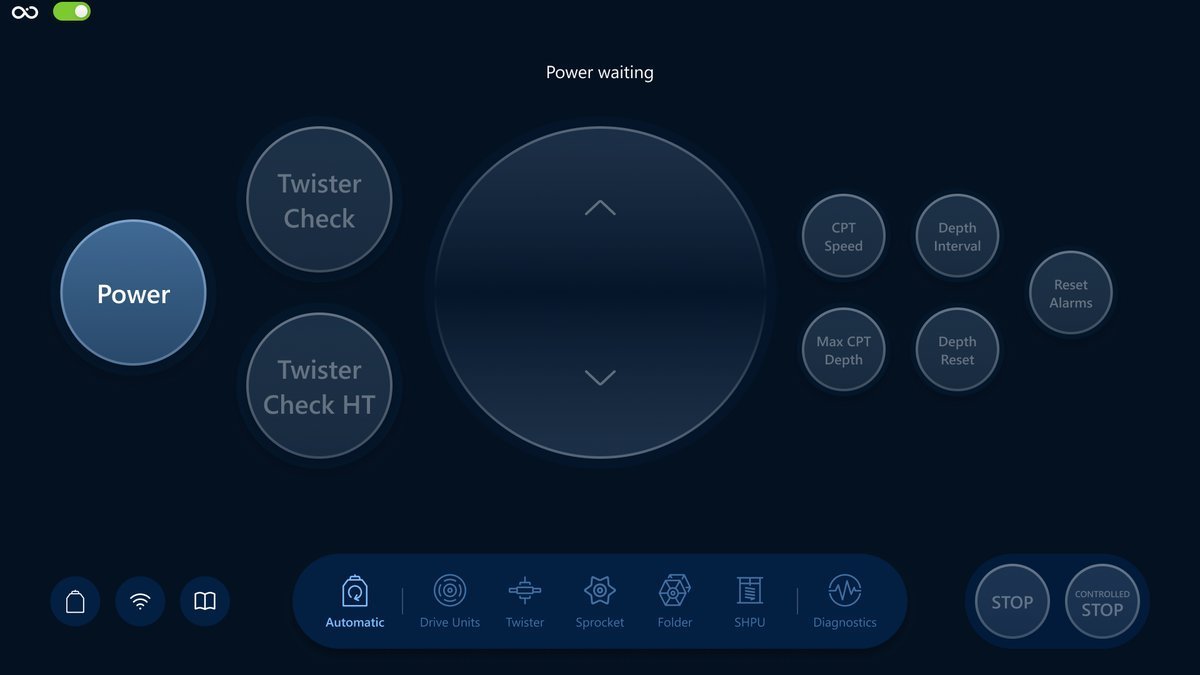
After a tap on the Power button, we should see the state change to the waiting status which has a light blue color and the system status message changed to Power command waiting:
The next step is to wait until the button turns to activated status and gets a bright blue color, indicating that ST Roson operating:
Disabled buttons
There is one important thing to mention. As you can see, there are gray buttons when Roson system is not initiated, meaning that the button is currently inactive and cannot be interacted with. This state is often used when certain conditions must be met before the button becomes active. It visually communicates that the option is currently unavailable. The main thing about the disabled button is that you can't interact with it until it turns to a status that enables interaction, like the Power button when CPT Software is off. There are a couple of actions you can do when CPT is not initiated:
Power button
Tap on the Power button to initiate the system, if there are no network errors keeping it disabled. More about the Automatic mode: Automatic screen overview.
Network connection
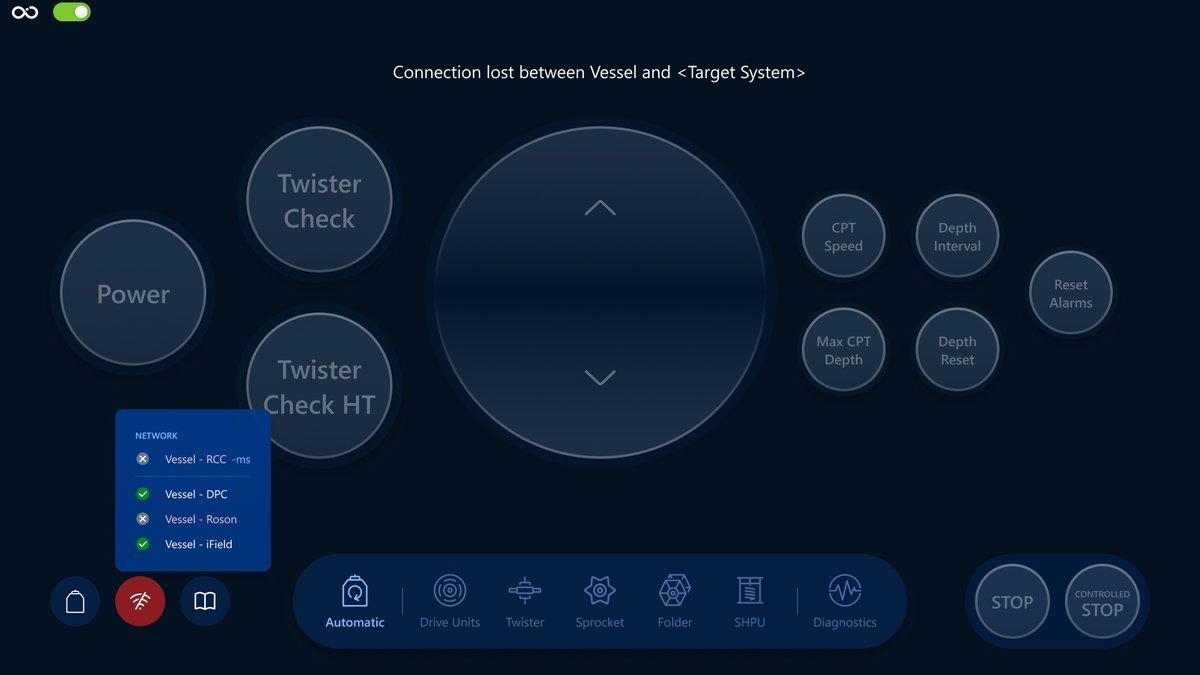
Check the network connection by tapping on a network button. It is important before operating because this tab might have connection errors. For example, in case of a network error between Vessel - Roson or Vessel - RCC, an operator won't be able to press on Power and initiate the CPT Control Software. Make sure you have all the necessary connections before starting the process. More about the network here: Network section.
With established connections you are able to initiate the system:
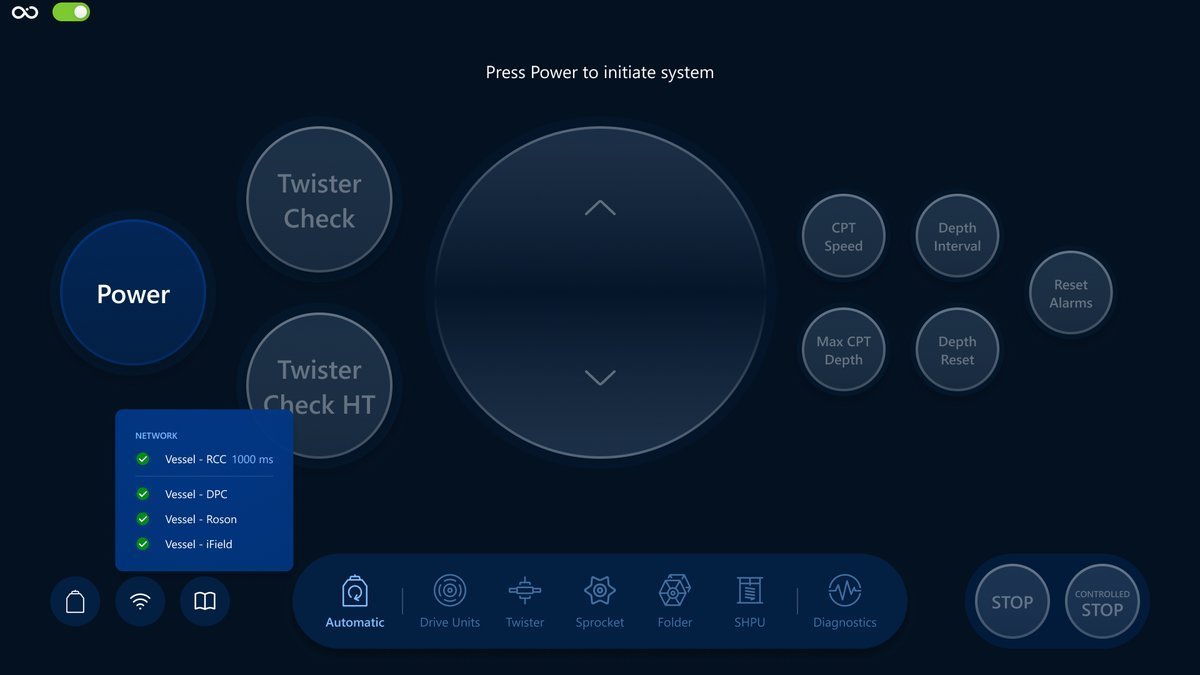
And here is an example with connection fail and as a result an operator can't initiate the system:
DPC panel
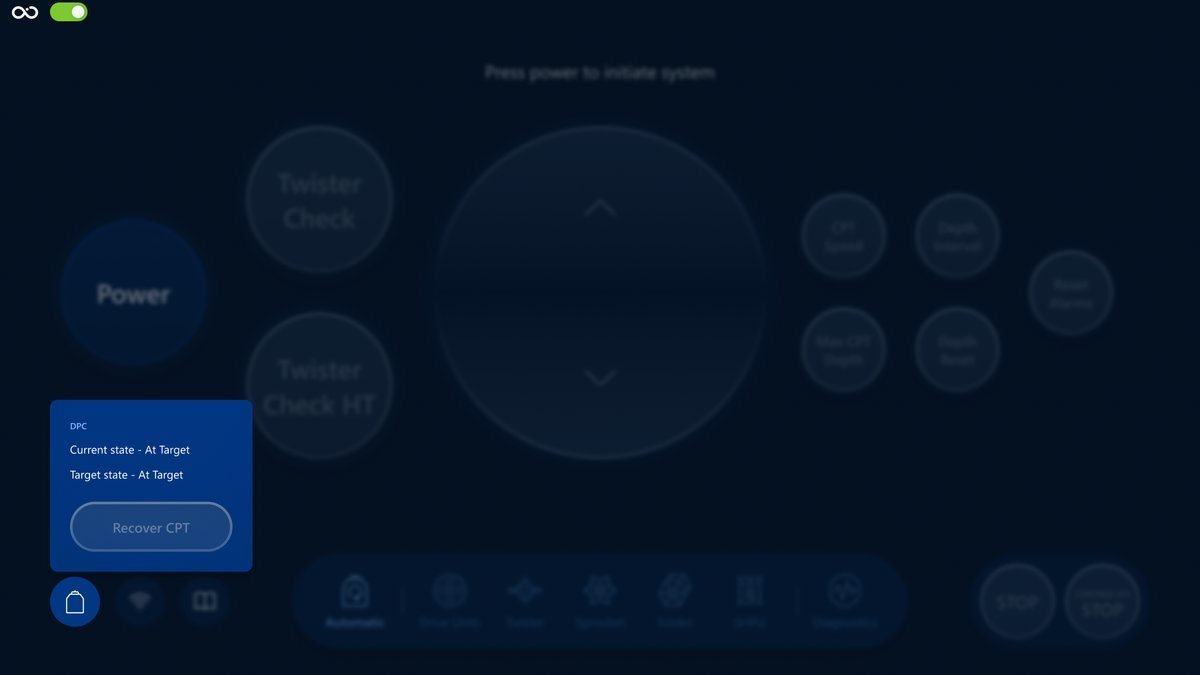
Check the DPC panel by tapping on the DPC panel button. More about the DPC here: DPC Integration.
Navigation
Use the navigation bar to switch between screens. Remember that every button on the other screens is disabled, so you can't click on them until the CPT Control Software is initiated.
Modals
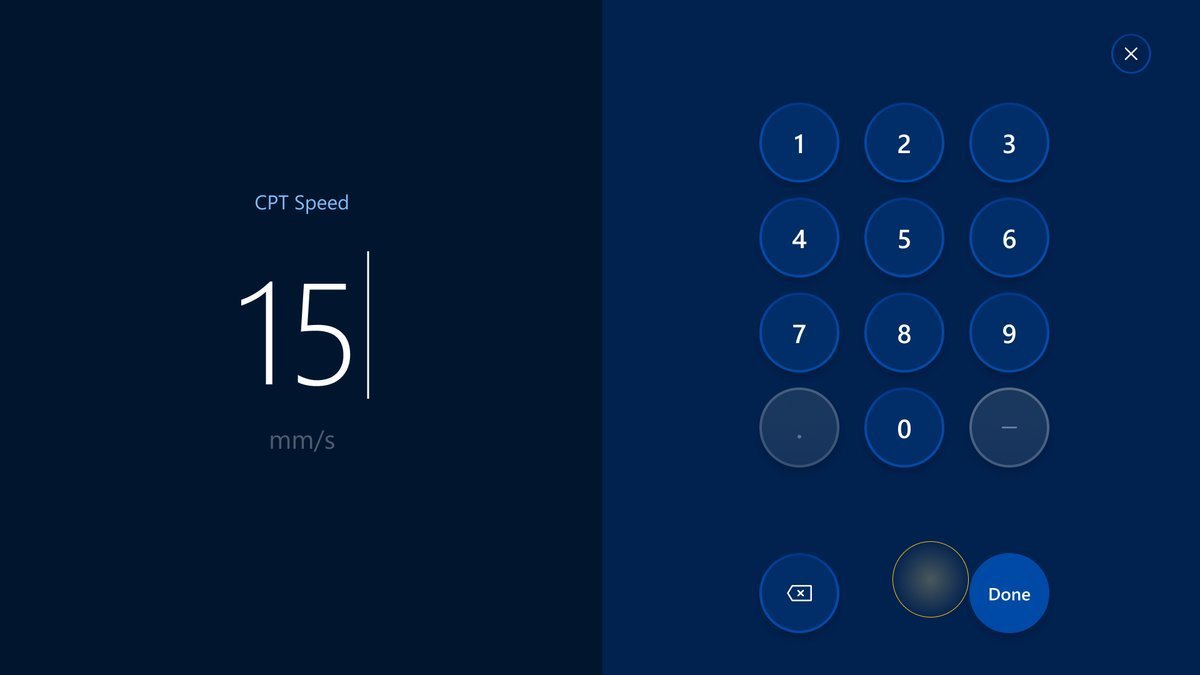
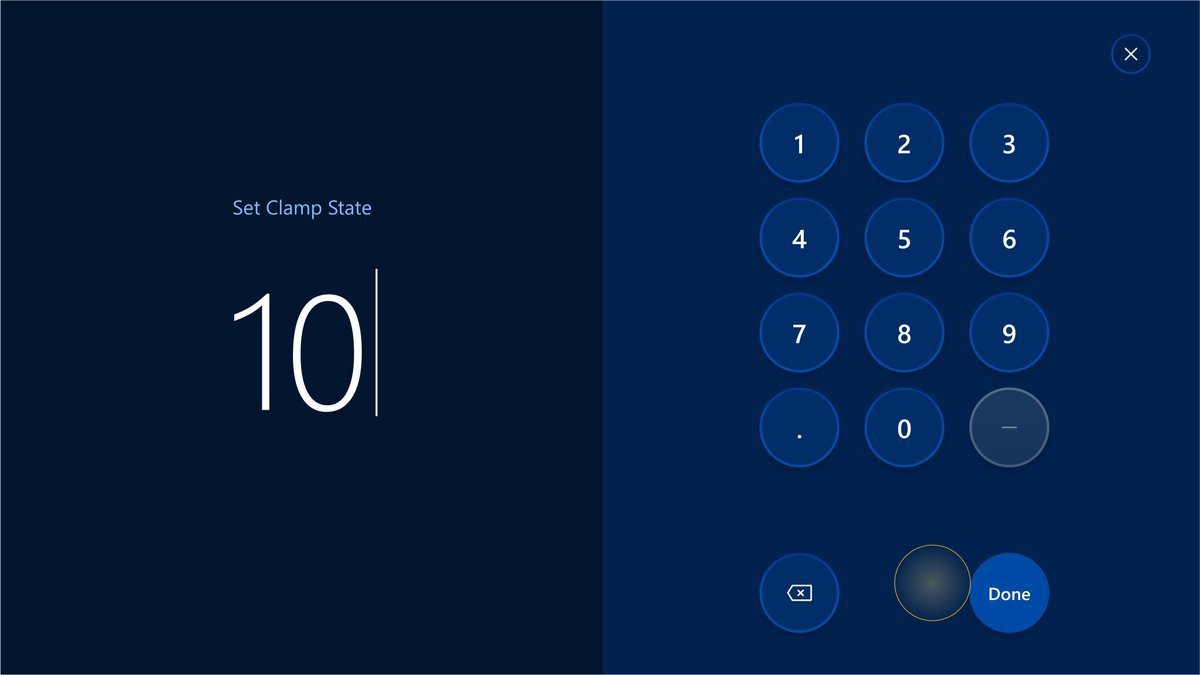
You can open a modal by tapping on some buttons, like CPT Speed. The modal has an input field on the left side and a virtual keyboard on the right.
You can close the modal without saving changes by tapping on the cross button in the top right corner. Also, if you need to remove a character, tap on the backspace button.
Input the value you need and tap on the Done button to apply it. The modal will then be closed automatically.
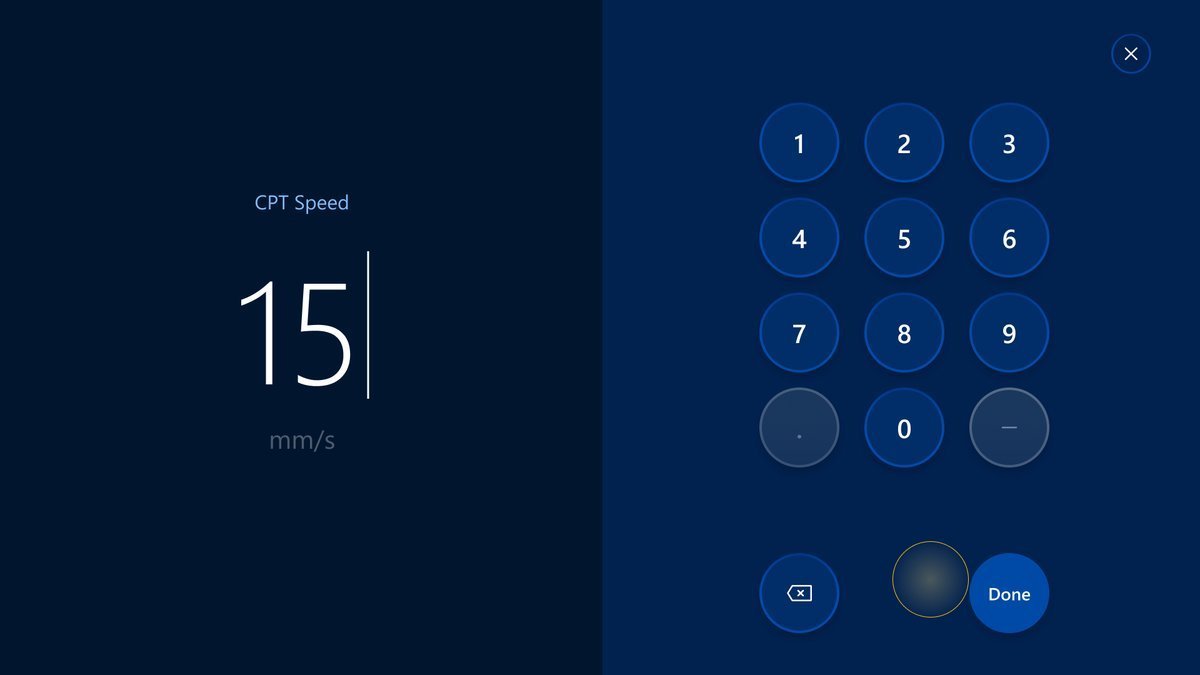
After that, you can track the state of the command by looking at the corresponding button (in this case, CPT Speed) and system status message. If an error occurs, the CPT Speed button will turn into yellow color and then go back to enabled state with the blue color. It means that the value was not saved, and you need to try again.
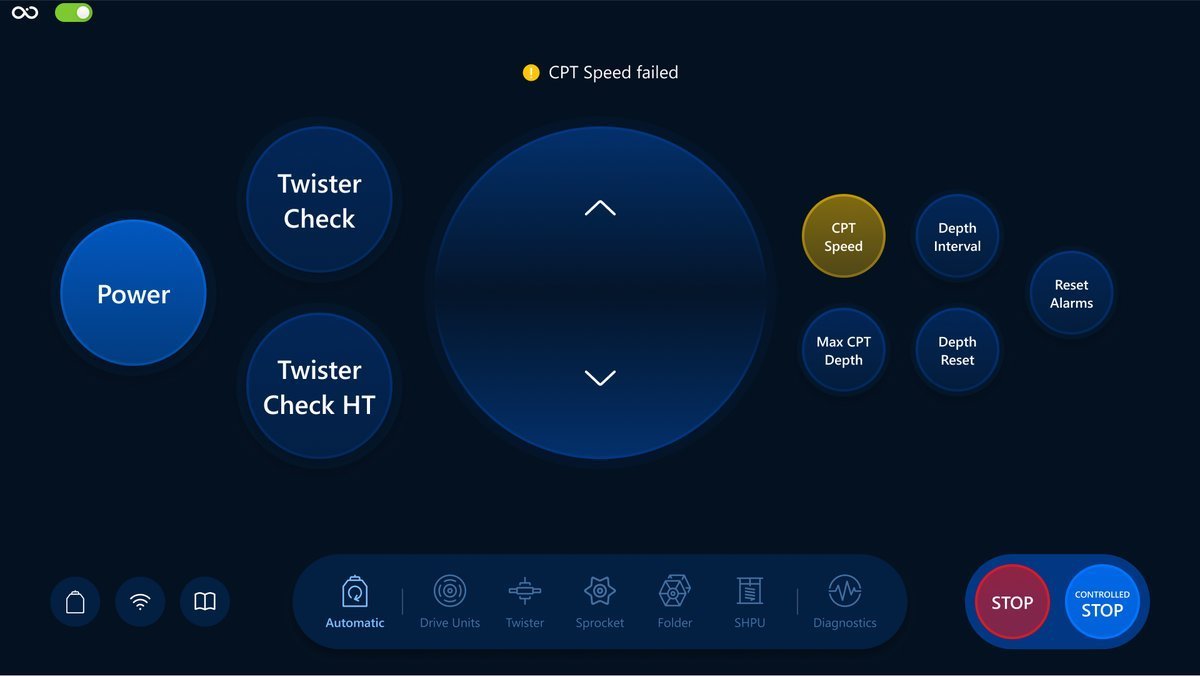
Congratulations! Now you understand how to prepare before using the CPT Control Software. Feel free to have a deeper dive into Automatic mode section by following this link: Automatic screen overview.
Automatic Control Screen
In this section we will have a closer look at how you can use the Automatic screen to control the system during the CPT operation in Automatic mode.
What is the Automatic mode?
The automatic mode is used to operate every Roson function throughout a CPT on an abstraction level. You can treat this mode as driving a car on an automatic transmission. Unlike Manual Control mode, you can operate with automatic commands without the need to control every small part of the process.
Navigation
Tap on Automatic in the navigation bar for navigation. Here is an example:
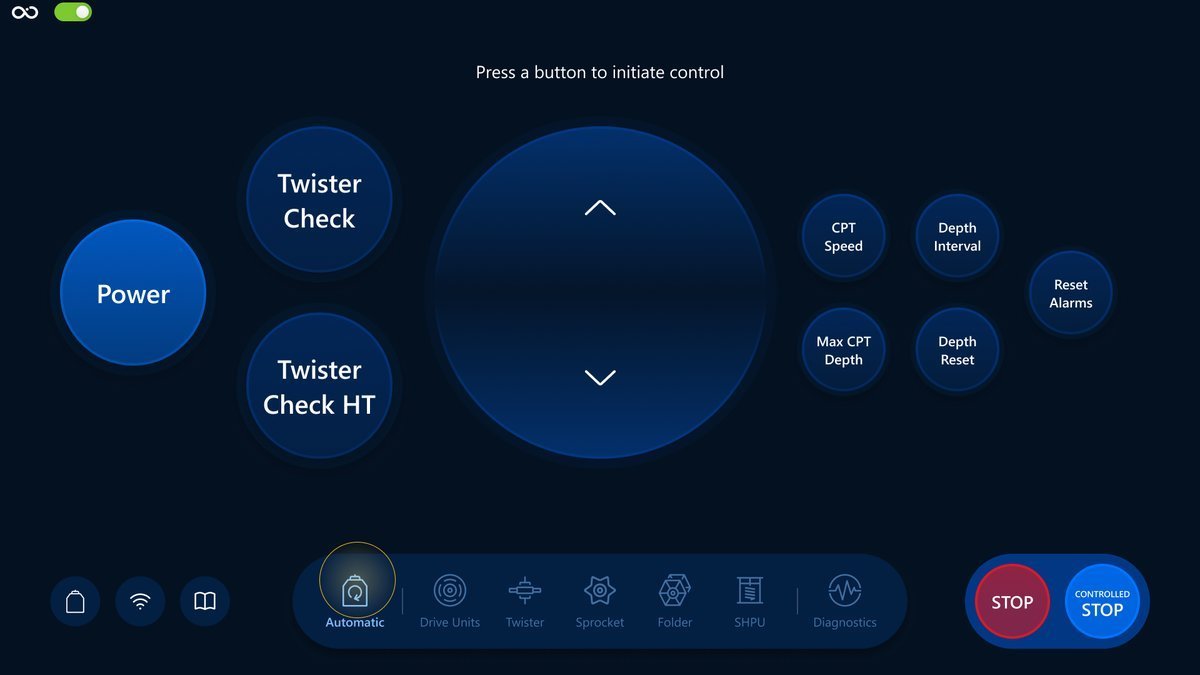
Controls
We will have a look at a brief description of the controls, their responsibilities and also how it reflects the Visualization screen.
Button state toggle
The state of the controls in the automatic screen can be changed with the toggle on the top left corner of the screen. Green means that the controls are enabled while grey means they are disabled.
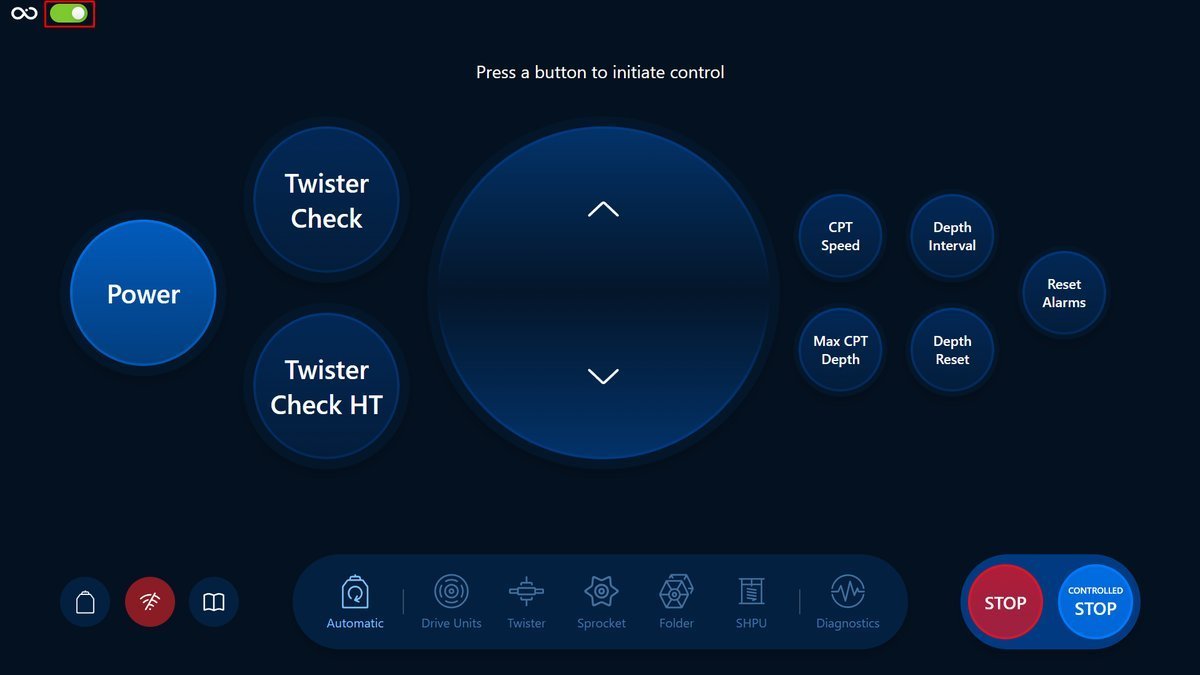
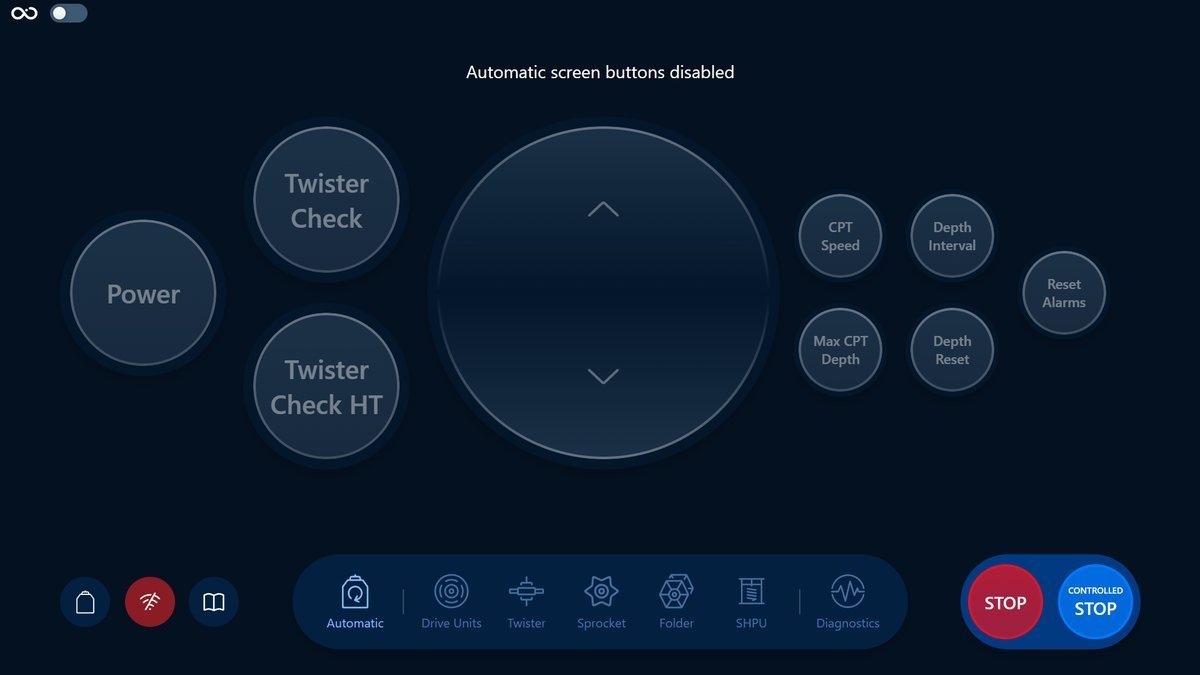
Stop and Controlled Stop
Stop: all movements will stop, the SHPU will restart automatically.
Controlled Stop: The drive unit will stop and the Folder + Sprocket pull the ST string on tension.
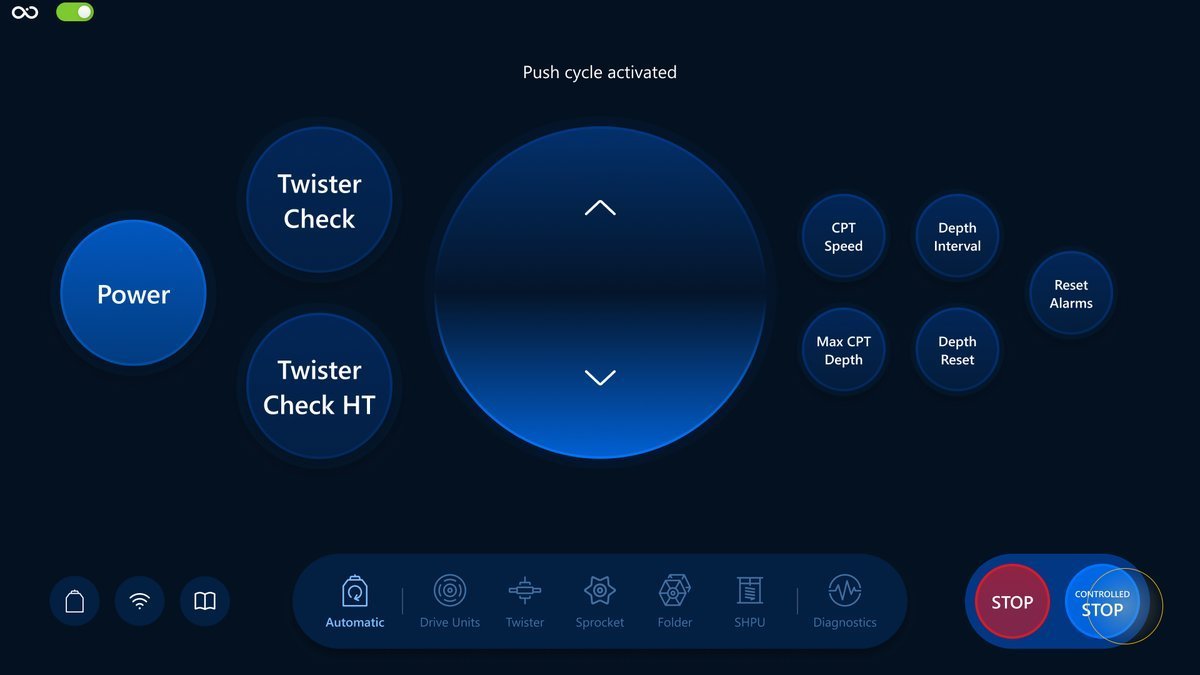
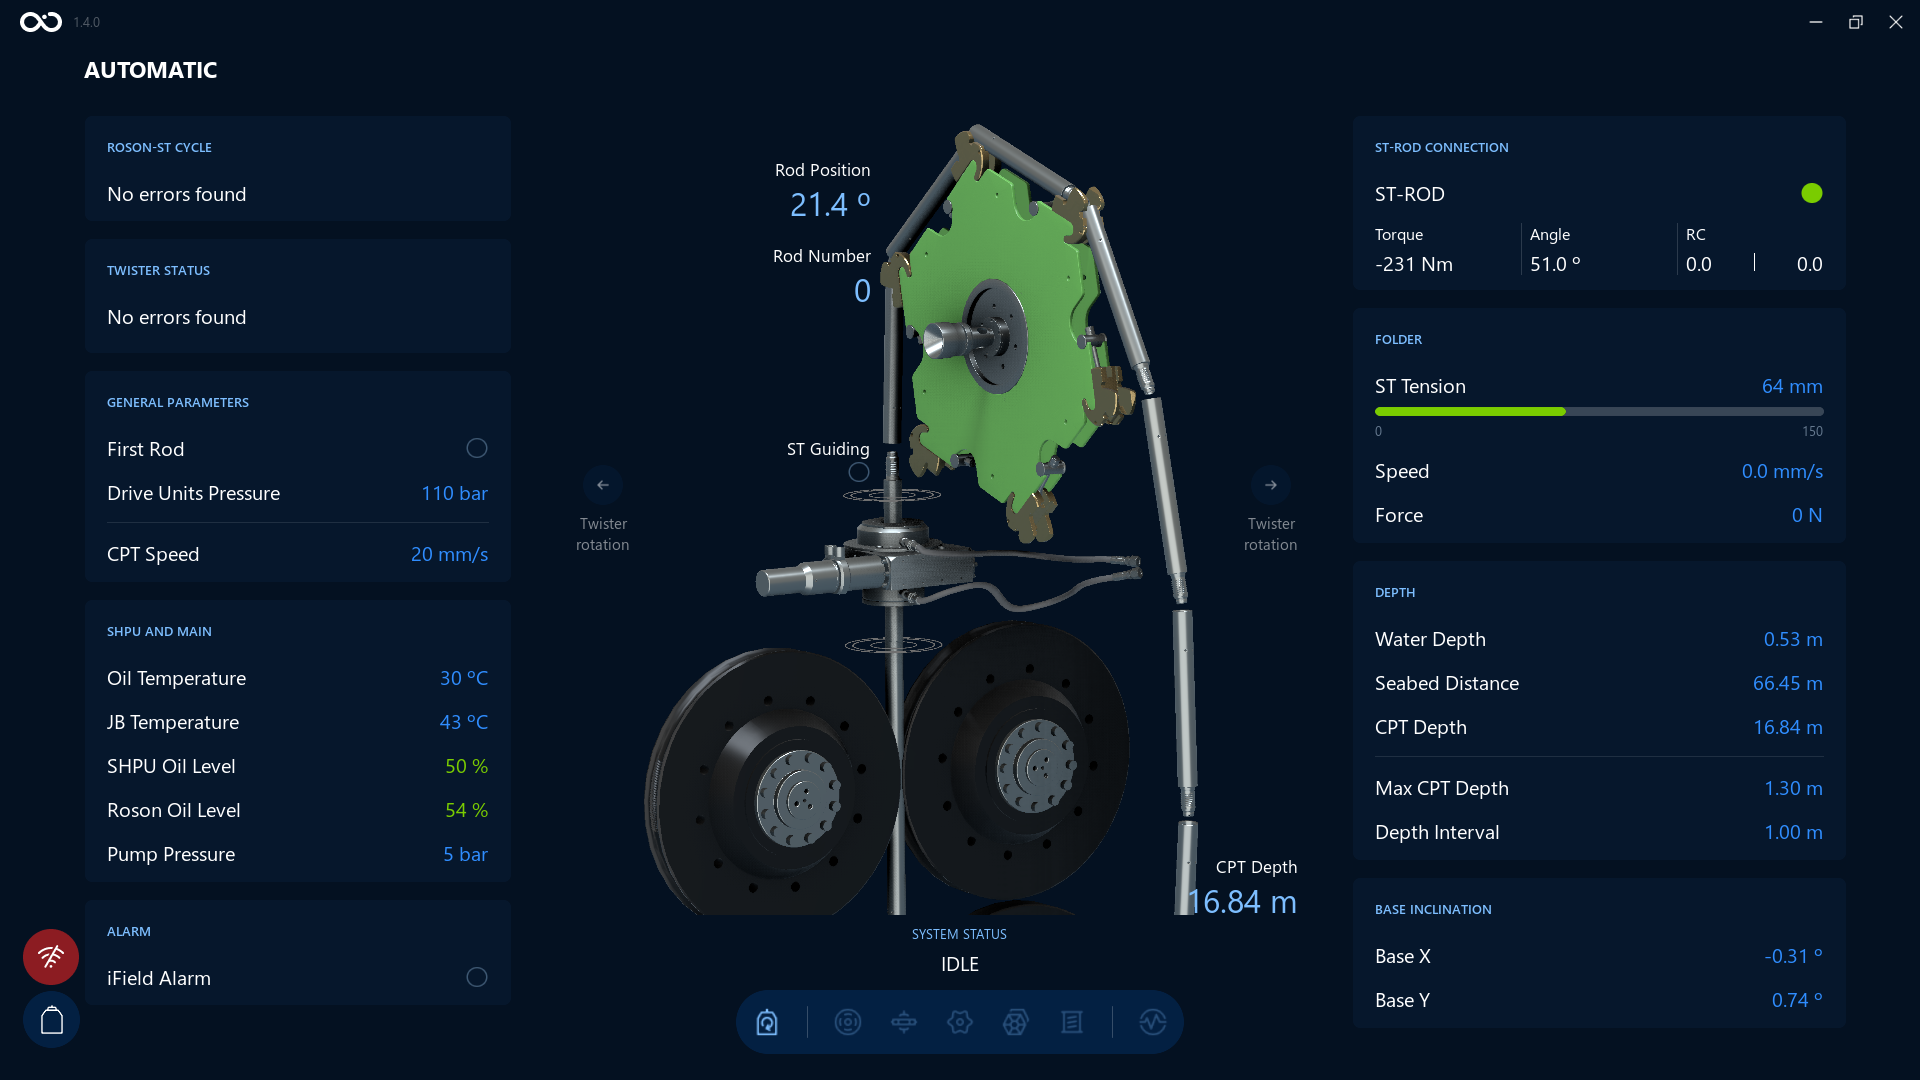
Here is an example of the Visualization screen after stopping the push cycle with the Controlled Stop button:
Power
Is responsible for powering on and off the ROSON-ST actuators, sensors and CPT. After Roson system is powered on you can power it off by tapping this button again.
Here is an example of Controls and Visualization screen when the system is powered off:
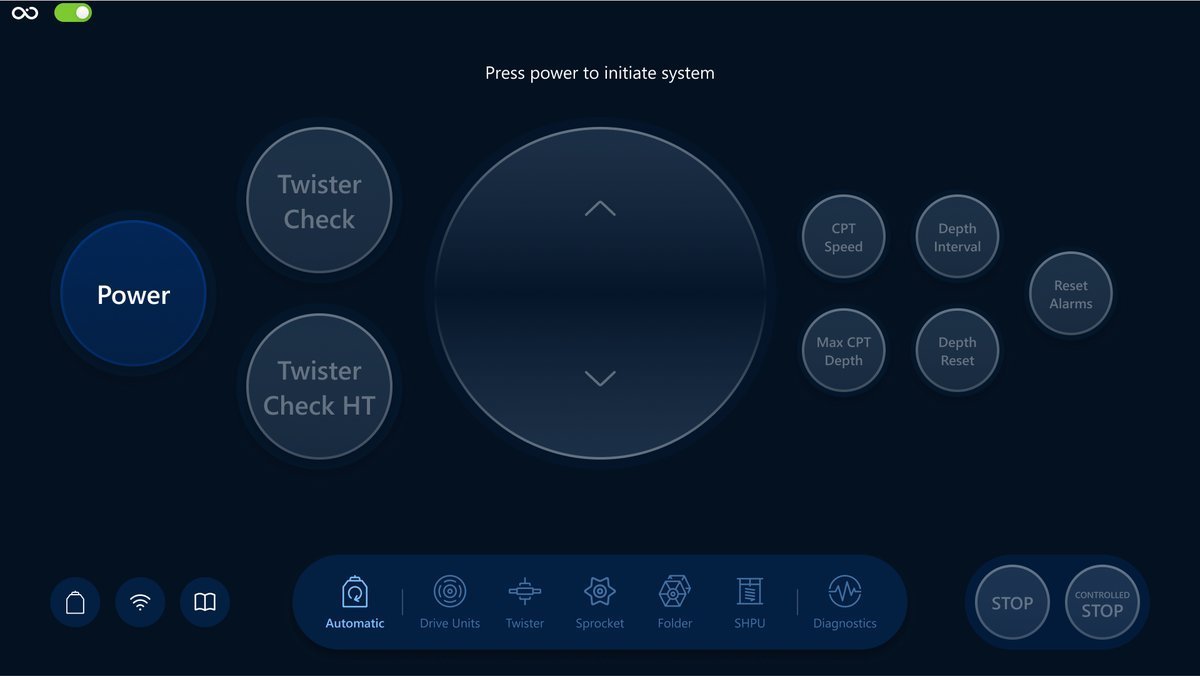
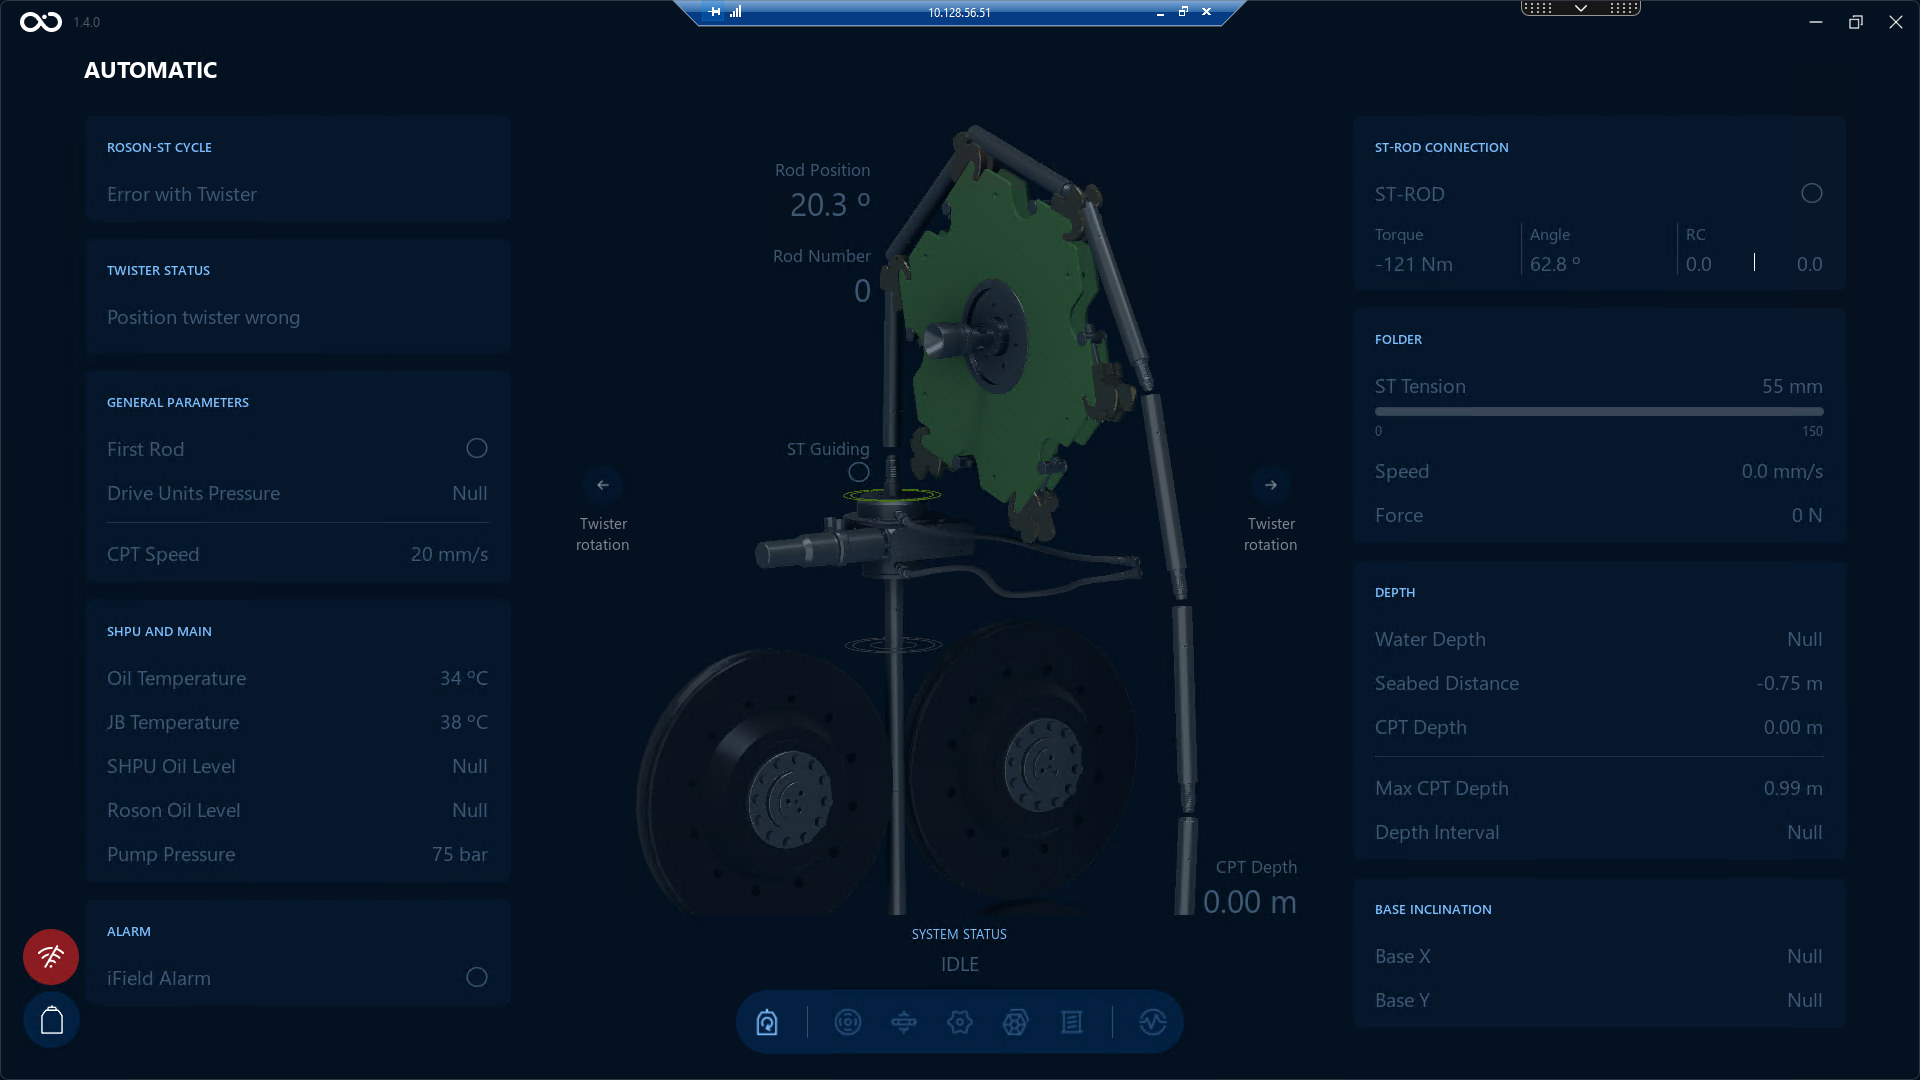
And this is an example when the system is powered on:
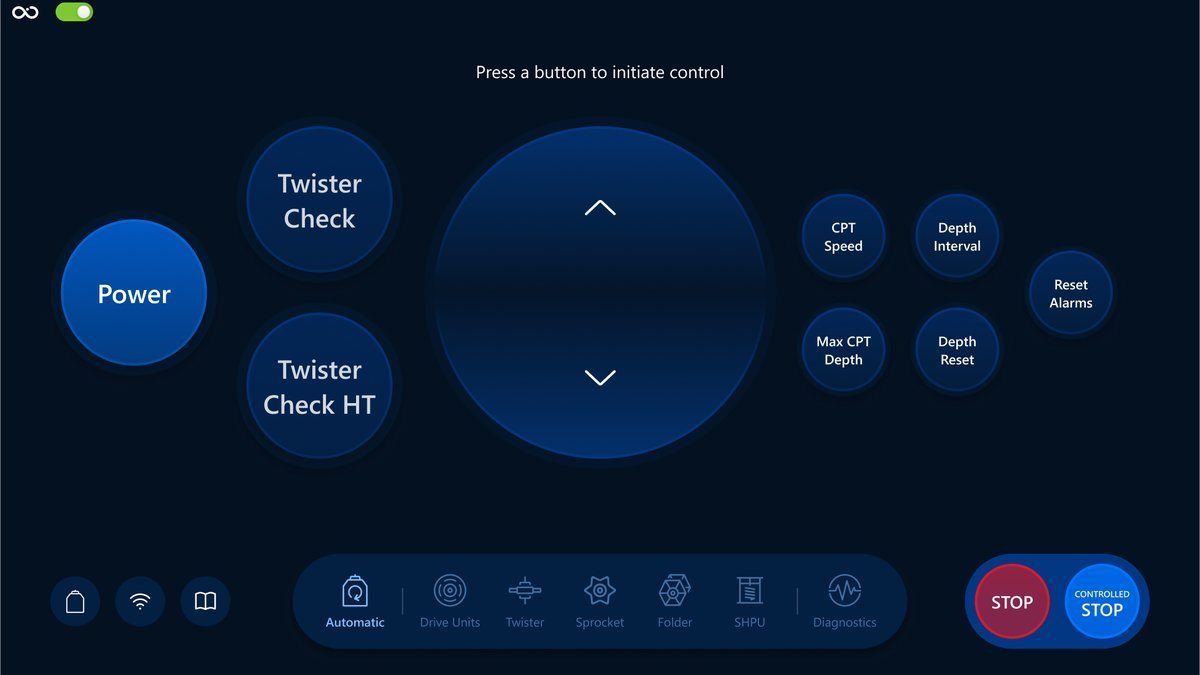
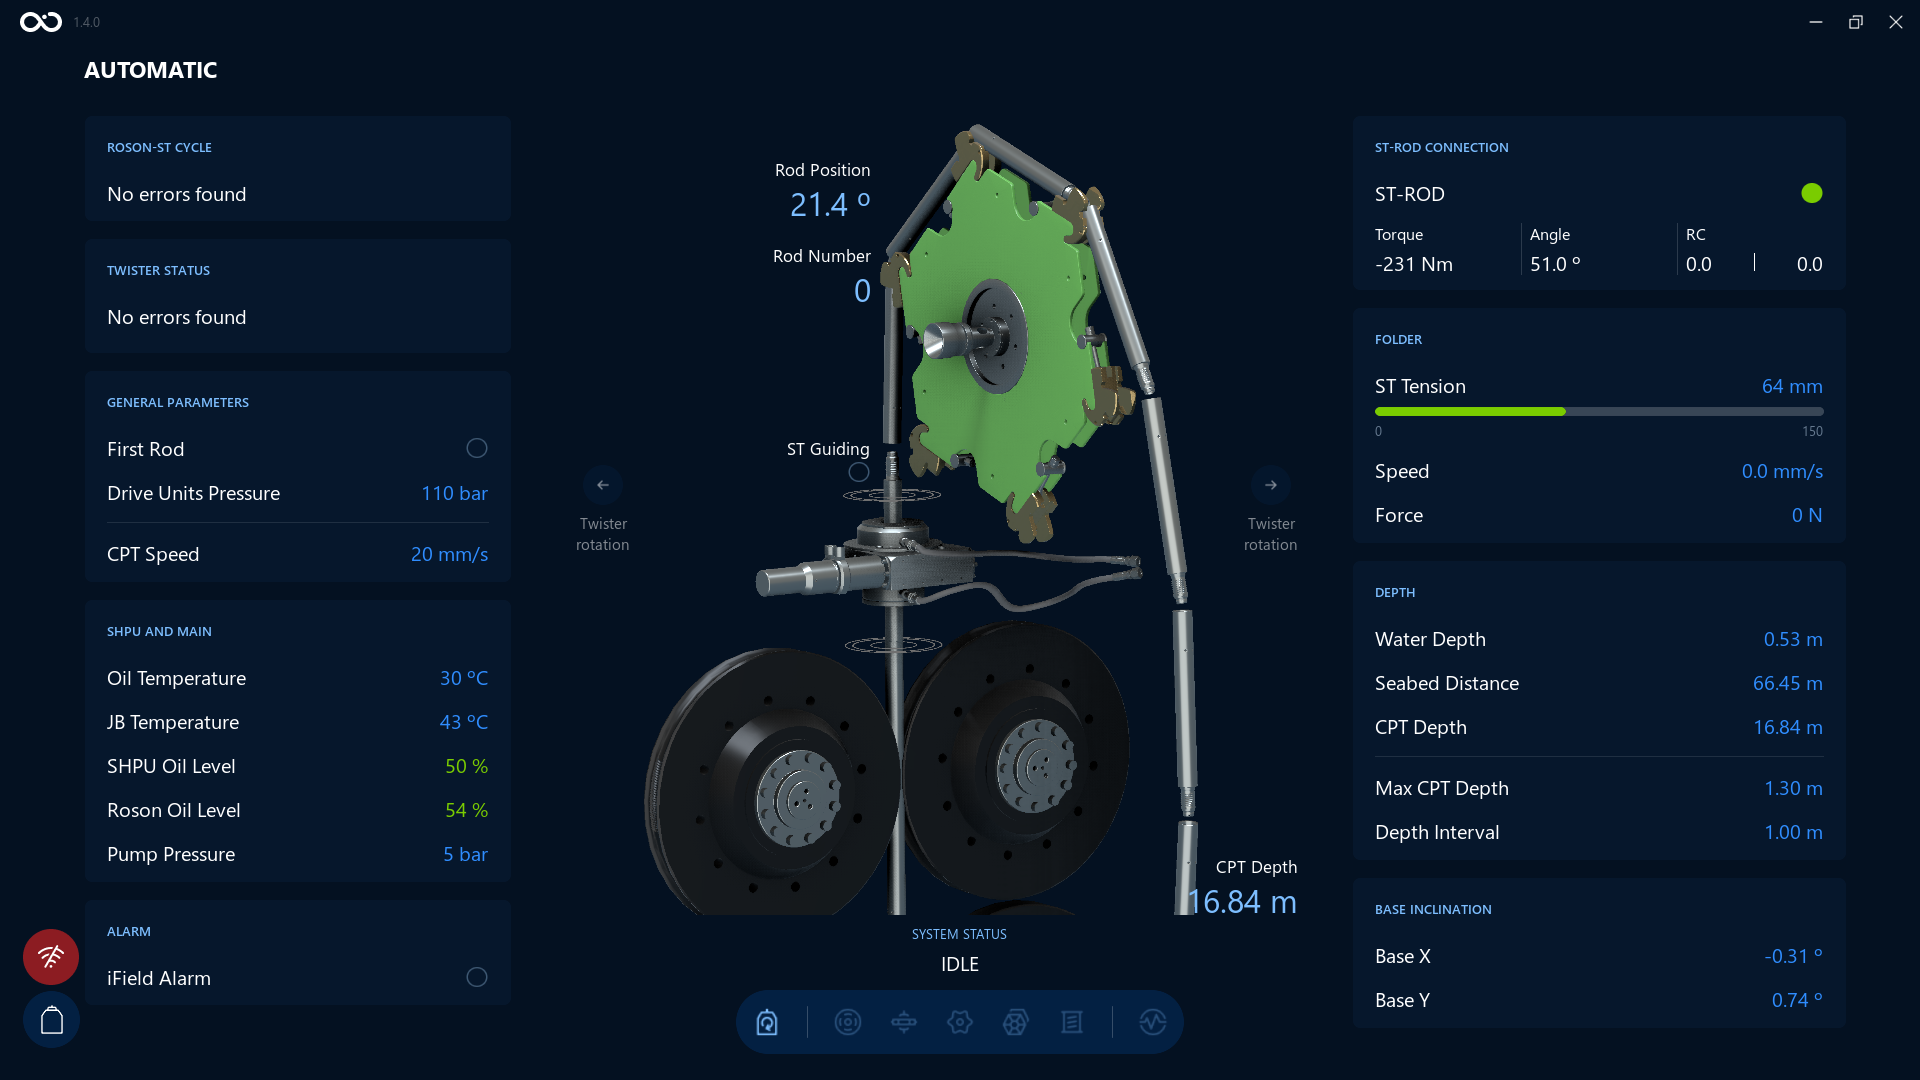
Twister Check
Checks rotation, clamping and end switches.
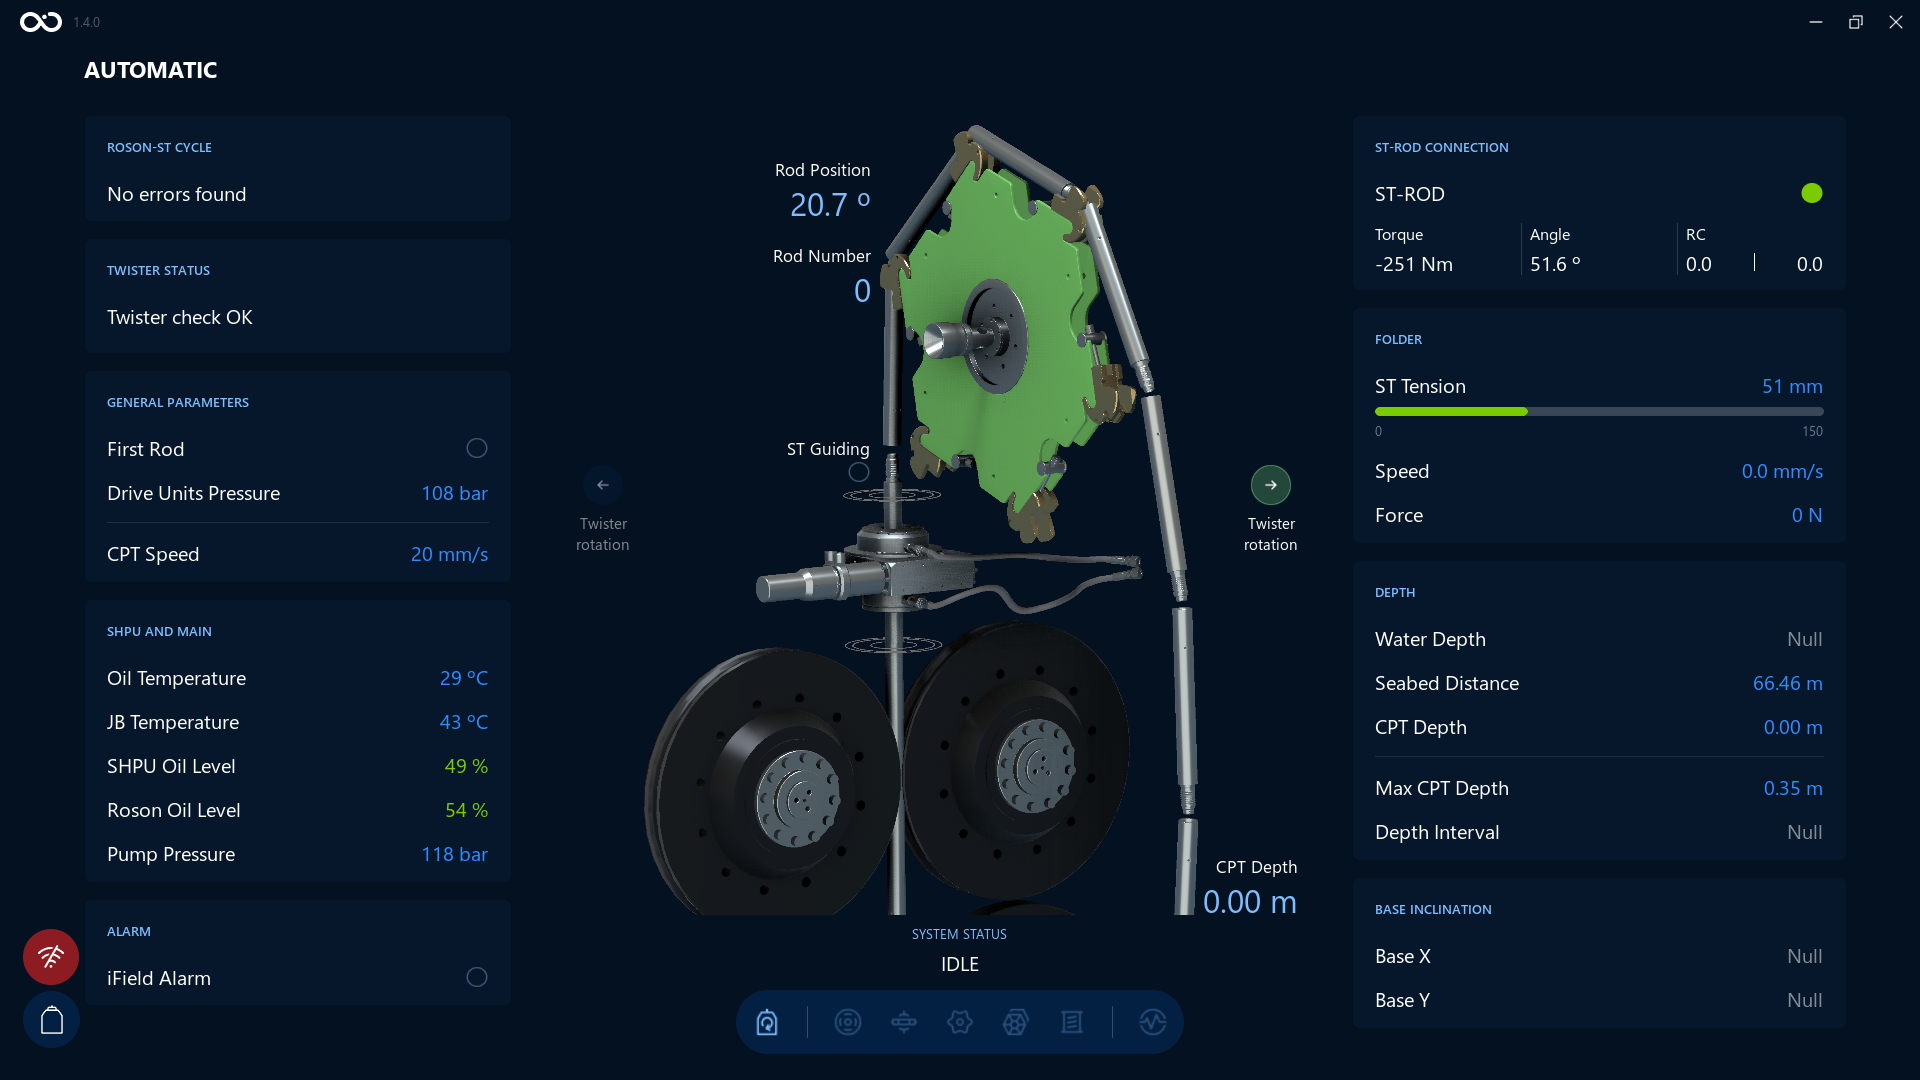
Example of the Visualization screen when the Twister Check command is finished with success. You can see the Twister Status on the top left side is changed to Twister Check OK.
Twister Check HT
The same behavior as Twister Check but with a higher torque.
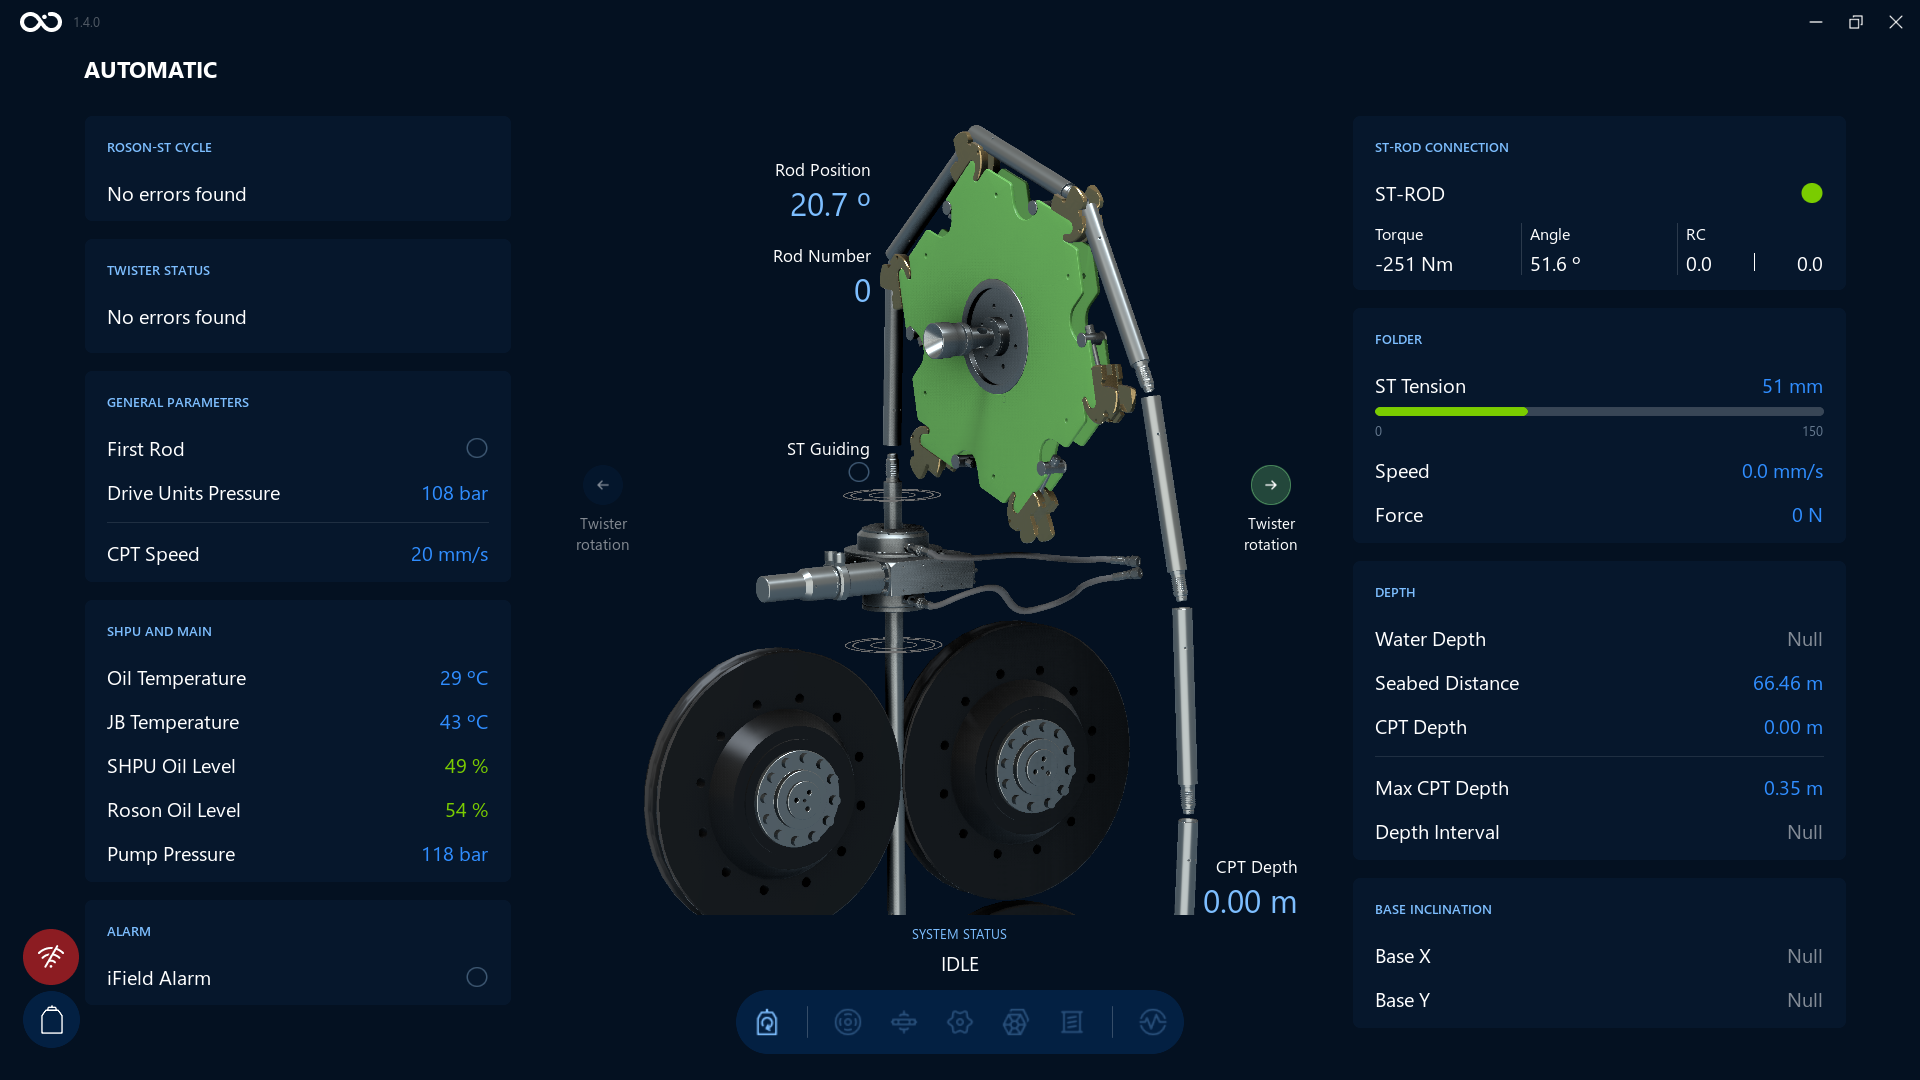
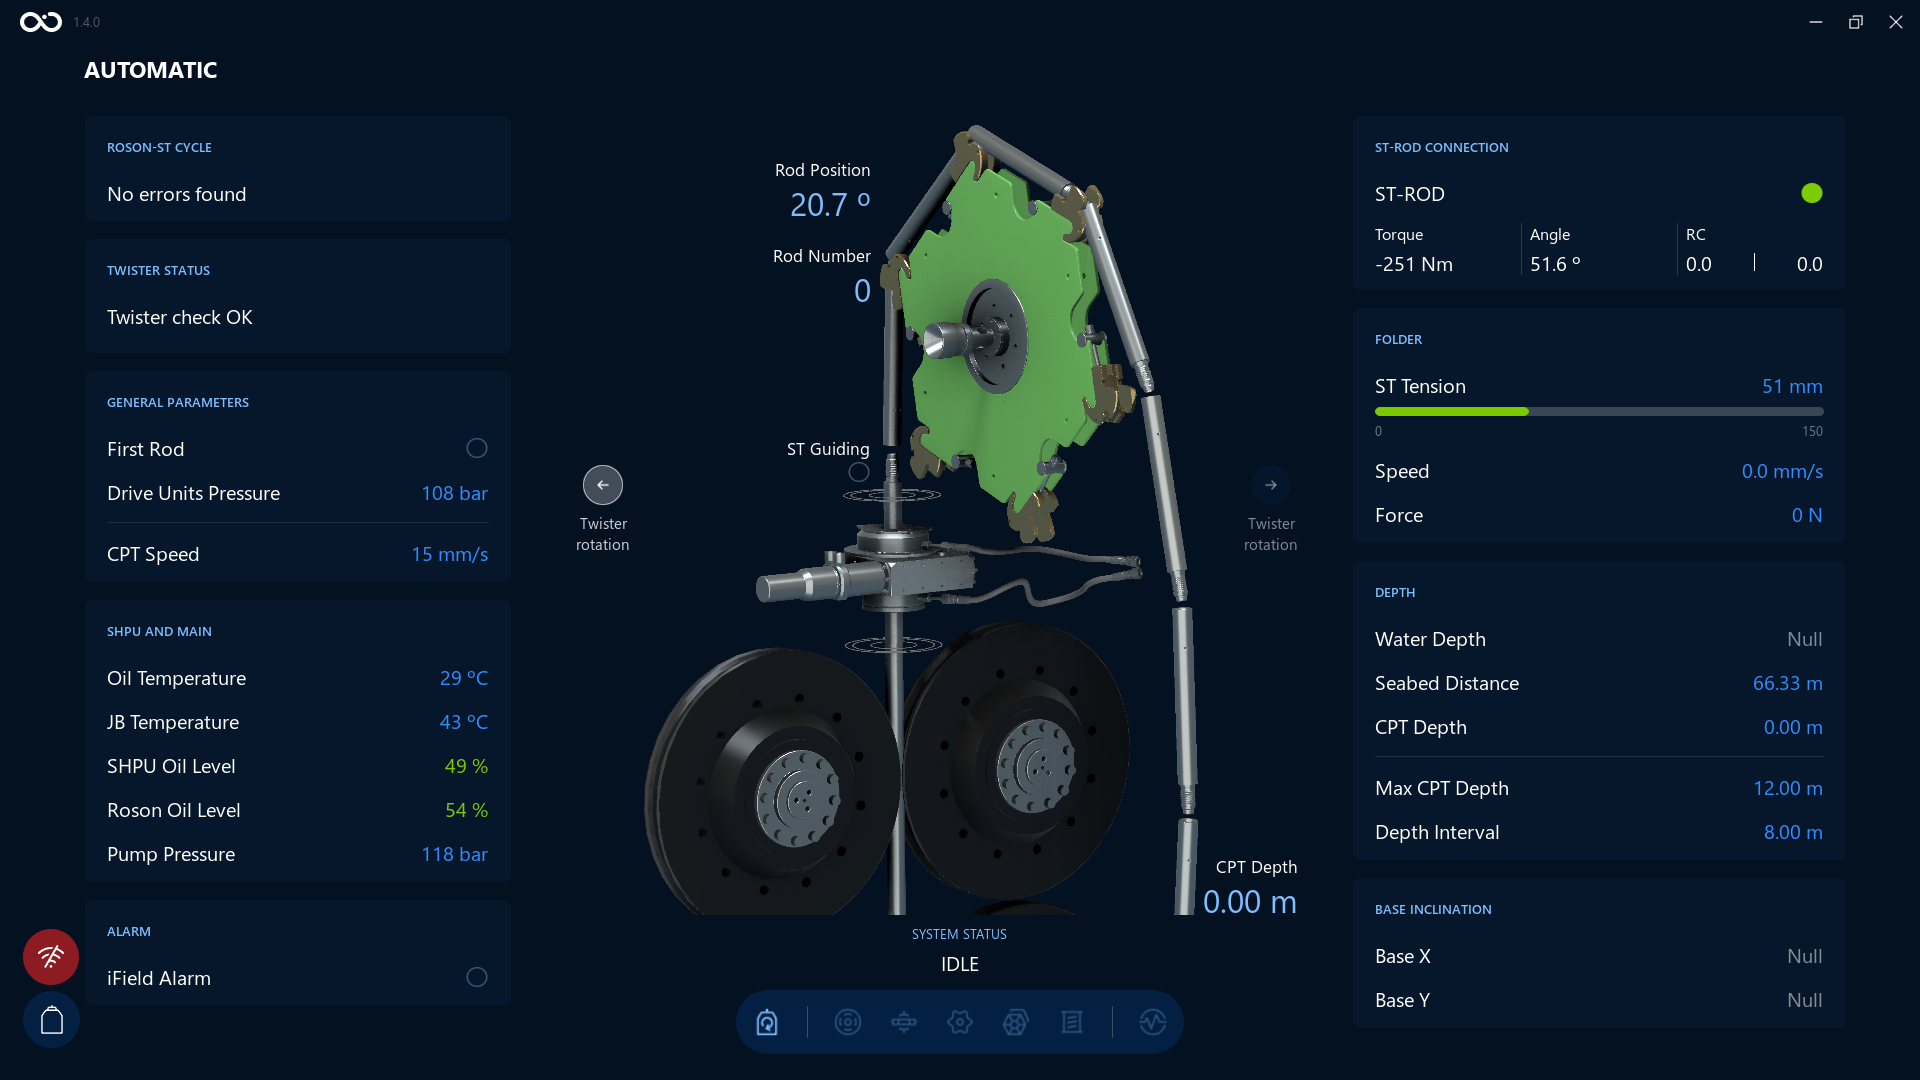
Twister Rotation Arrows
Next to the twister disc in the Visualization screen, you'll see two arrows labeled Twister rotation — one on the left, one on the right. These give the operator the same information as the equivalent indicator in APV's software, using a different color scheme:
| State | Meaning |
|---|---|
| Disabled (grey) | The twister is not rotating |
| White, right arrow | The twister is rotating CW |
| White, left arrow | The twister is rotating CCW |
| Green, right arrow | The CW End Switch has been reached — the twister has rotated as far as it can go in that direction |
| Green, left arrow | The CCW End Switch has been reached |
If the twister has reached an End Switch, the corresponding arrow always shows green, even if a rotate command is still being sent in that direction.
Here is an example of the Visualization screen with the right Twister rotation arrow shown in green, indicating the CW End Switch has been reached:
Here is an example with the left Twister rotation arrow shown in white, indicating the twister is actively rotating CCW:
Twister Vertical Movement Indicators
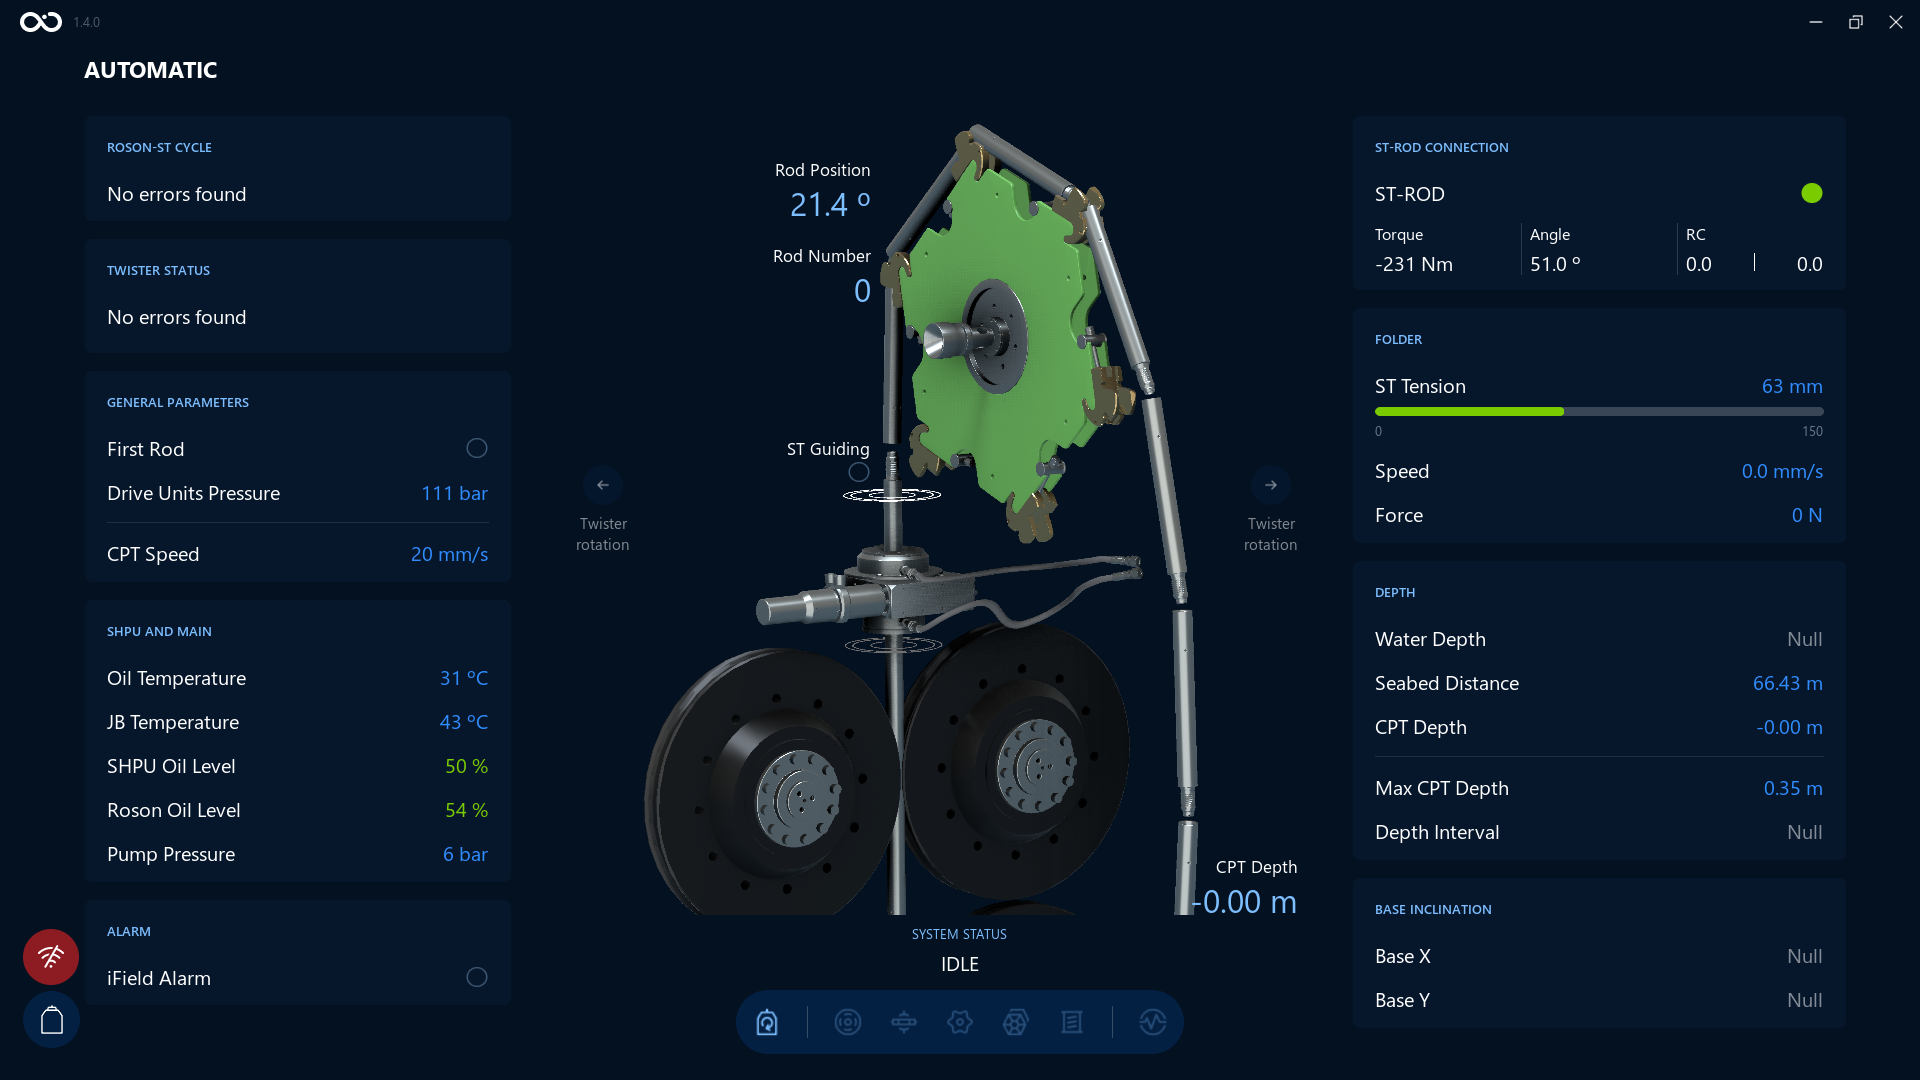
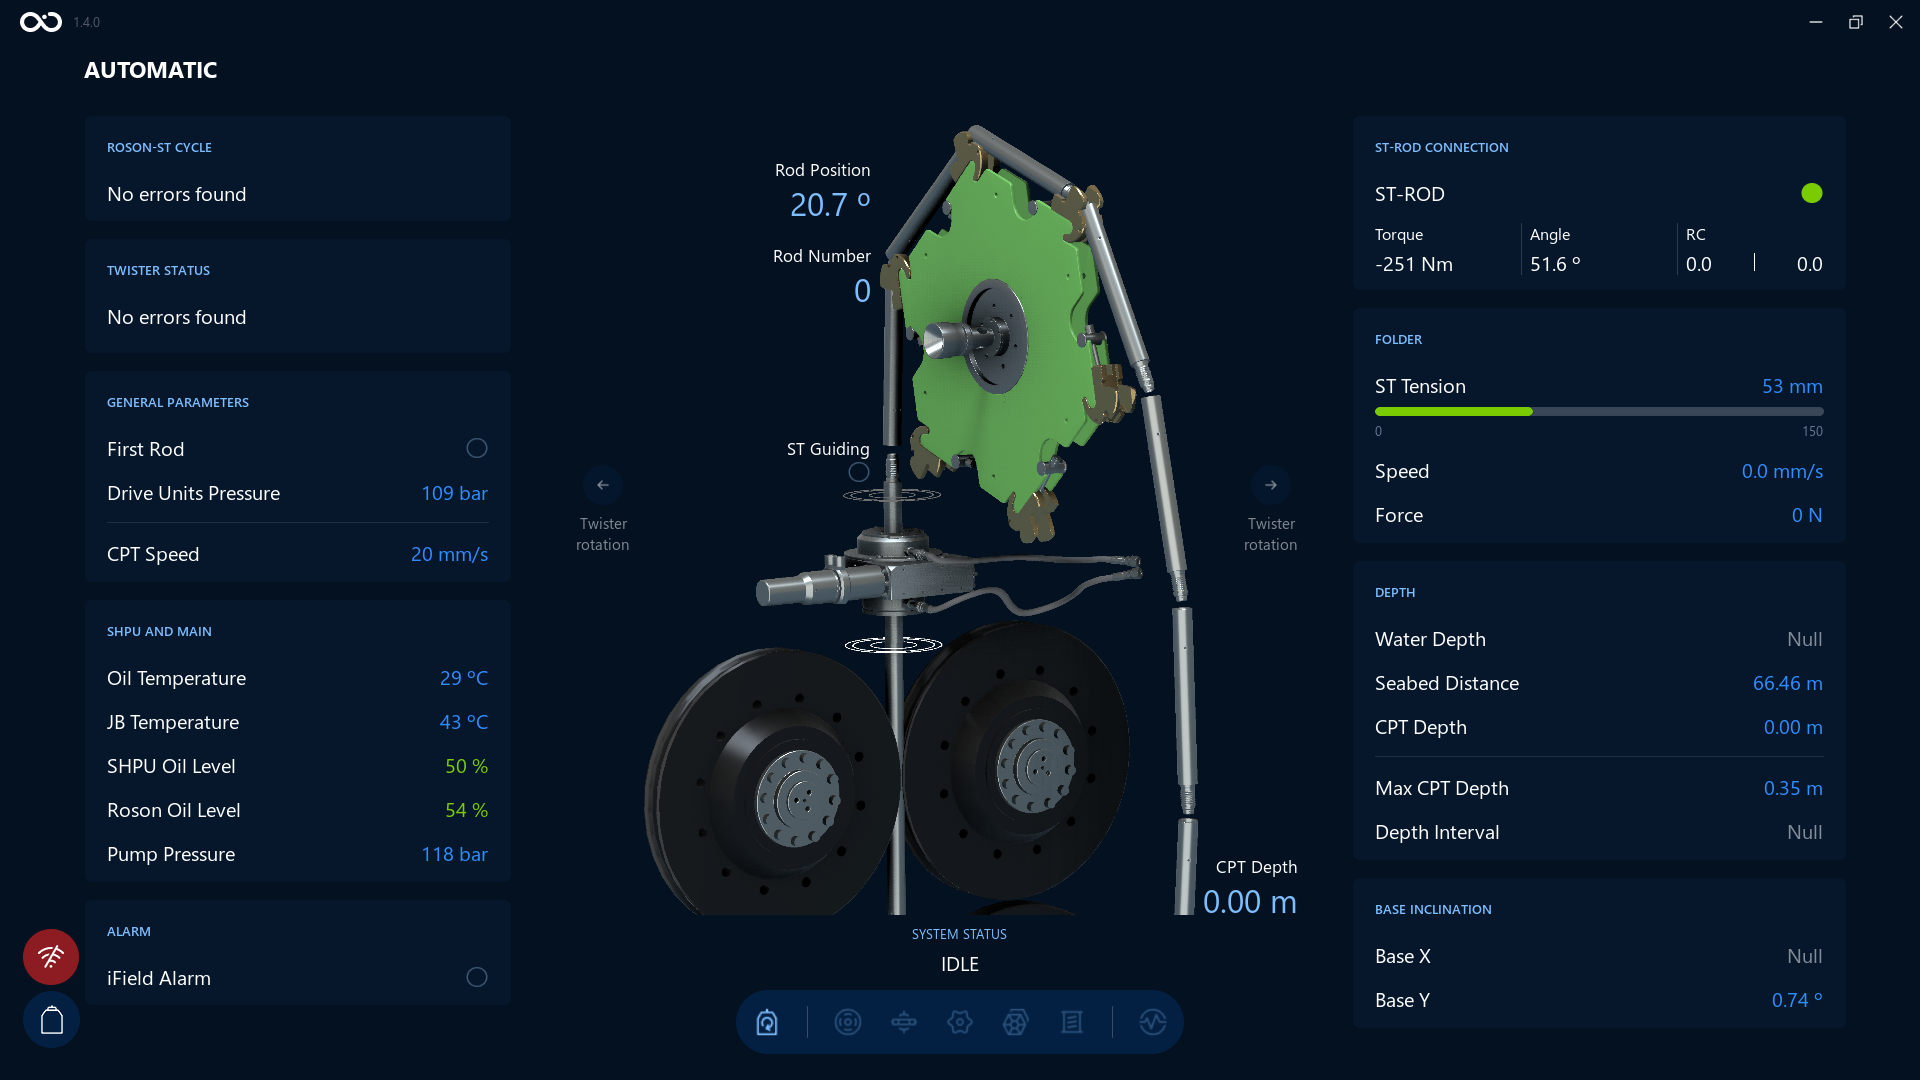
Above and below the twister clamp, two ring indicators show the twister's vertical travel, using the same color convention as the Twister rotation arrows: if the ring is white, it shows the direction the twister is currently moving; if it's green, the twister has reached its upper or lower travel limit.
Here are examples of the ring shown in white — while the twister moves up, and while it moves down:
And here is an example of the ring shown in green, once the twister has reached its lower travel limit:
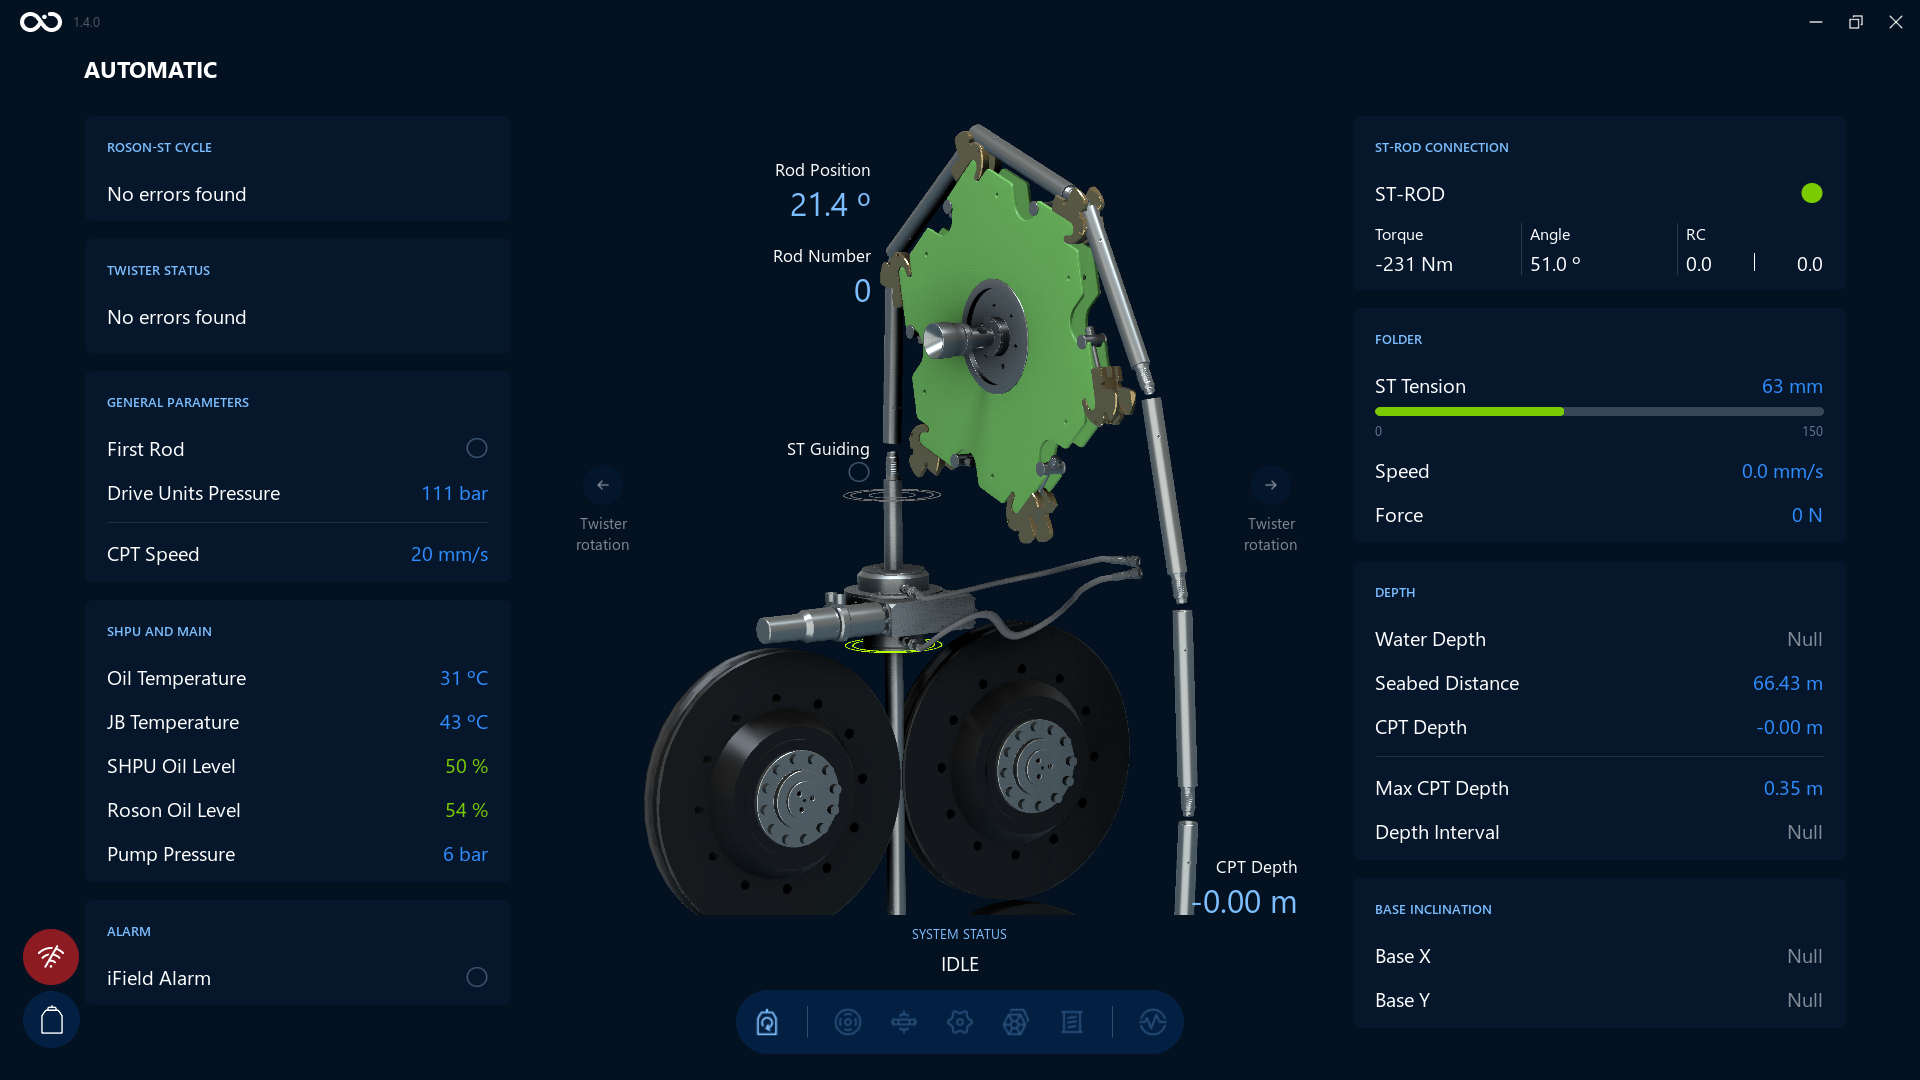
Twister Clamp Indicator
The rectangle at the center of the twister assembly is highlighted in green when the twister clamps are closed — the same color convention used by APV.
Here is an example with the clamp indicator highlighted in green, indicating the twister clamps are closed:
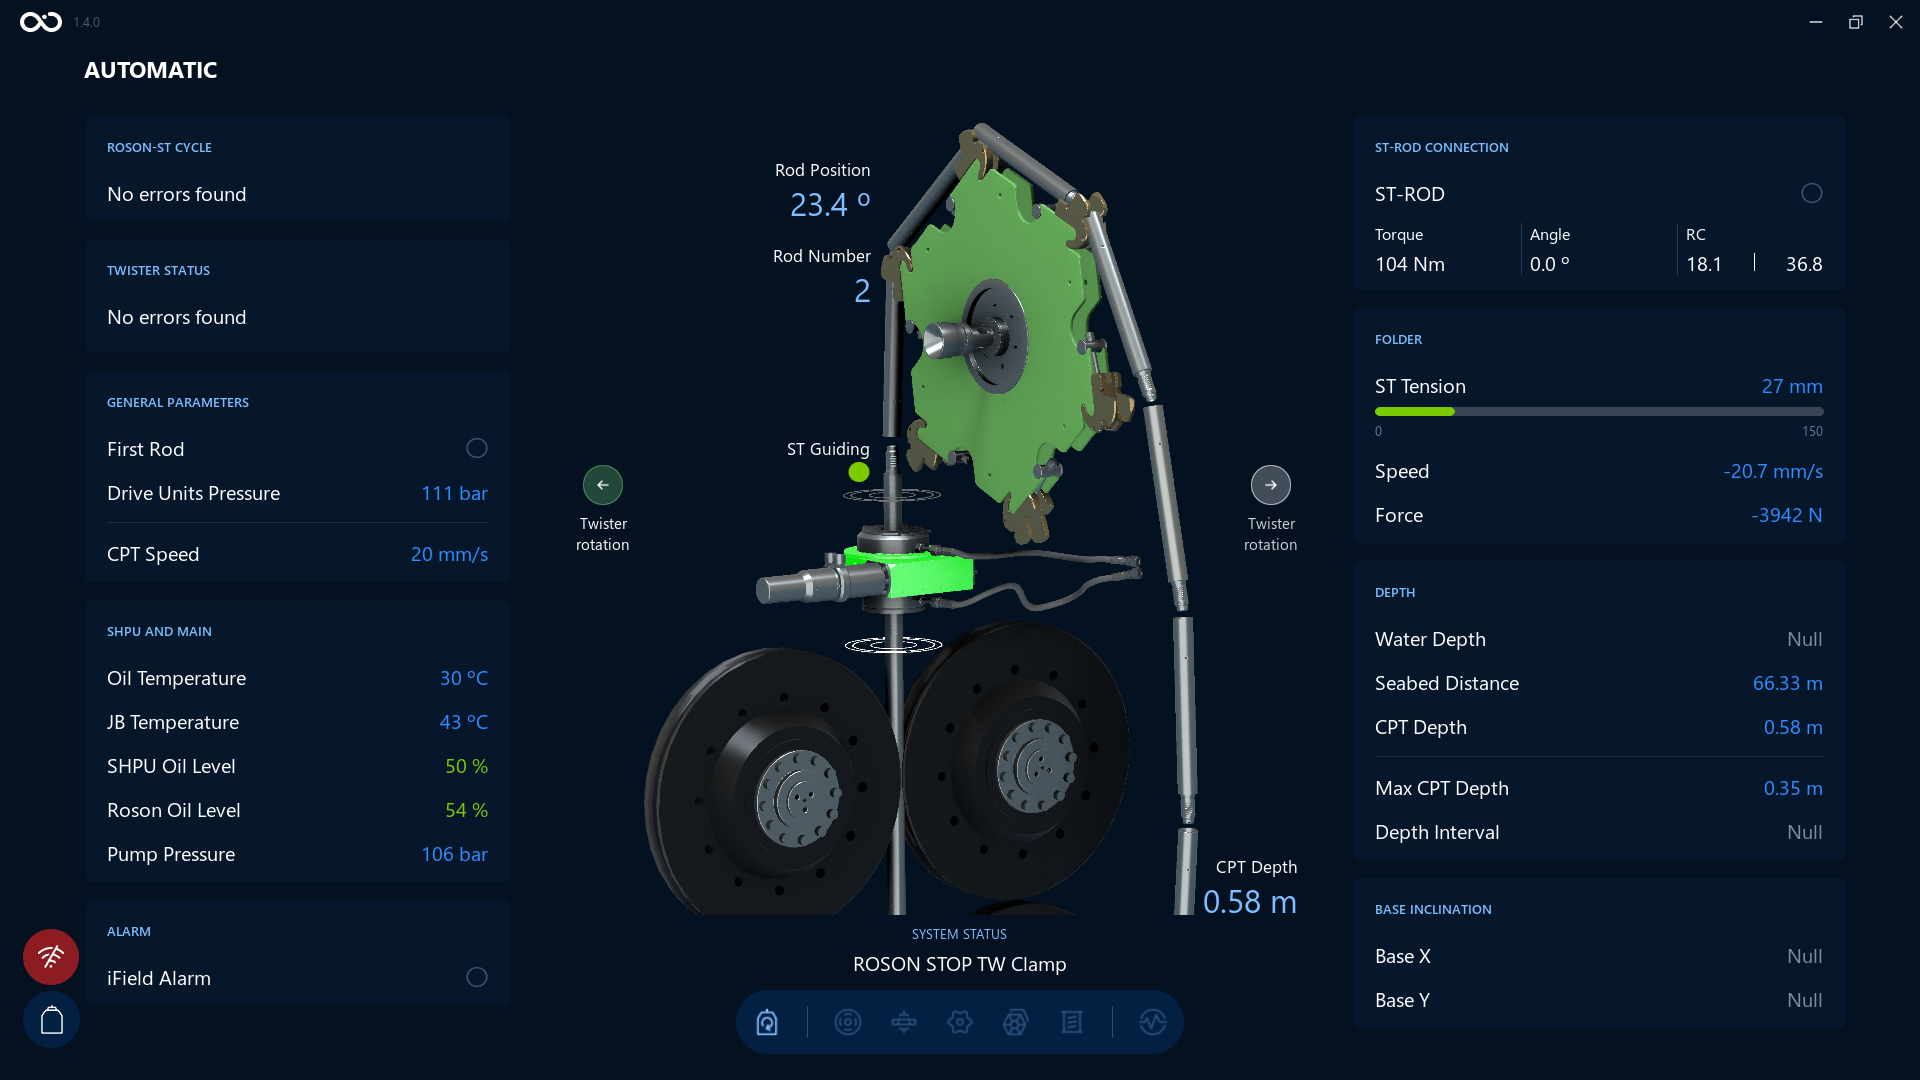
Pull and Push
Pull command starts the automatic ST pull cycle.
Push command starts the automatic ST push cycle.
Let's have a look at a Push command. After an operator taps on a Push button, the Roson starts each function in order to push the cone downwards. For example, you can see the button color and the system status change on the Controls screen. And the status changes to Pushing on the Visualization screen:
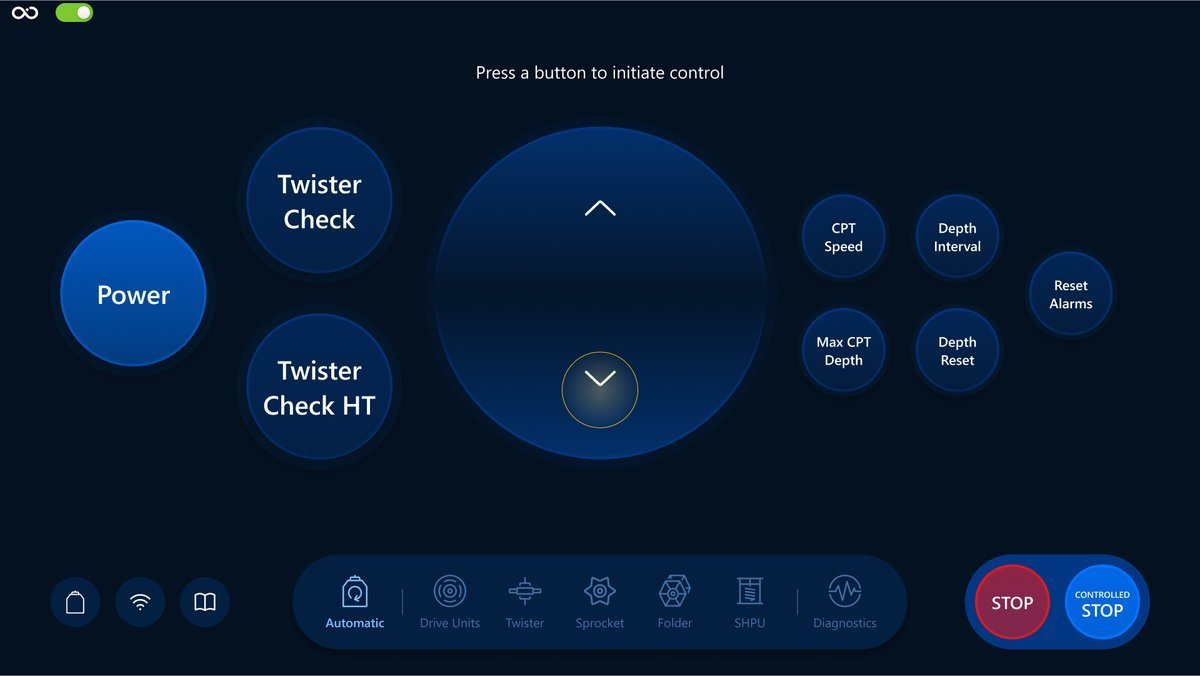
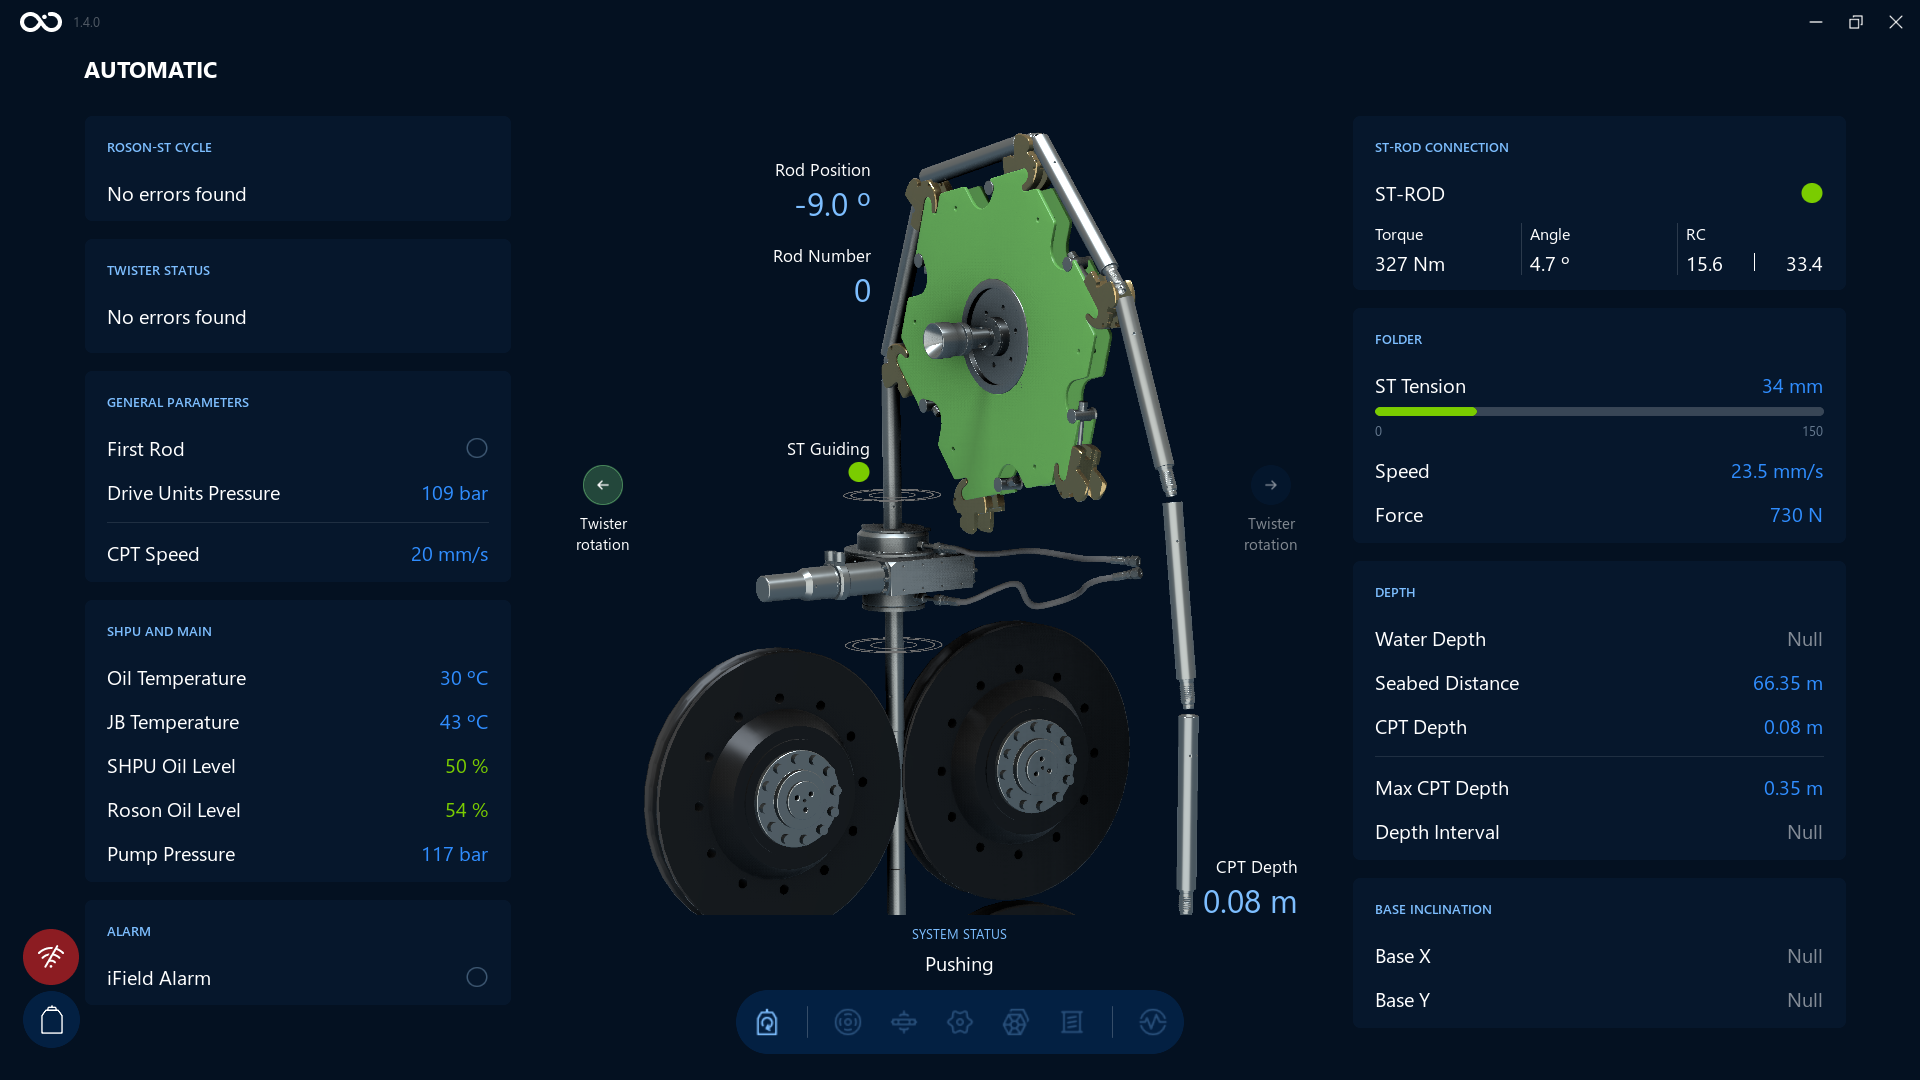
Operator can stop the process by tapping the Controlled Stop button on the bottom right side. The push cycle is terminated after the Controlled Stop command is executed. Here is an example of executing the Controlled Stop command and the status change on the Visualization screen:
CPT Speed
Opens a modal where an operator can set the CPT speed.
The button:
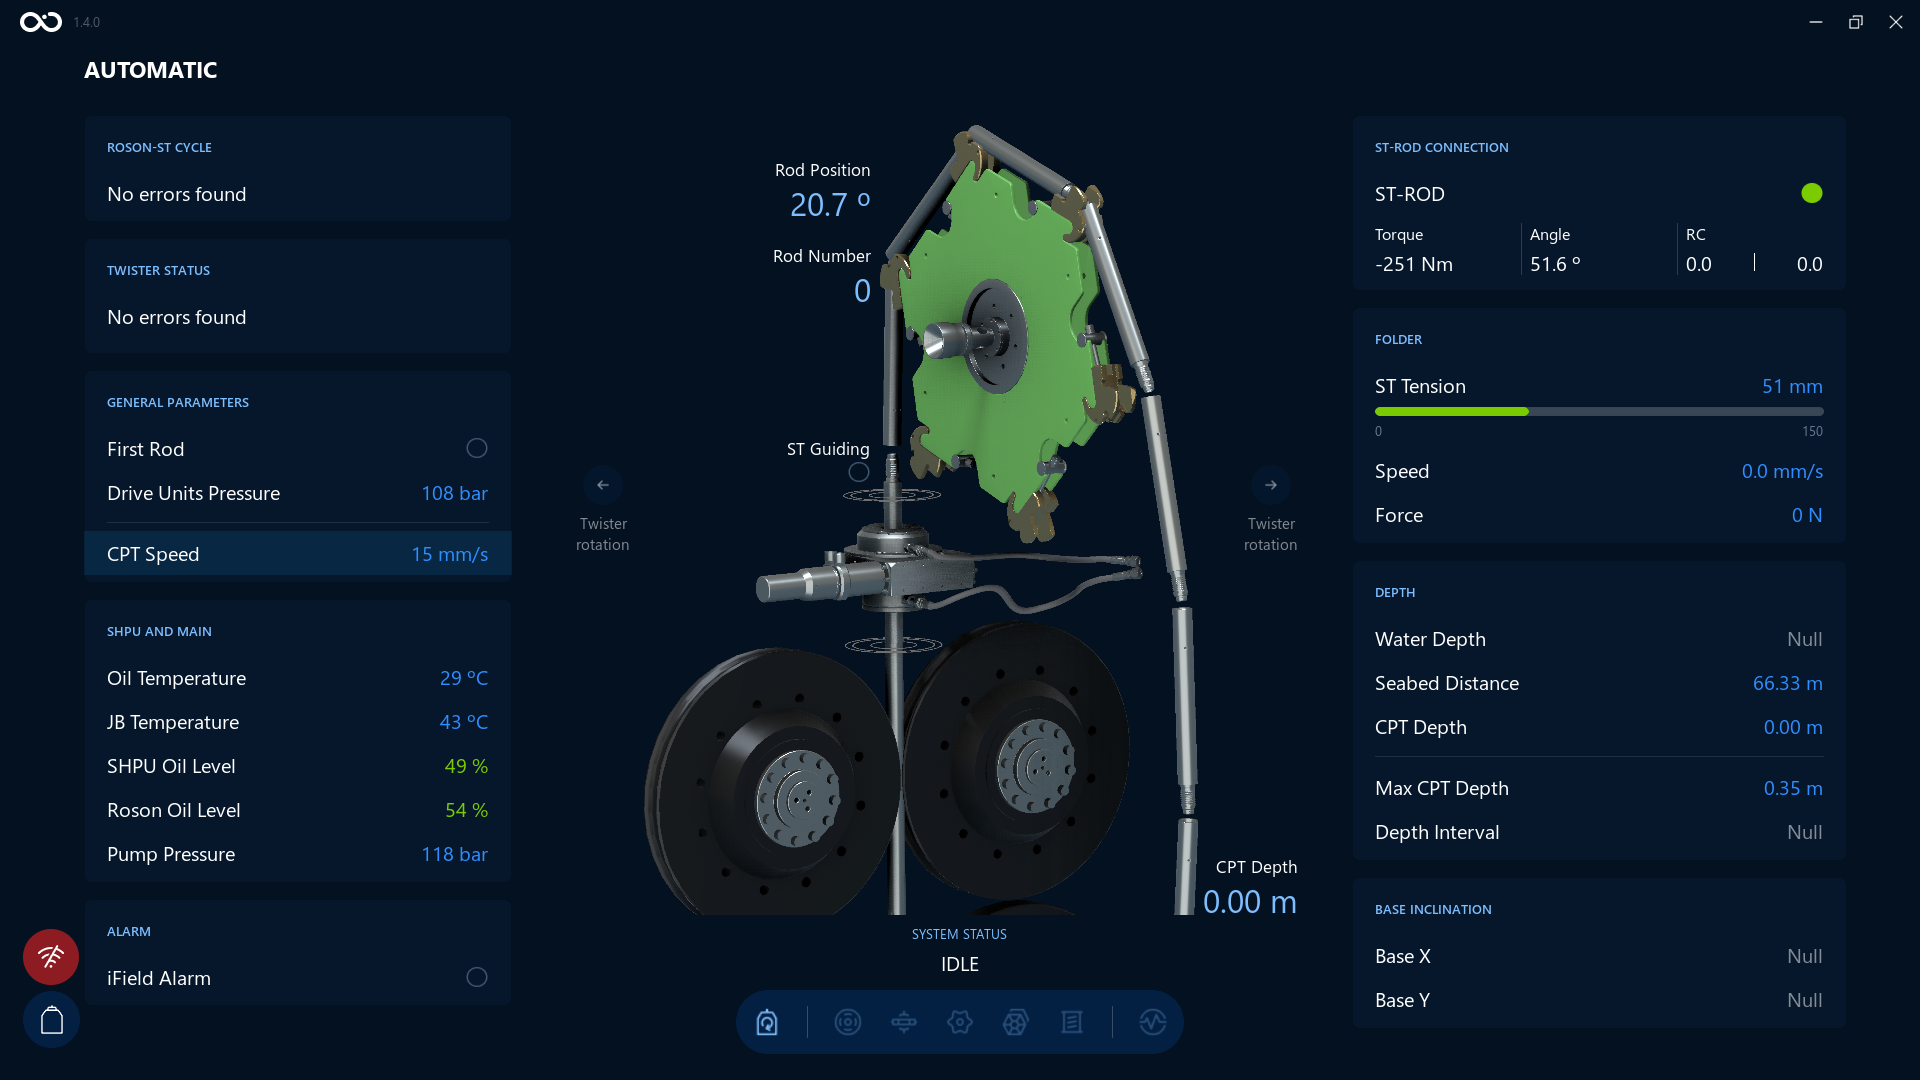
An example of the Visualization screen after changing the value for CPT Speed to 12 mm/s. We can see the CPT Speed value changed and highlighted on the bottom left side:
Depth Interval
With this command, it's possible to control the interval that the CPT will push.
This type of a command is a solution to execute push/pull of the CPT, where the Stop condition will go alongside the command. This will imply that as soon the command arrives to the Vessel and the CPT, the software will know at which depth it should send a controlled stop, mitigating the latency problem even in the worst conditions. The penetration will stop in pre-determined intervals set by the depth interval without the operator needing to stop the CPT.
For example, if the CPT requires to stop at every meter for additional subtests, then set the depth interval at 1.0m and it's only required to push without any additional input from the operator.
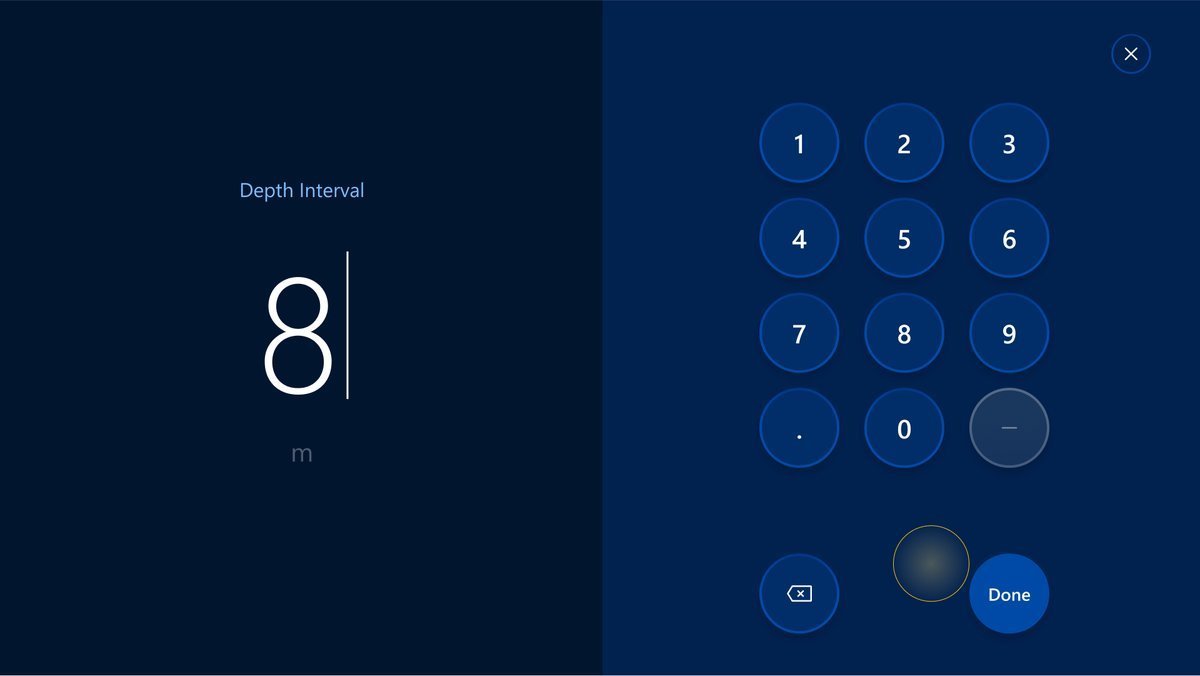
The button opens a modal where an operator can set the Depth Interval for CPT:
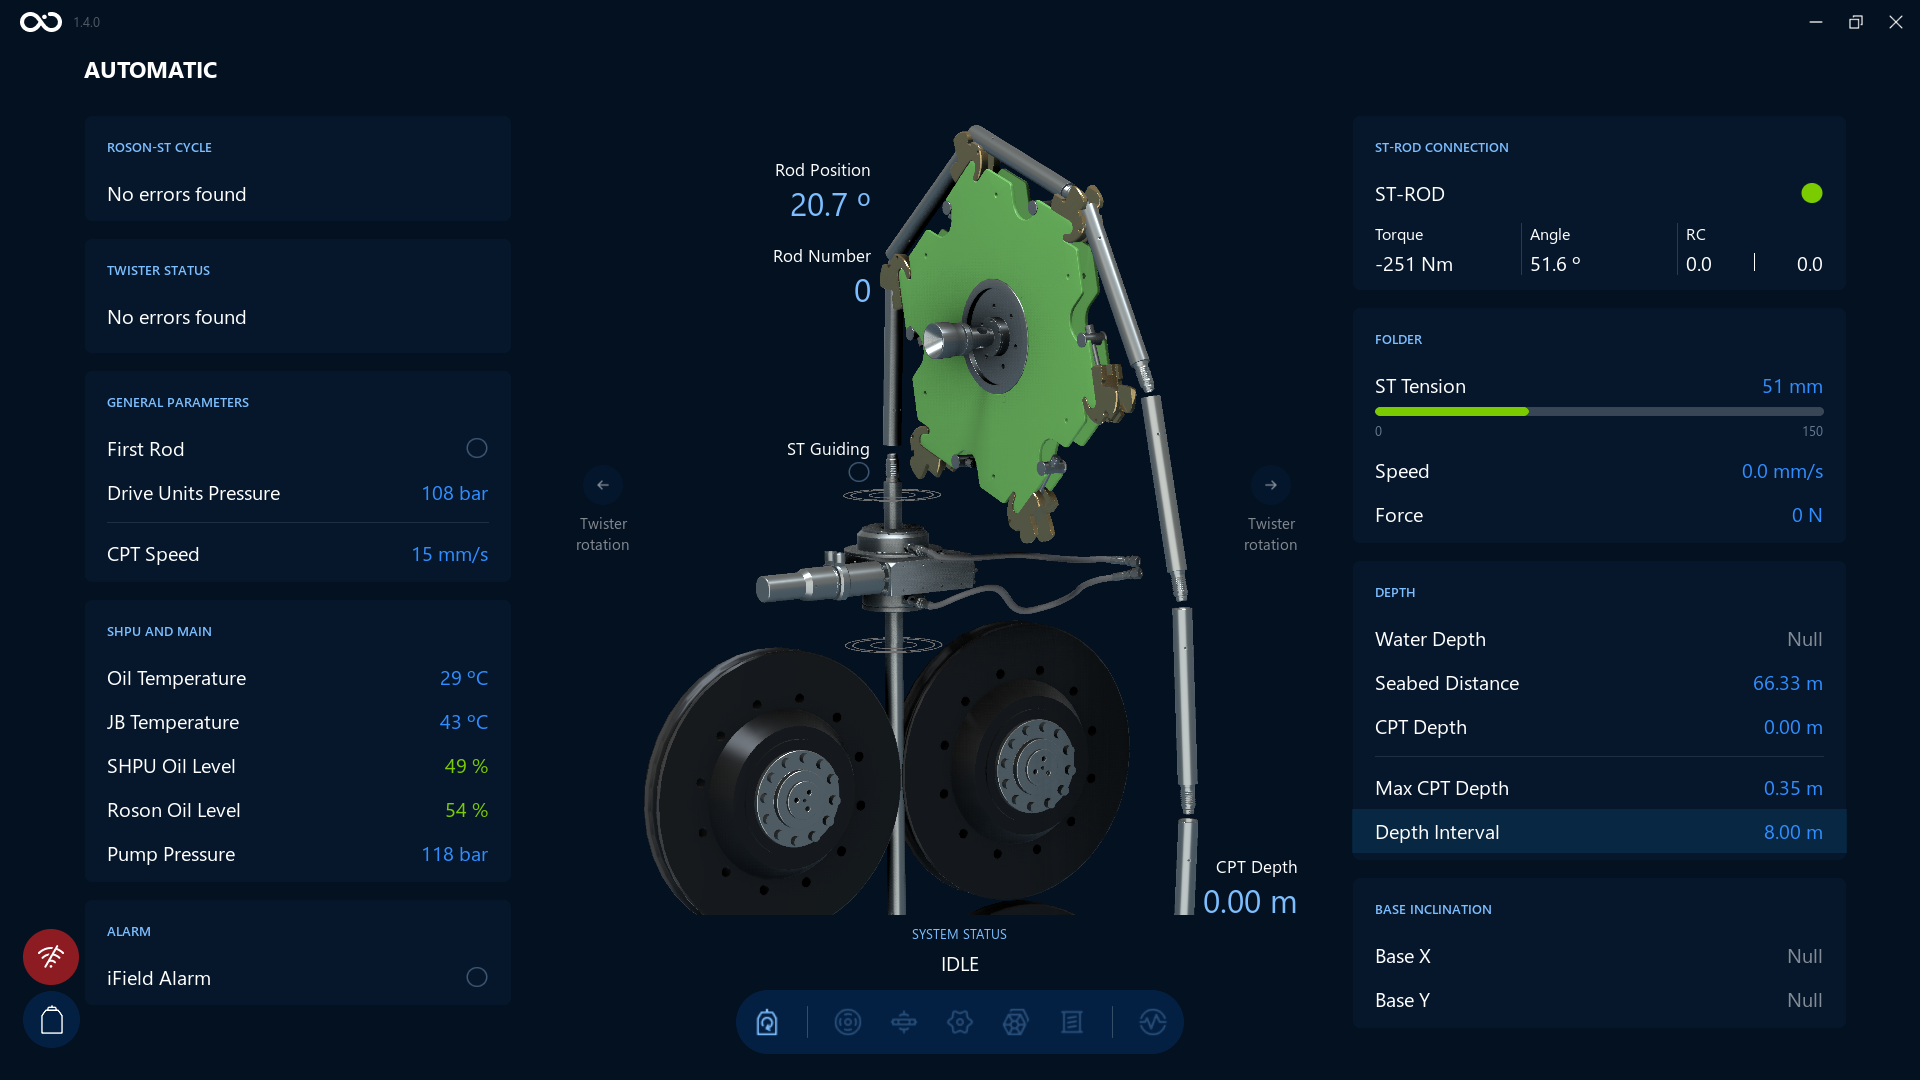
An example of the Visualization screen after changing the value for Depth Interval to 8m. We can see the Depth Interval value changed and highlighted on the bottom right side:
Reset Alarms
This function overrides the Ifield alarm and can be used when the alarm level is reached. The acoustic signal is switched off and the automatic cut-off of the hydraulic push system is cancelled.
The button:
An example of the Visualization screen on about to click on Reset Alarms button:
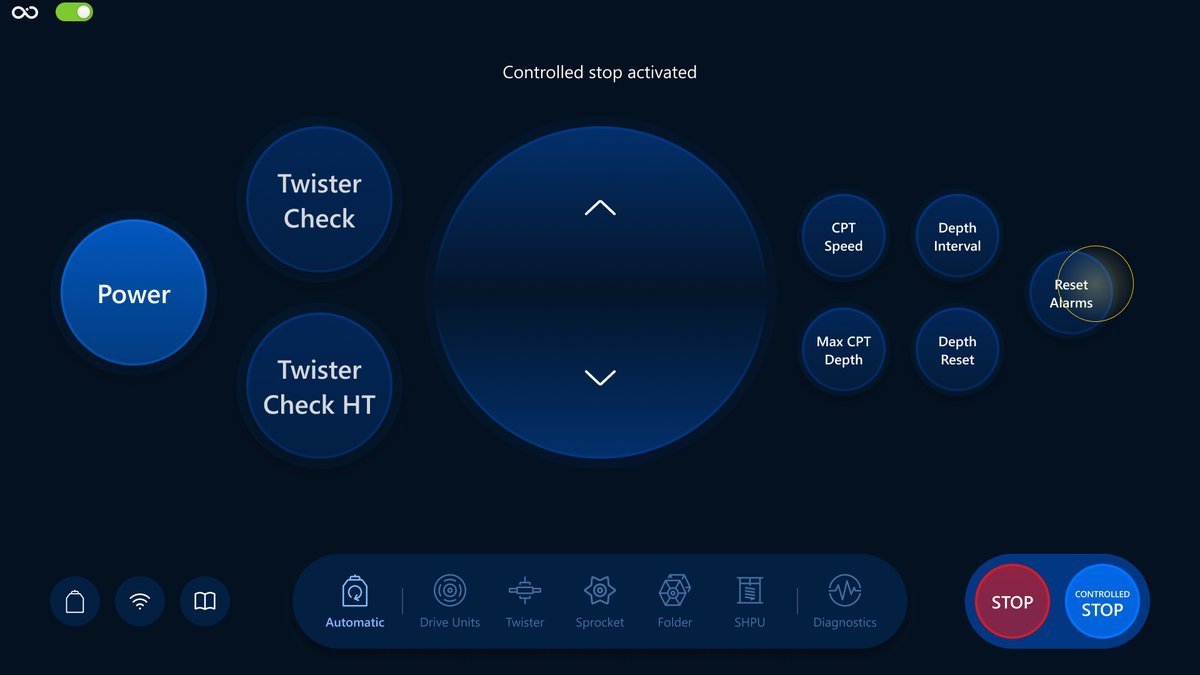
Max CPT Depth
Opens a modal where an operator can set the maximum CPT Depth.
The button:
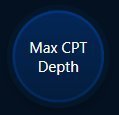
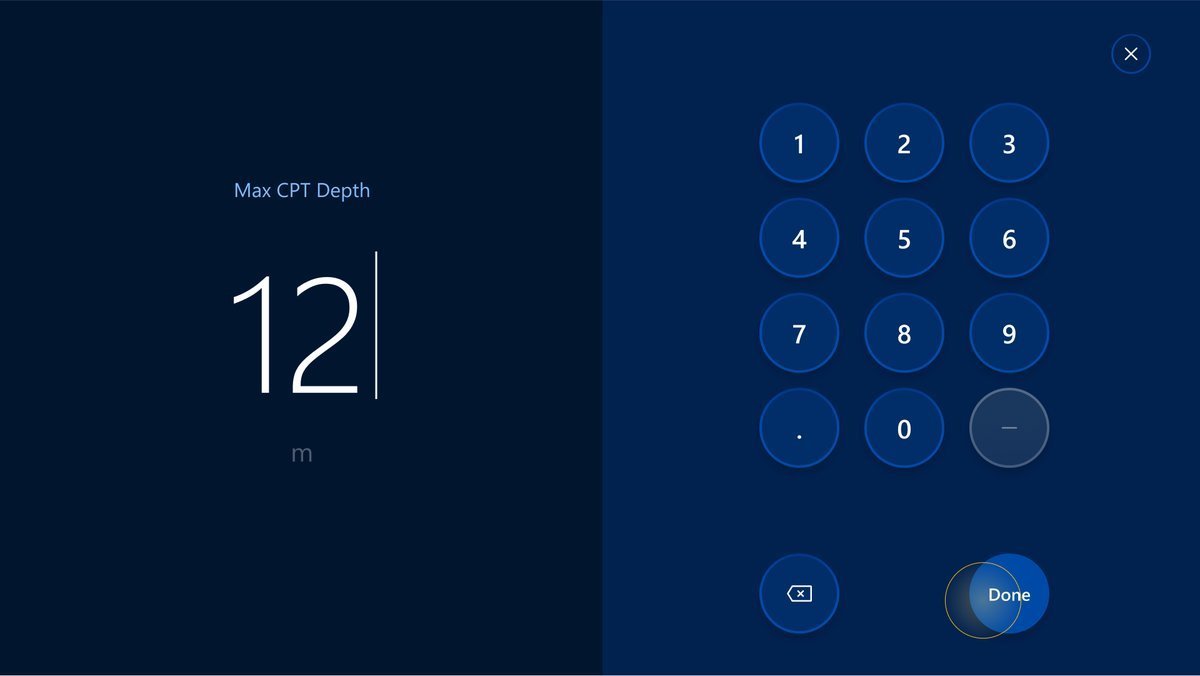
An example of the Visualization screen after changing the value for Max CPT Depth to 12m. We can see the Max CPT Depth value changed and highlighted on the bottom right side:
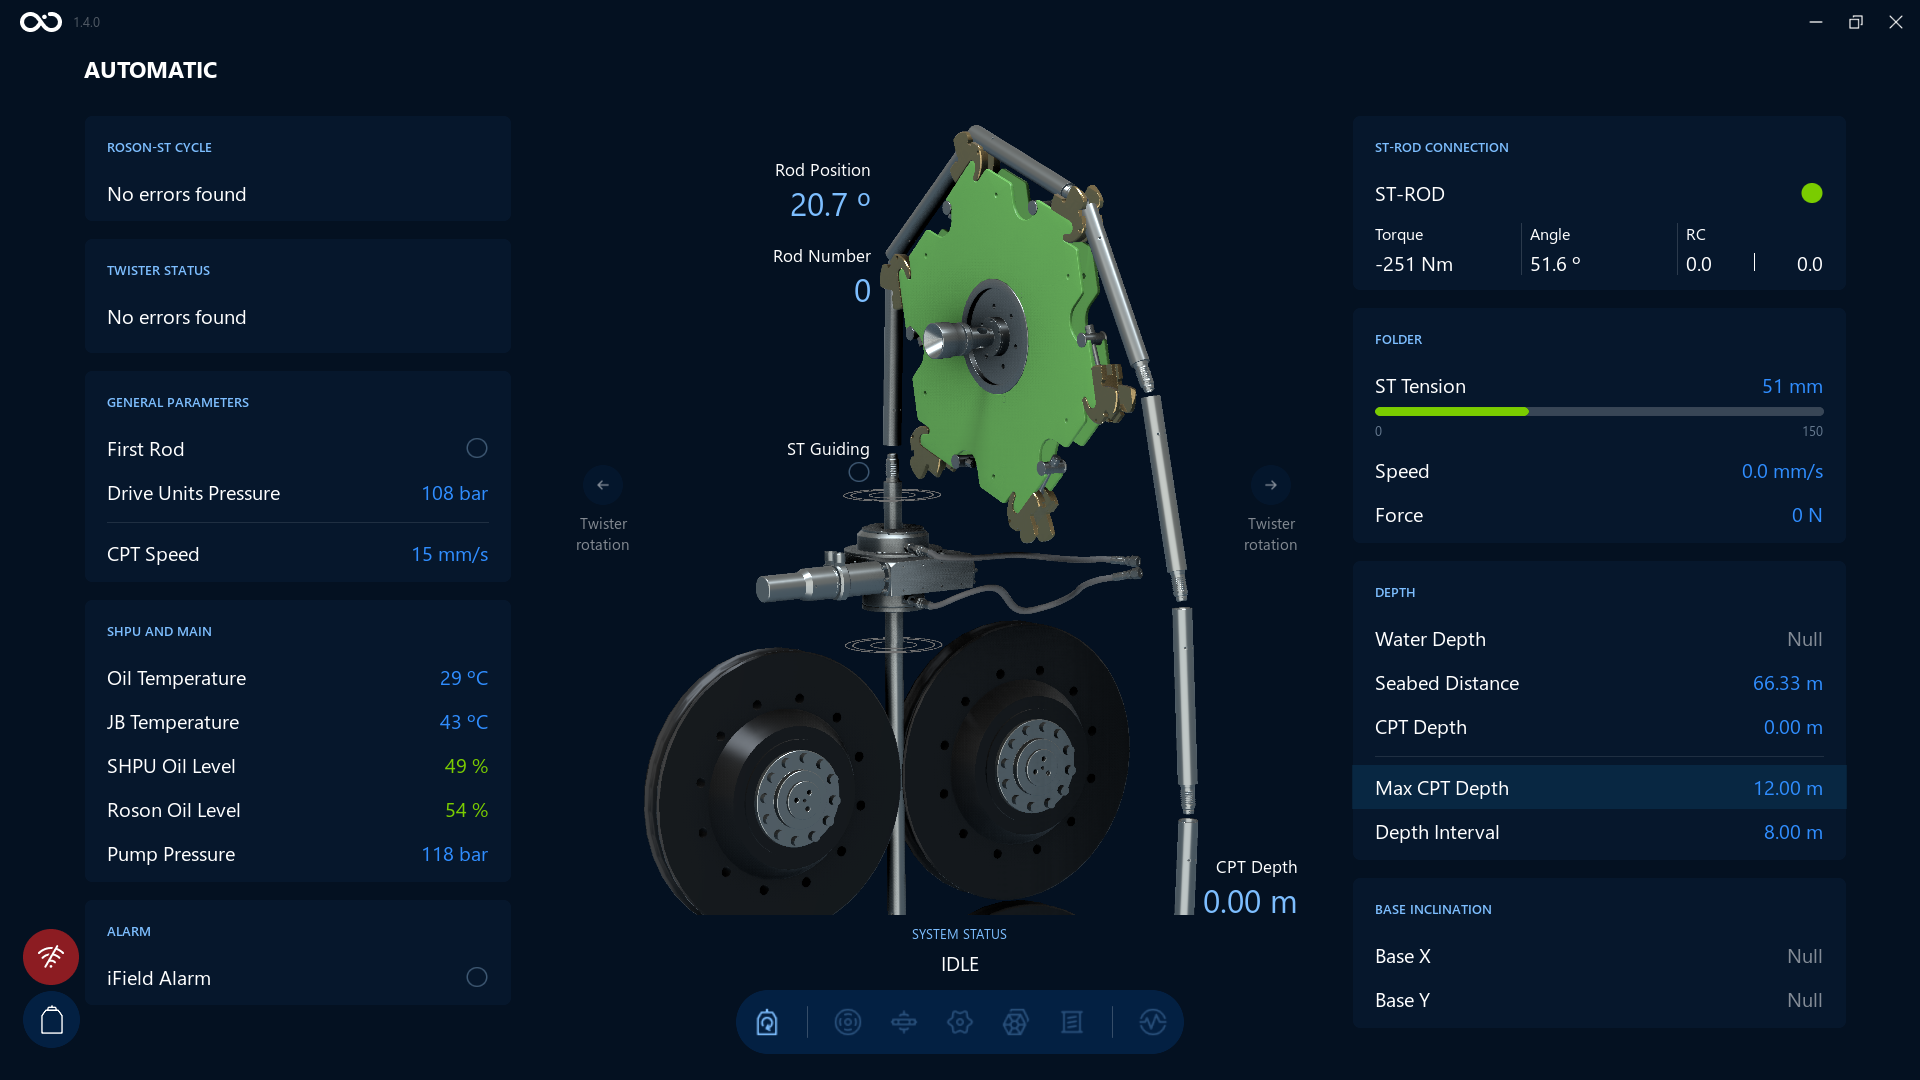
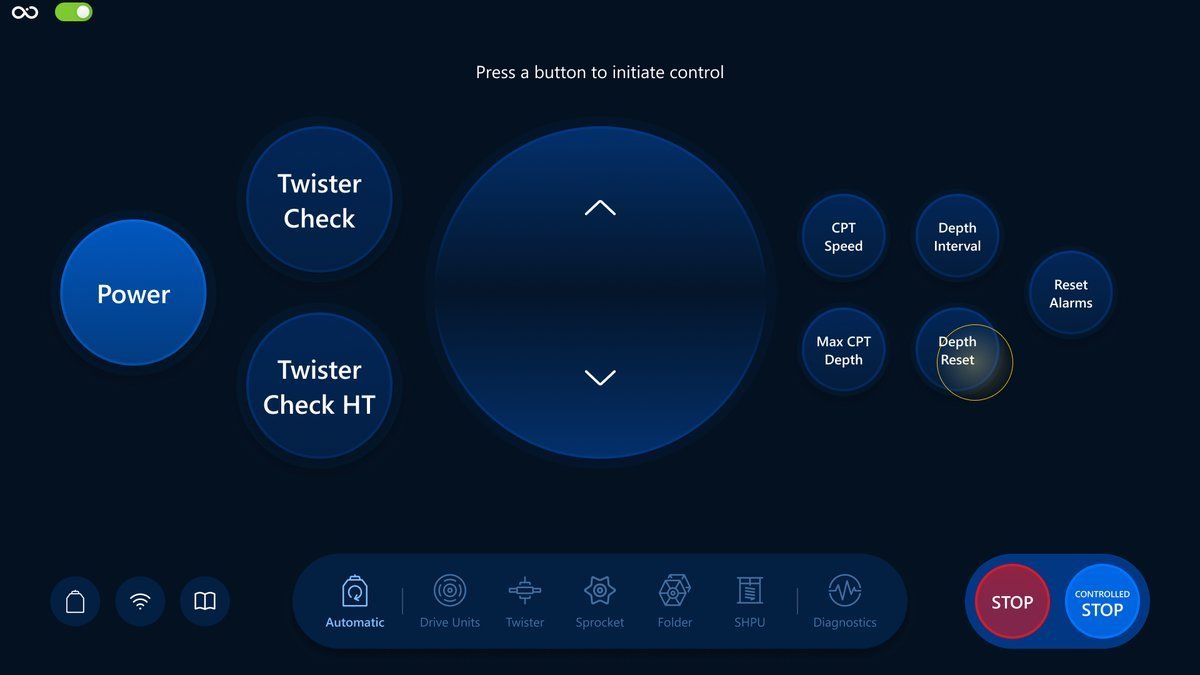
Depth Reset
Resets the CPT Depth.
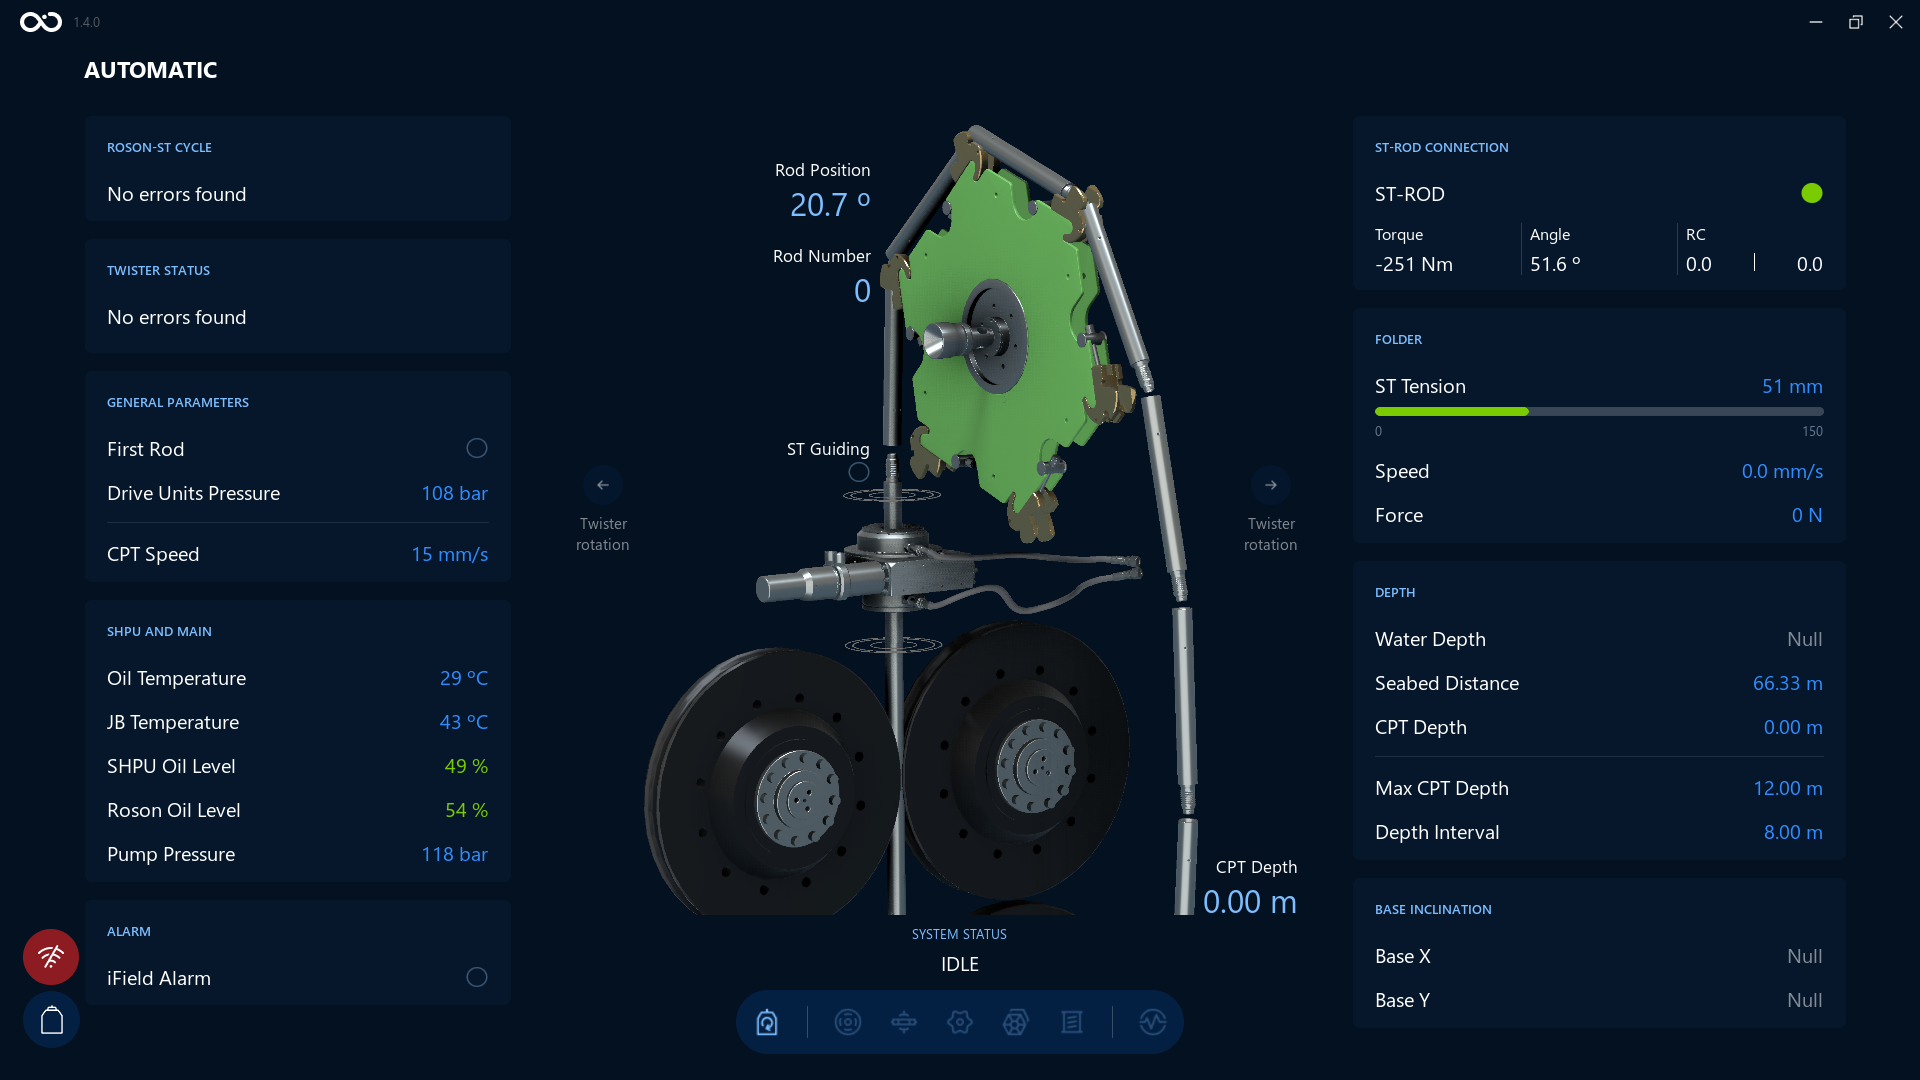
An example of the Visualization screen after tapping the Depth Reset button. We can see the CPT Depth value was reset on the bottom right side:
What's next?
Feel free to go to the next section and learn the Manual Mode in more detail: Manual Mode overview
Manual Mode ↵
Manual Mode
What is the Manual Mode?
Welcome to the introduction of the Manual Mode! Unlike Automatic mode, in a Manual Mode, an operator can make minor adjustments if necessary. This mode is responsible for manual control of each Roson-ST function.
In the next sections you will be able to learn more about Manual Mode screens and its Controls, such as:
Drive Units: Drive Units overview.
Twister: Twister overview.
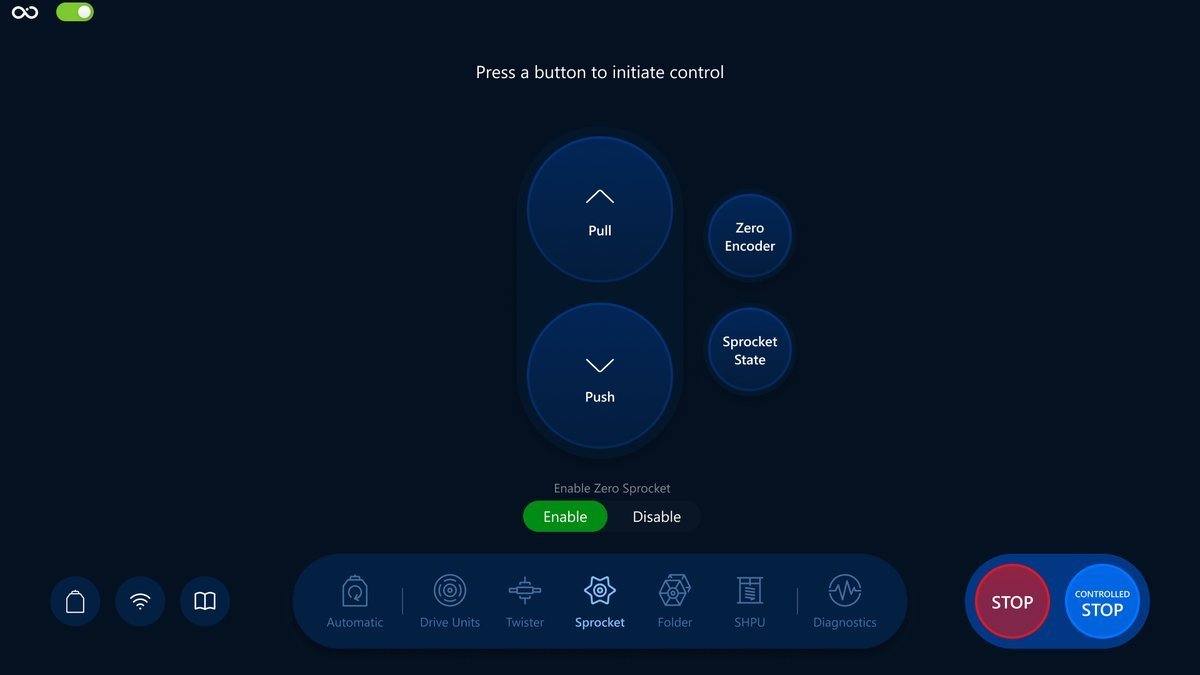
Sprocket: Sprocket overview.
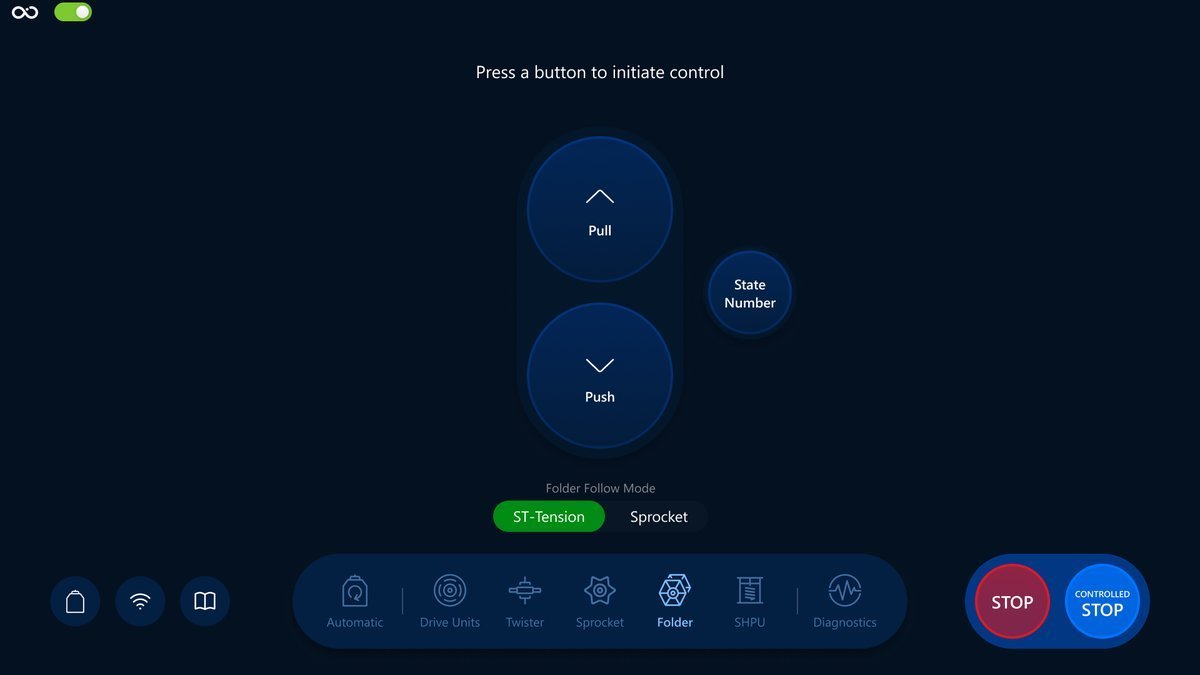
Folder: Folder overview.
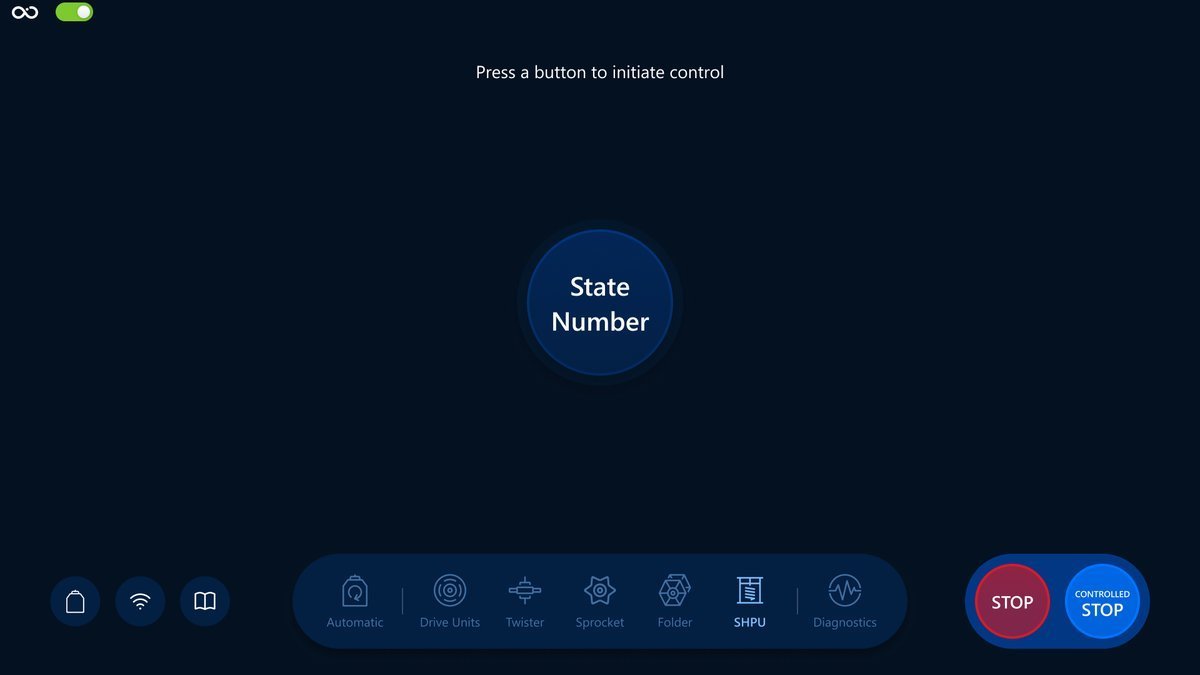
SHPU: SHPU overview.
Navigation
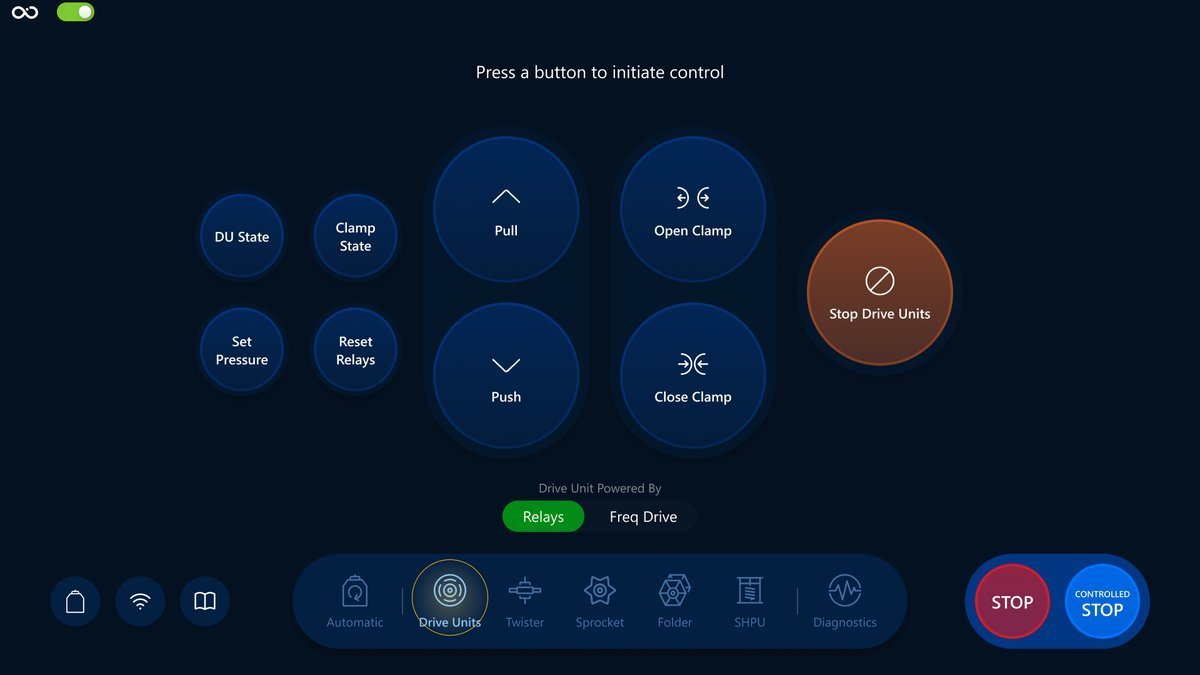
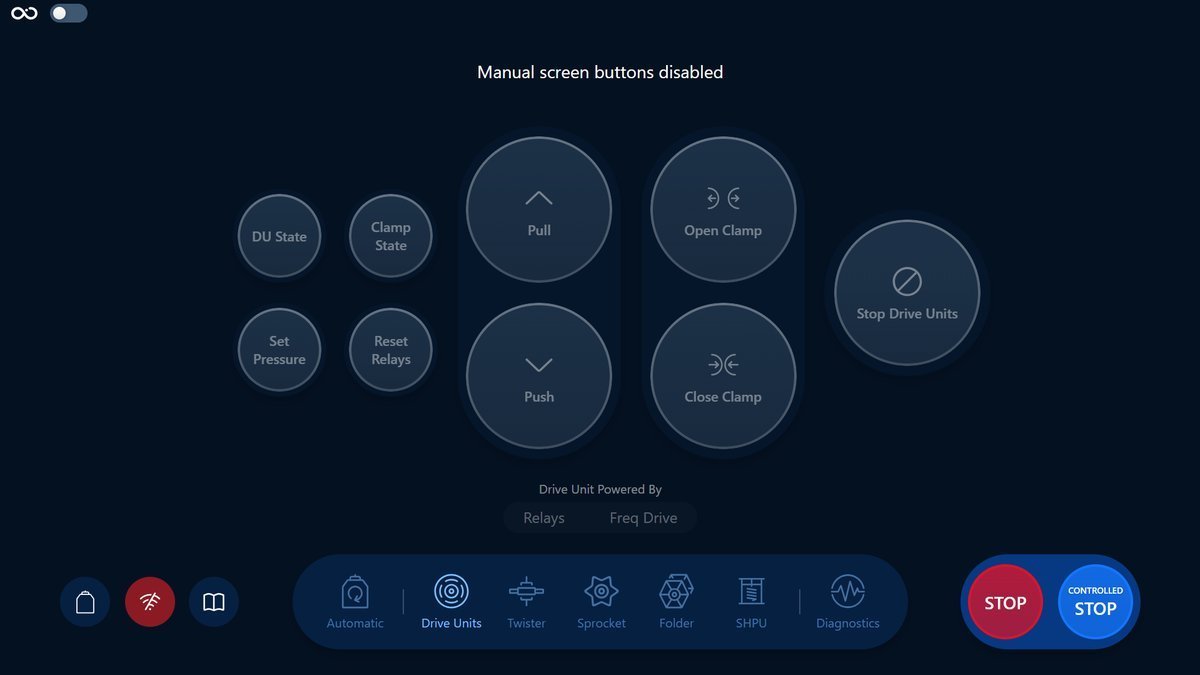
Choose one of the listed above screens you need and tap on the icon in the navigation bar for navigation. Here is an example with the Drive Units screen:
Button disable toggle
Like in the automatic screen, the manual screens have a single toggle to disabled all the buttons in all of the manual screen, positioned in the top left corner of the screen
Next section
Feel free to continue with the Drive Units screen by following this link: Drive Units overview.
Drive Units
In this section we will have a closer look at how you can use the Drive Units screen to control the system during the CPT operation in Manual Mode.
Navigation
Choose the Drive Units icon in the navigation bar for navigation:
Controls
We will have a look at a brief description of the controls, their responsibilities and also how it reflects on the Visualization screen.
DU State
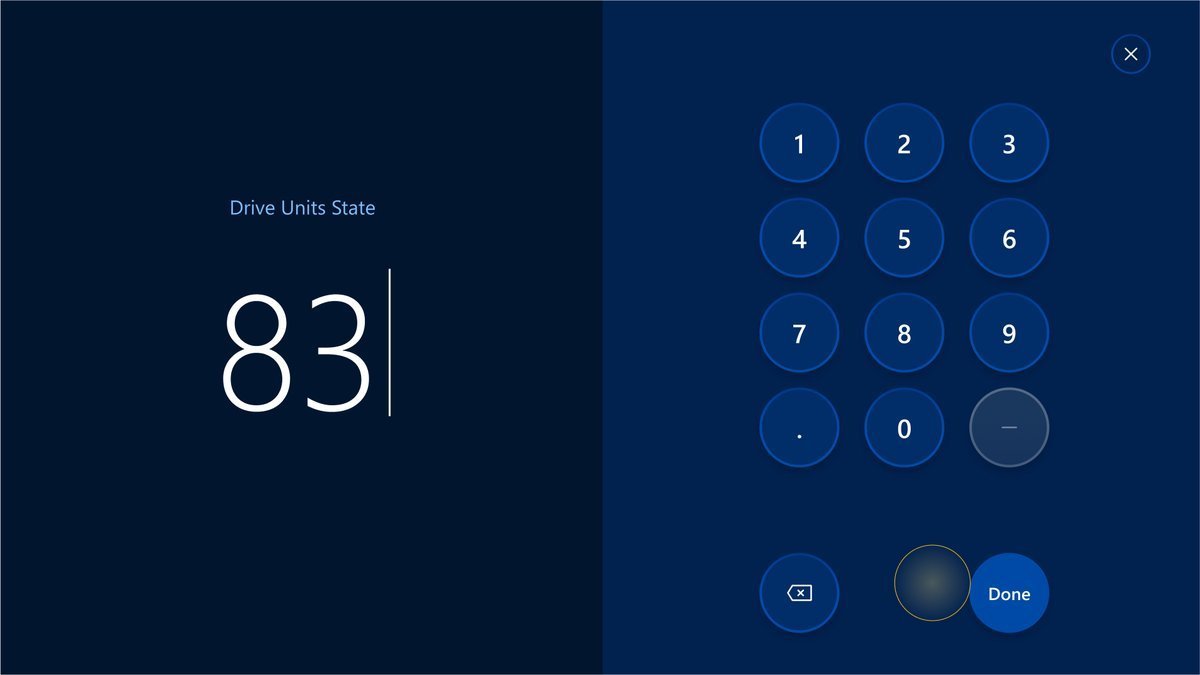
Opens a modal where an operator can set the Drive Units State.
The button:
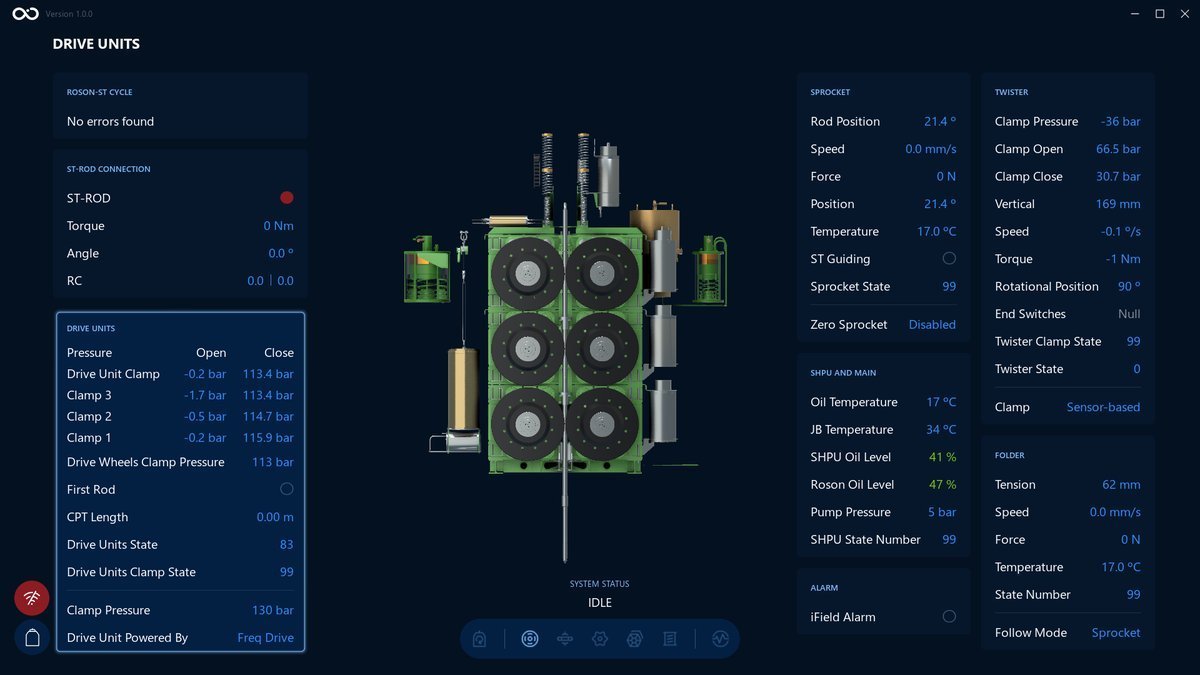
An example of the Visualization screen after changing the value for Drive Units State to 83. We can see the Drive Units State value changed and highlighted on the bottom left side:
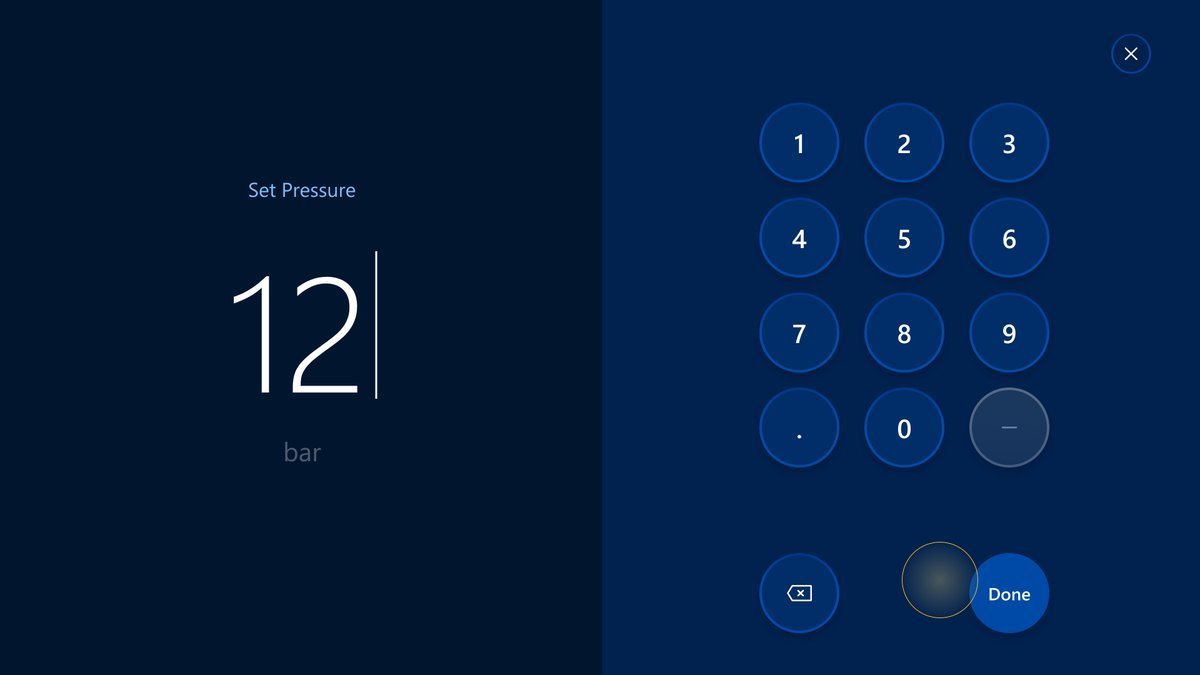
Set Pressure
Opens a modal where an operator can set the clamp pressure.
The button:
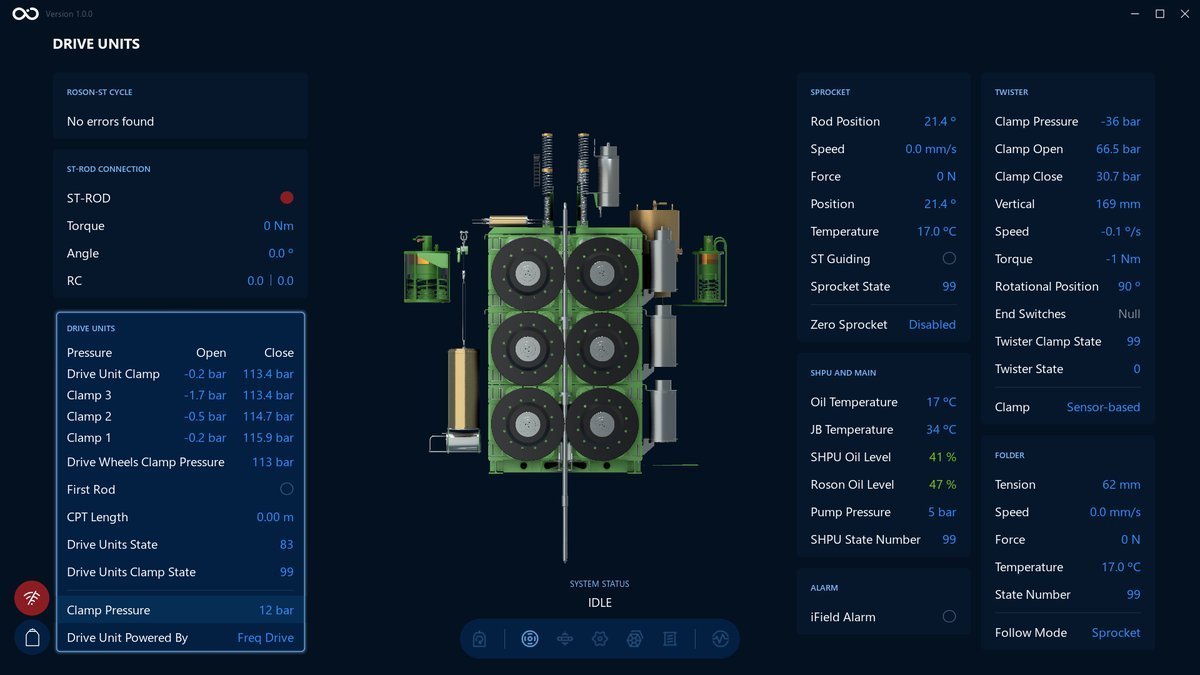
An example of the Visualization screen after changing the pressure value to 12 bar. We can see the Clamp Pressure value changed and highlighted on the bottom left side:
Clamp State
Opens a modal where an operator can set the clamp state.
The button:
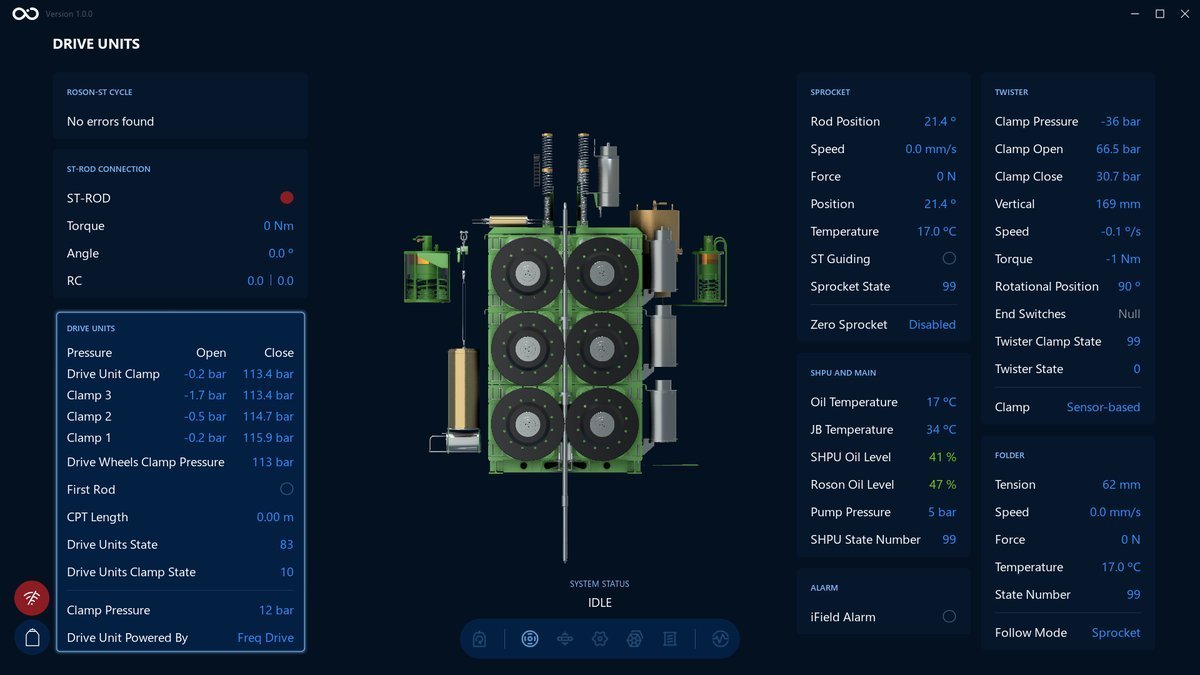
An example of the Visualization screen after changing the value for Clamp State to 10. We can see the Drive Units Clamp State value changed on the bottom left side:
Reset Relays
Is responsible for unblocking the DU in case they get stuck or are having problems.
The button:
This command doesn't change anything on the Visualization screen.
Pull and Push
Are responsible for rotating the Drive wheels in the push and pull directions.
The buttons:
An example of the Visualization screen after Pull button is pressed. We can see the values changed in the Drive Units section:
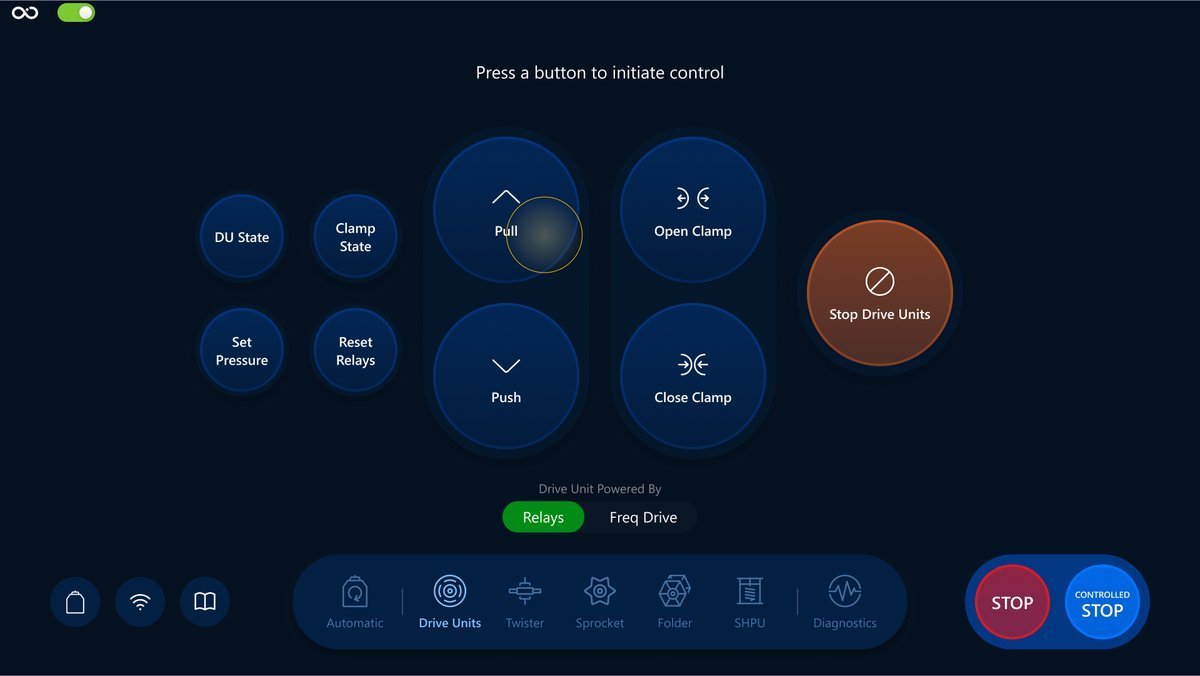
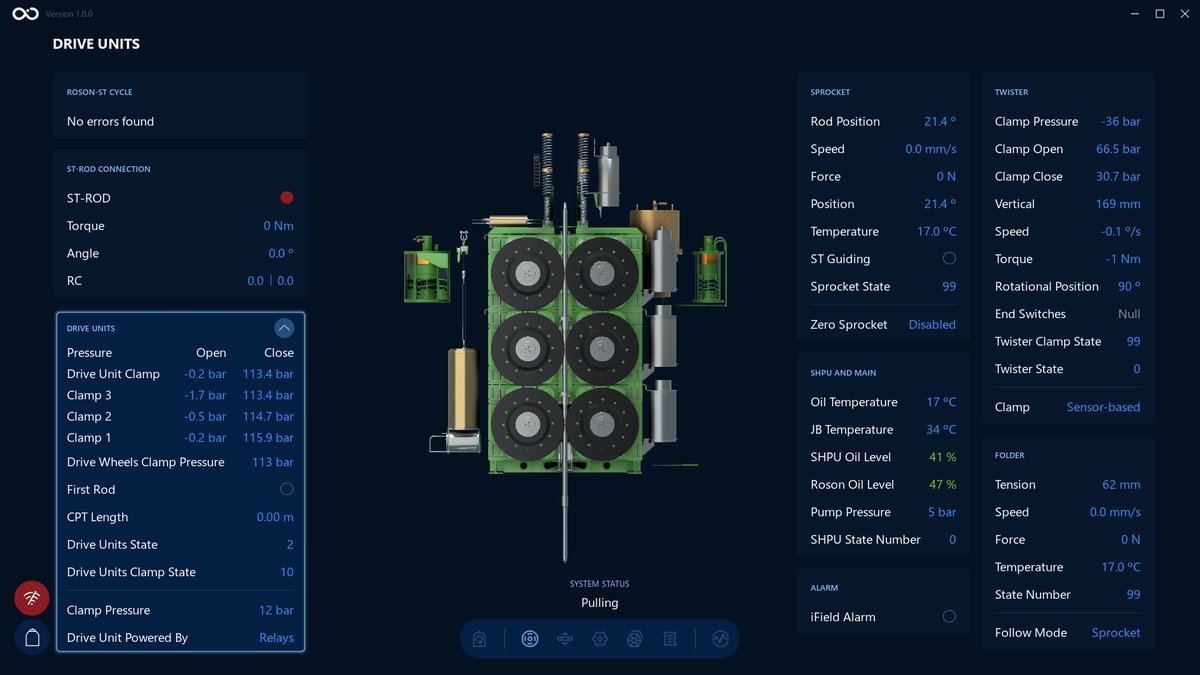
Operator can stop the process by tapping the Controlled Stop button on the bottom right side. The cycle is terminated after the Controlled Stop command executed.
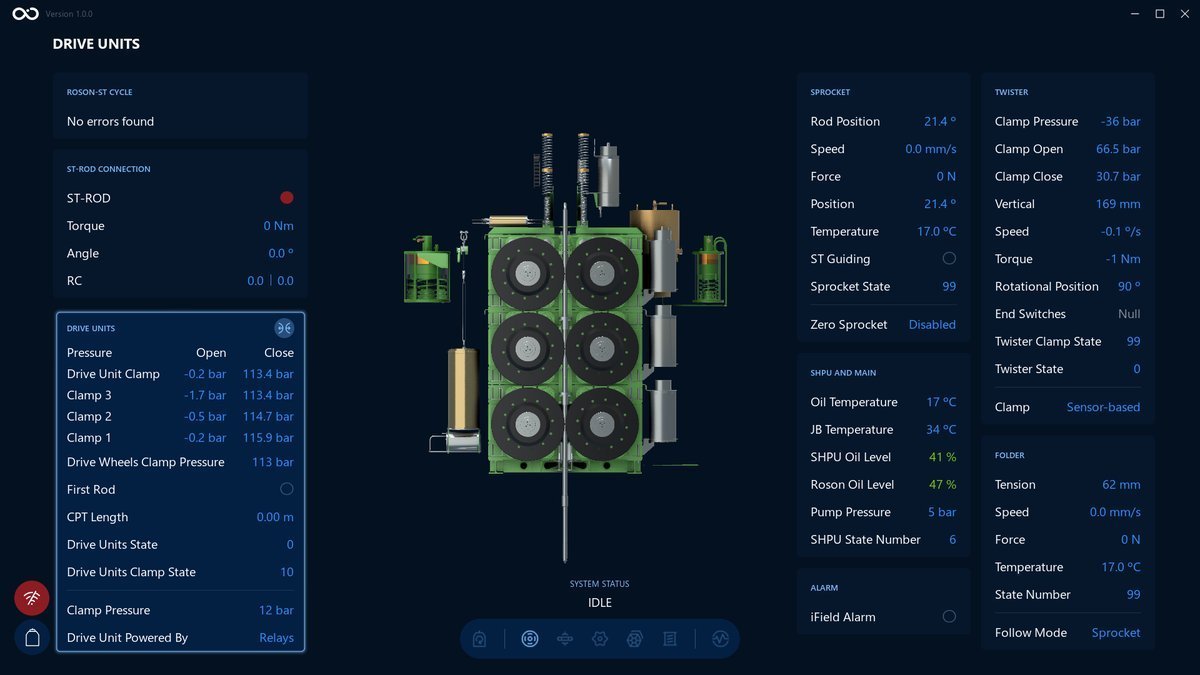
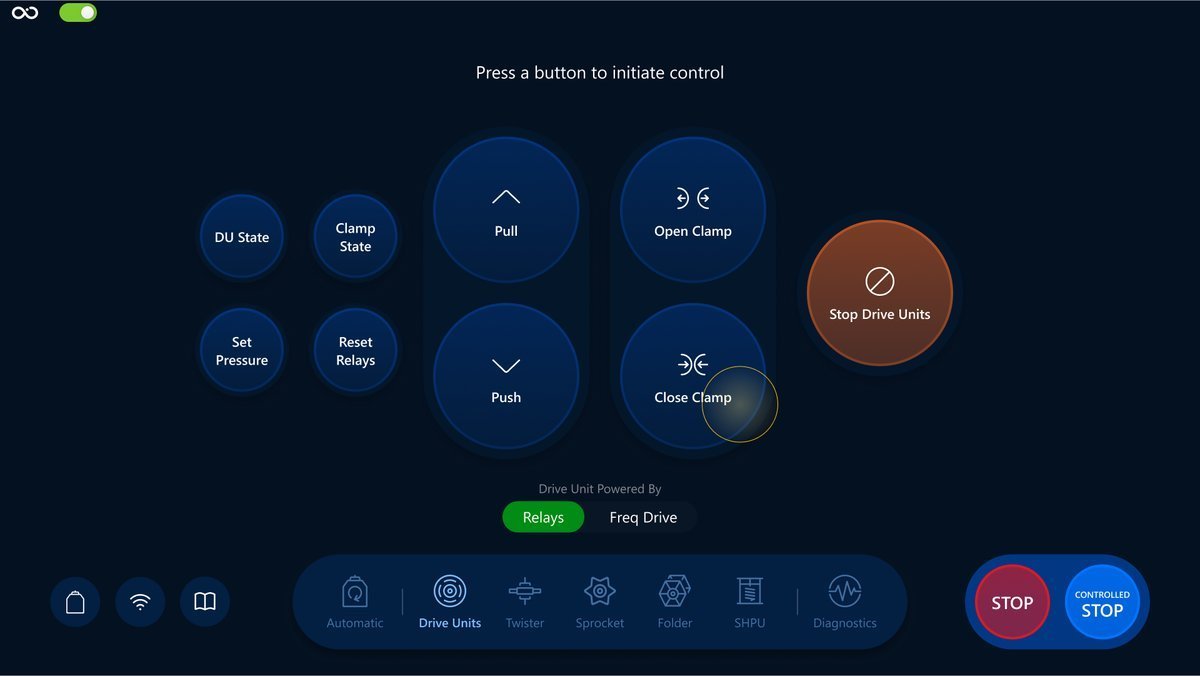
Open and Close Clamp
Are responsible for opening and closing the drive wheels clamp.
The buttons:
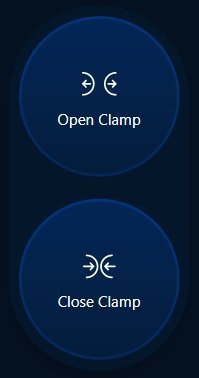
An example of the Visualization screen after Open Clamp button is pressed. We can see the values changed:
Open Clamp:
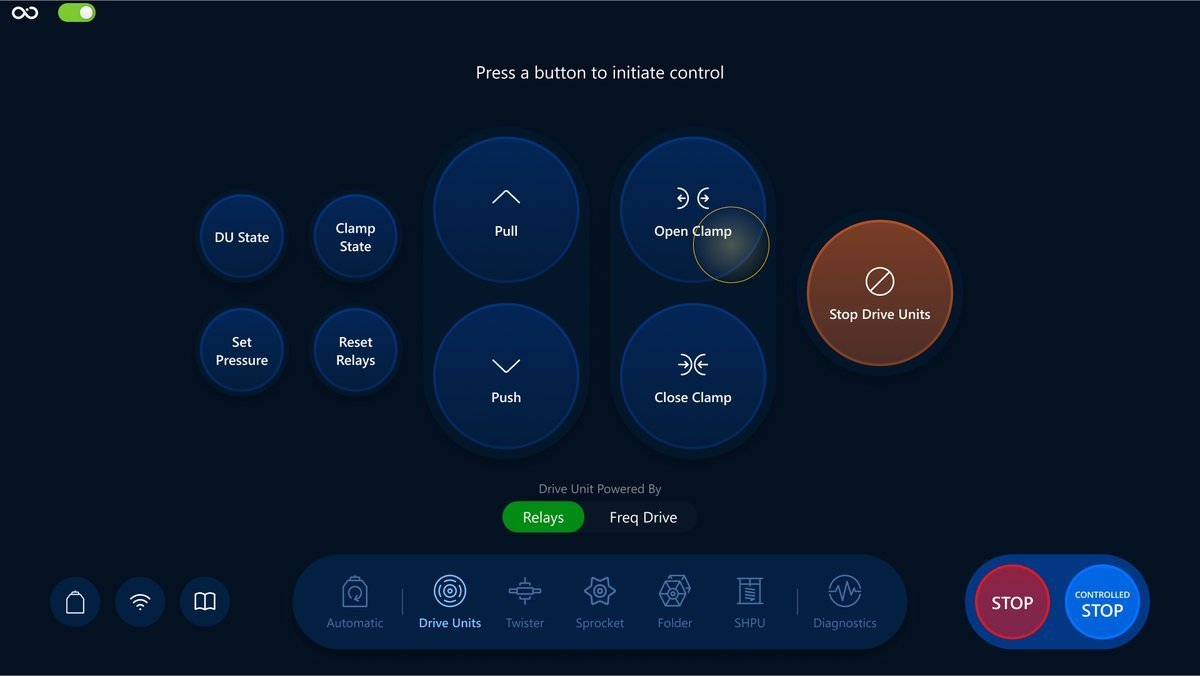
Close Clamp:
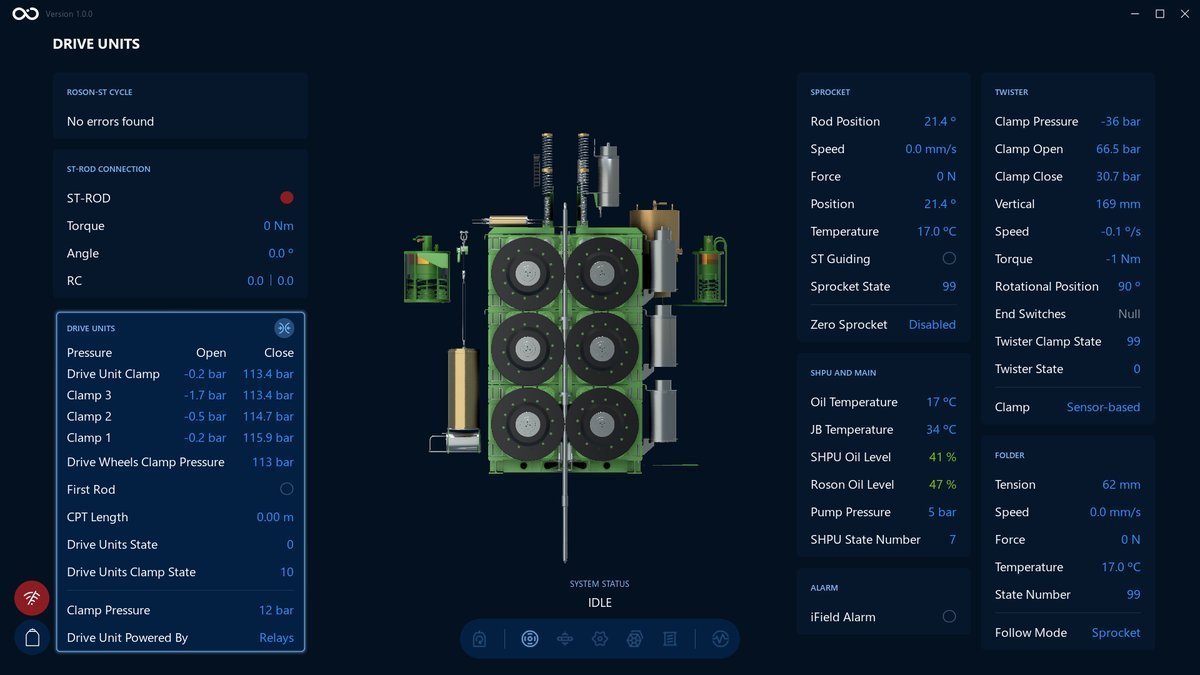
Tap on the Controlled Stop button to stop the process.
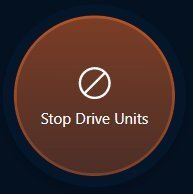
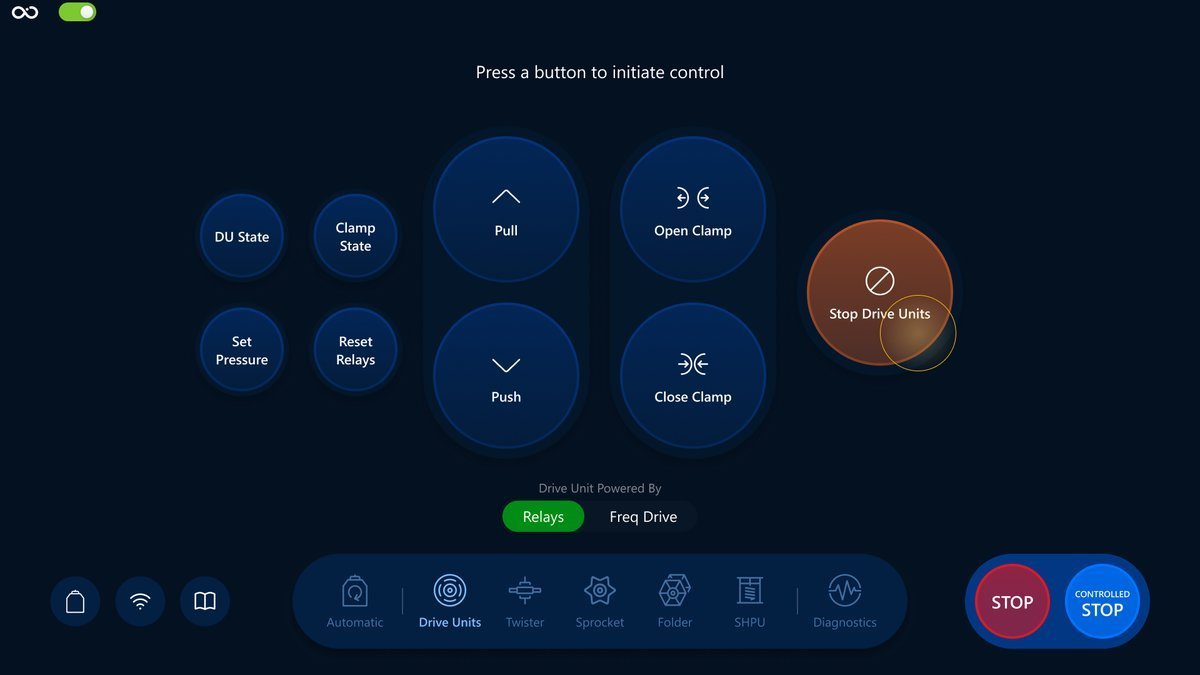
Stop Drive Units
Tap to execute the command for Stop Drive Units.
The button:
An example of the Visualization screen after Stop Drive Units button is pressed. We can see the system status changed. There's no visible difference in the Visualization screen itself when Stop Drive Units is executed, other than the Drive Units no longer pushing/pulling:
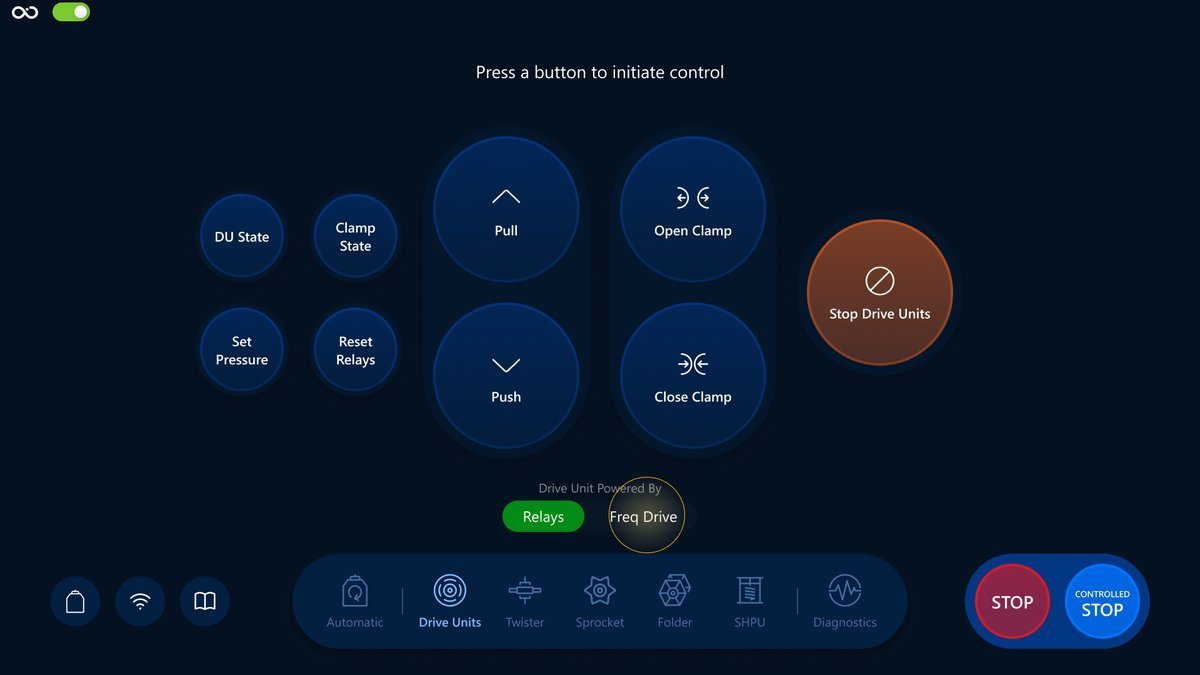
Drive Unit Powered By
Tap to switch between Relays and Freq Drive modes.
The switcher:
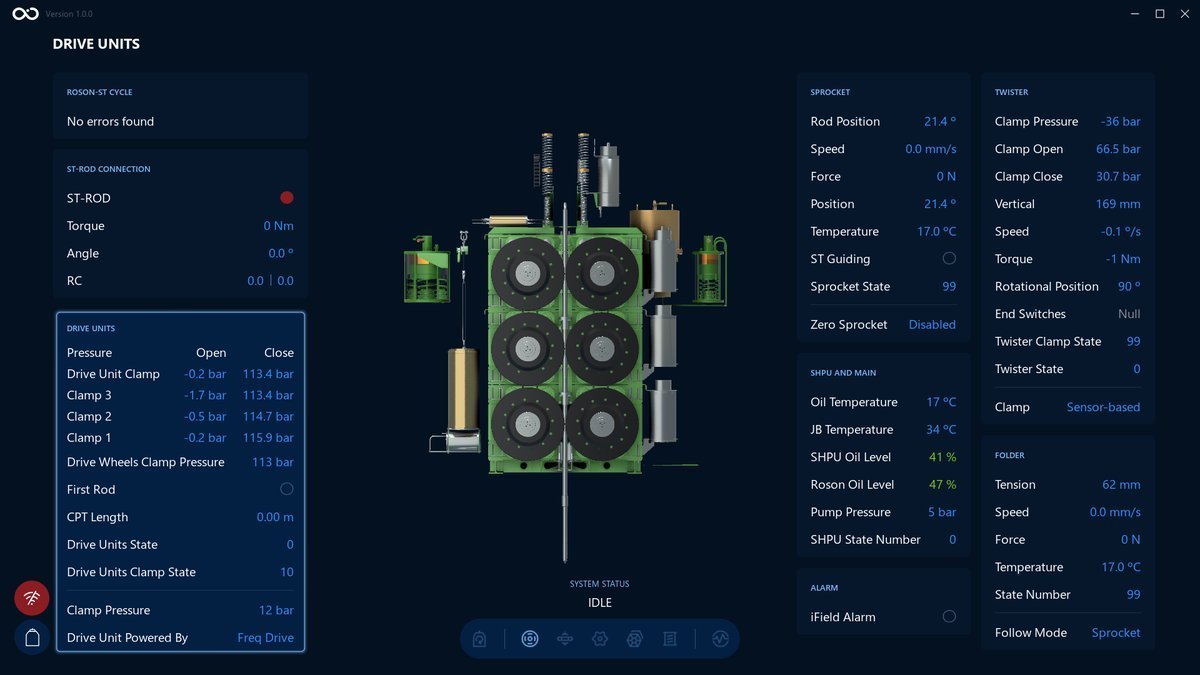
An example of the Visualization screen after Drive Unit Powered By switched to Freq Drive. We can see the Drive Unit Powered By has changed on the bottom left side:
When Drive Unit Powered By switched to Relays, Diagnostics: Drive Units tab is disabled.
What's next?
Feel free to go to the next section and learn the Twister controls in a more detail: Twister overview
Twister
In this section we will have a closer look at how you can use Twister screen to control the system during the CPT operation in Manual Mode.
Navigation
Choose the Twister icon in the navigation bar for navigation:
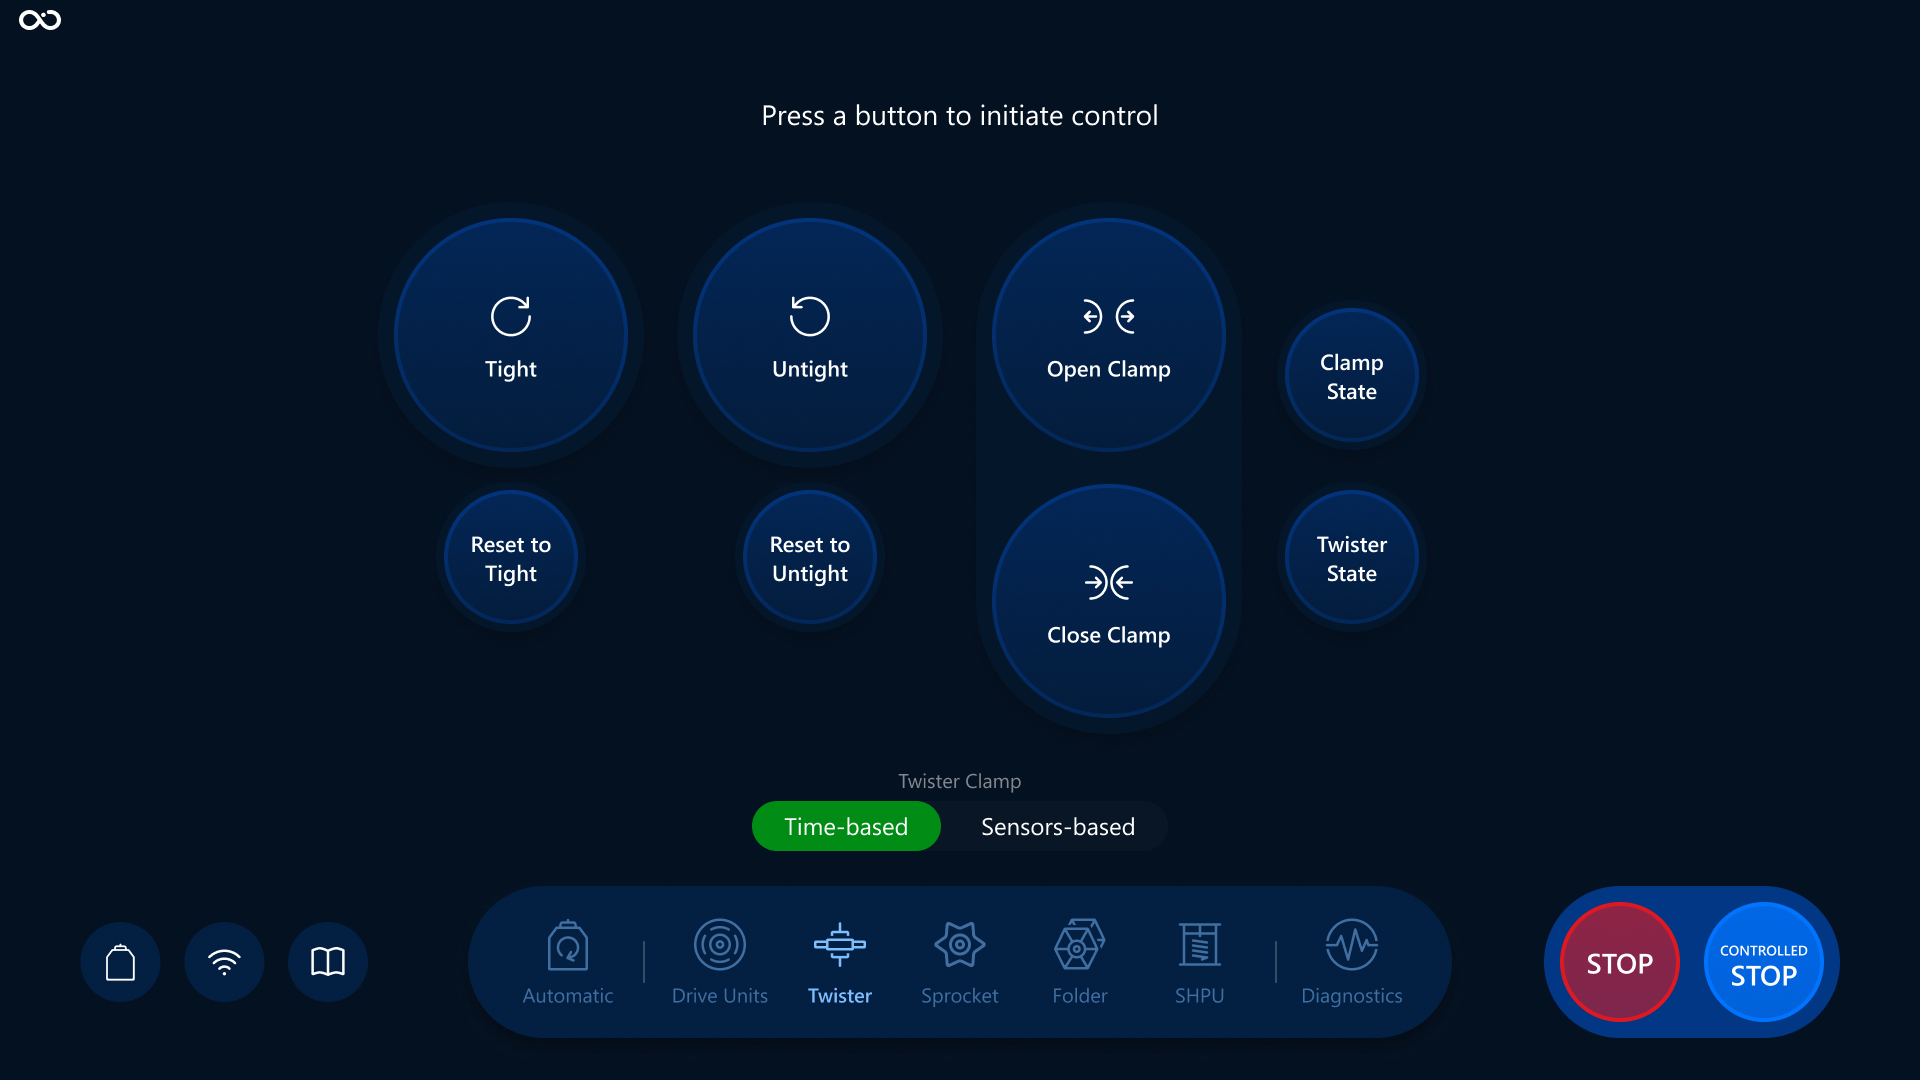
Controls
We will have a look at a brief description of the controls, their responsibilities and also how it reflects on the Visualization screen.
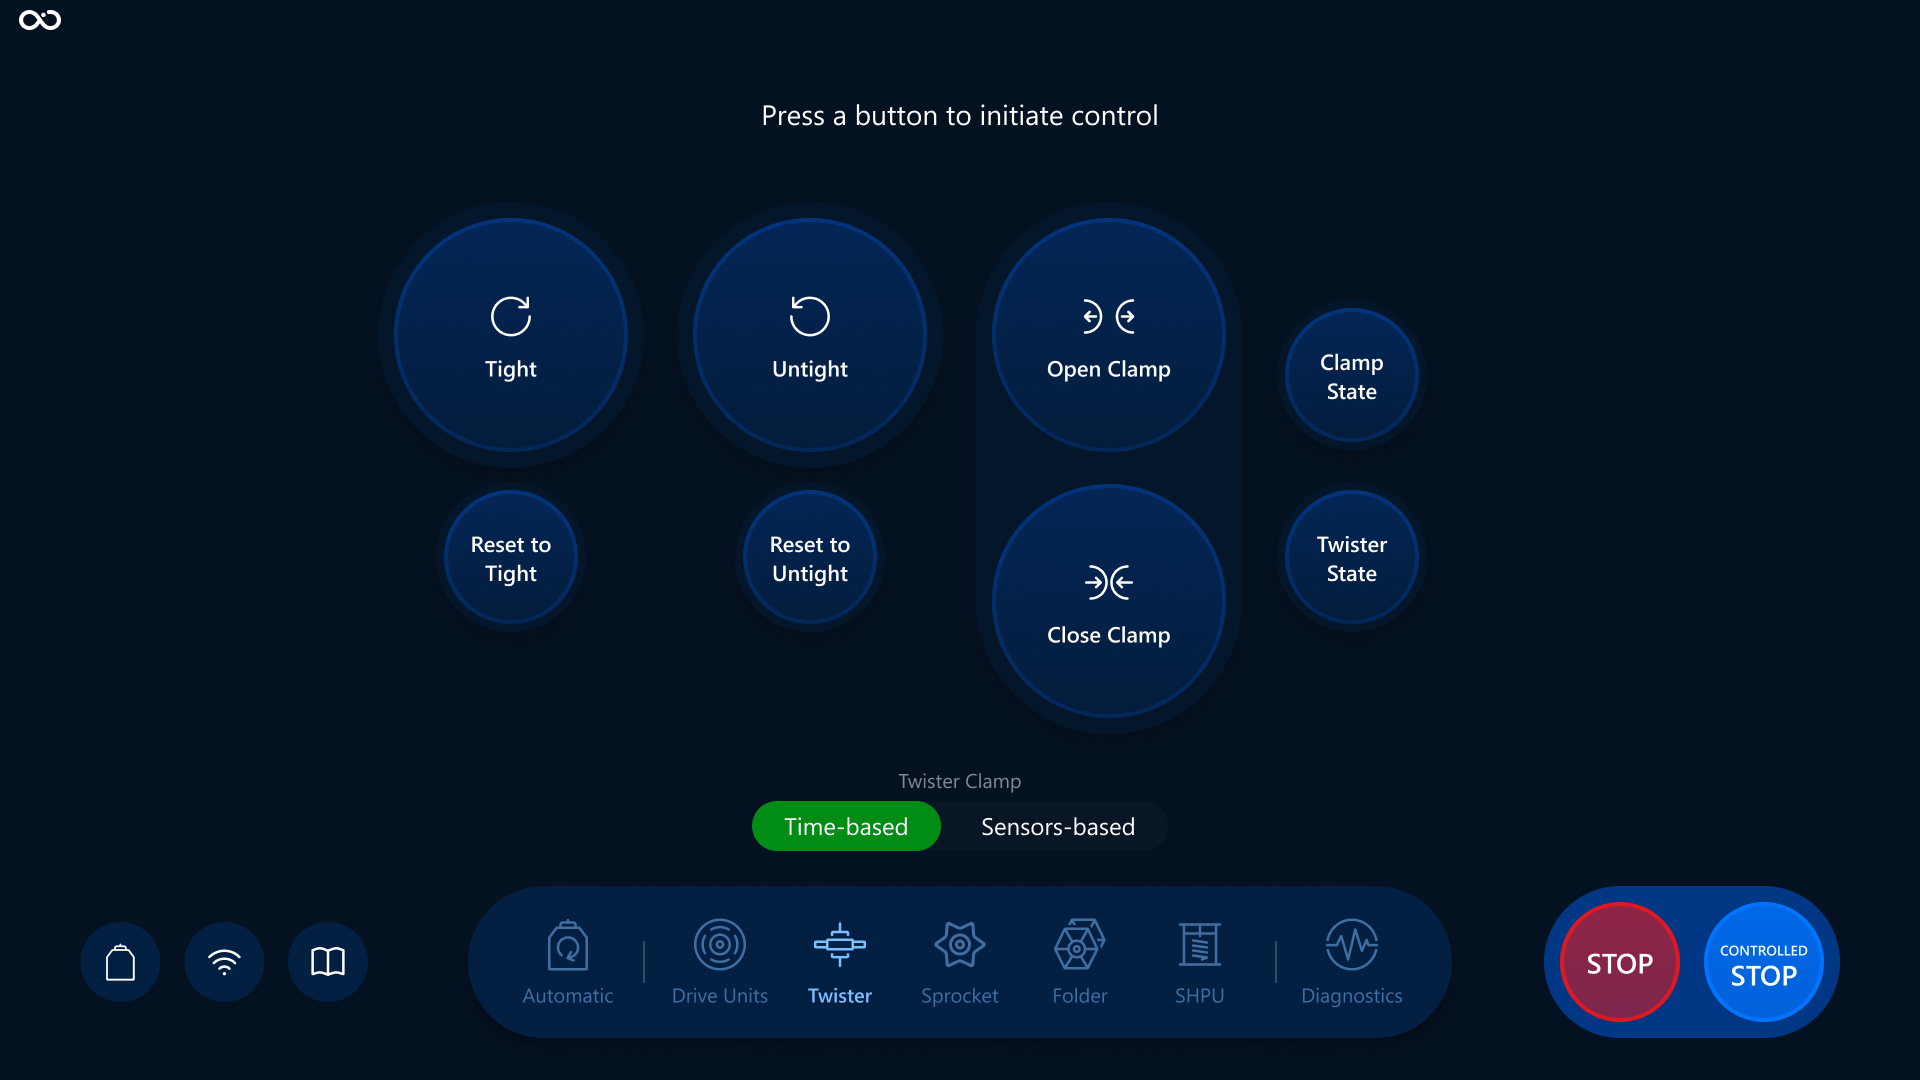
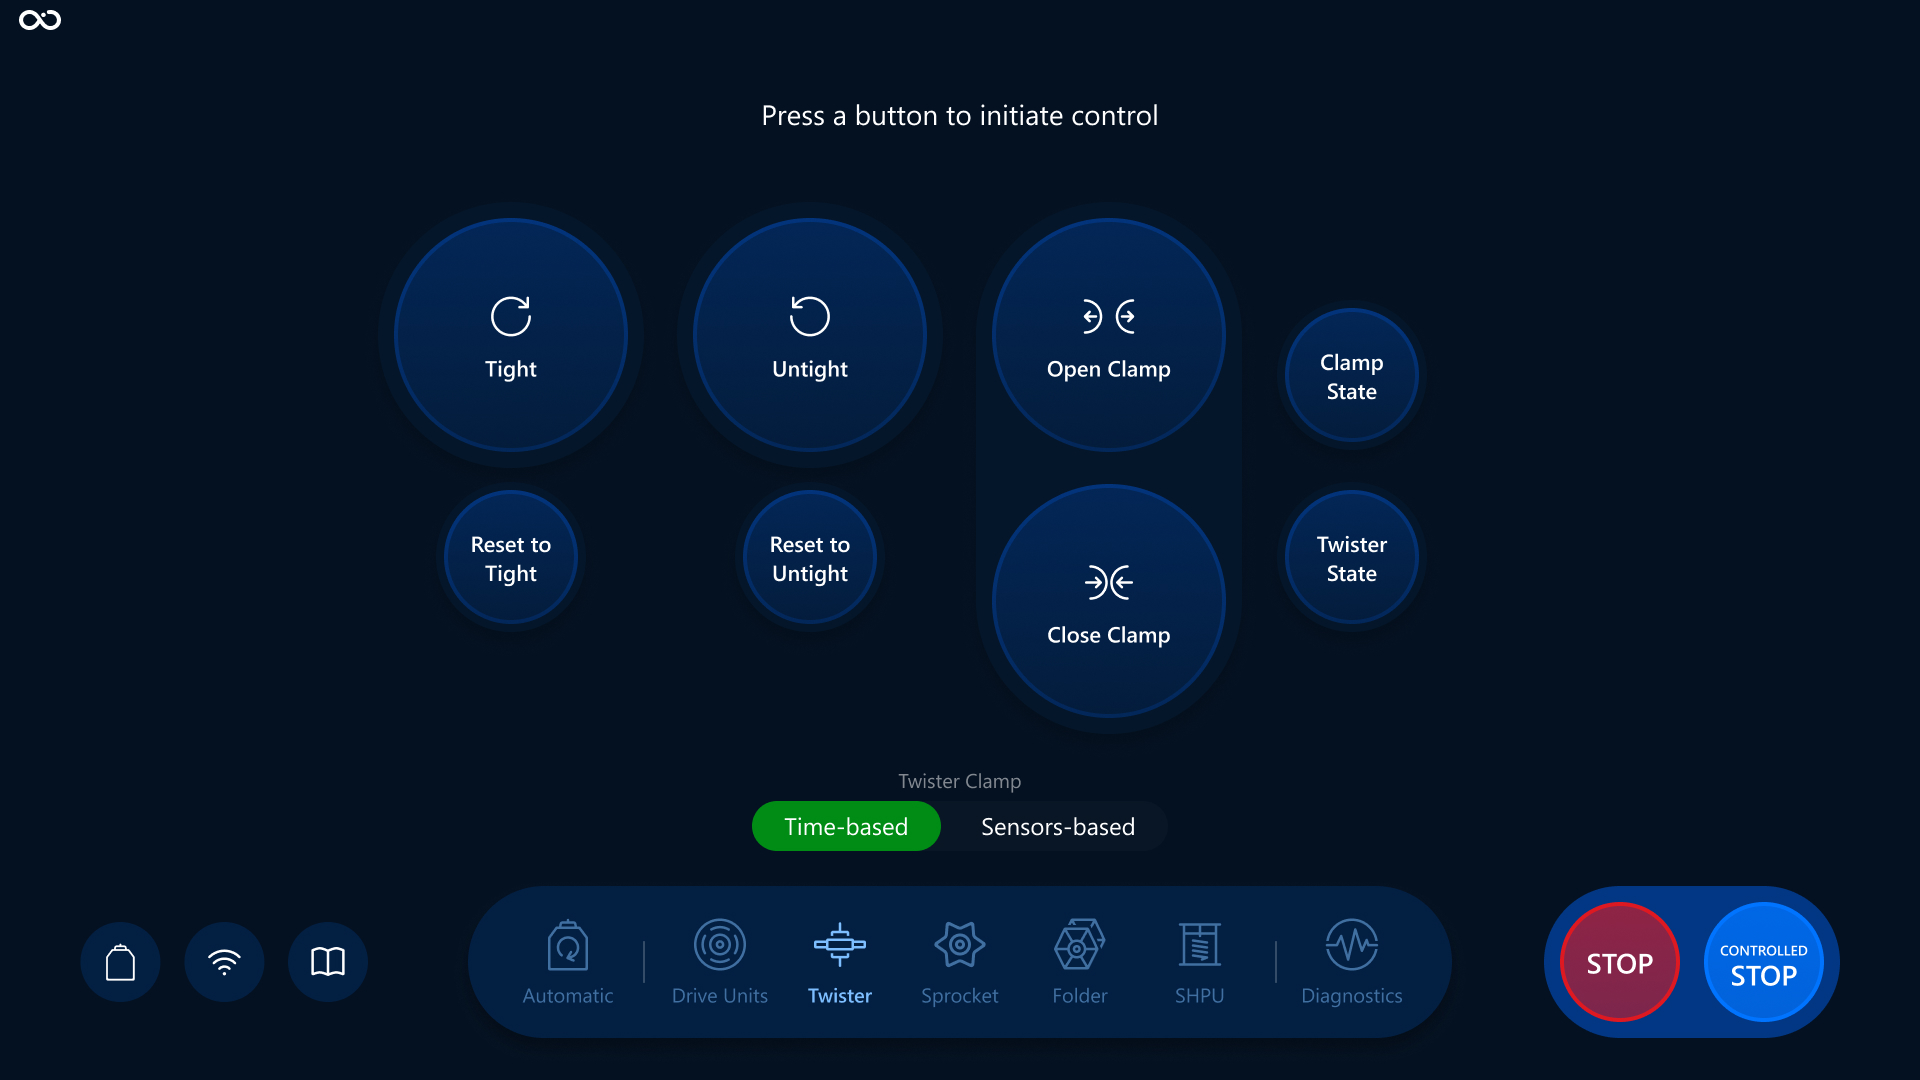
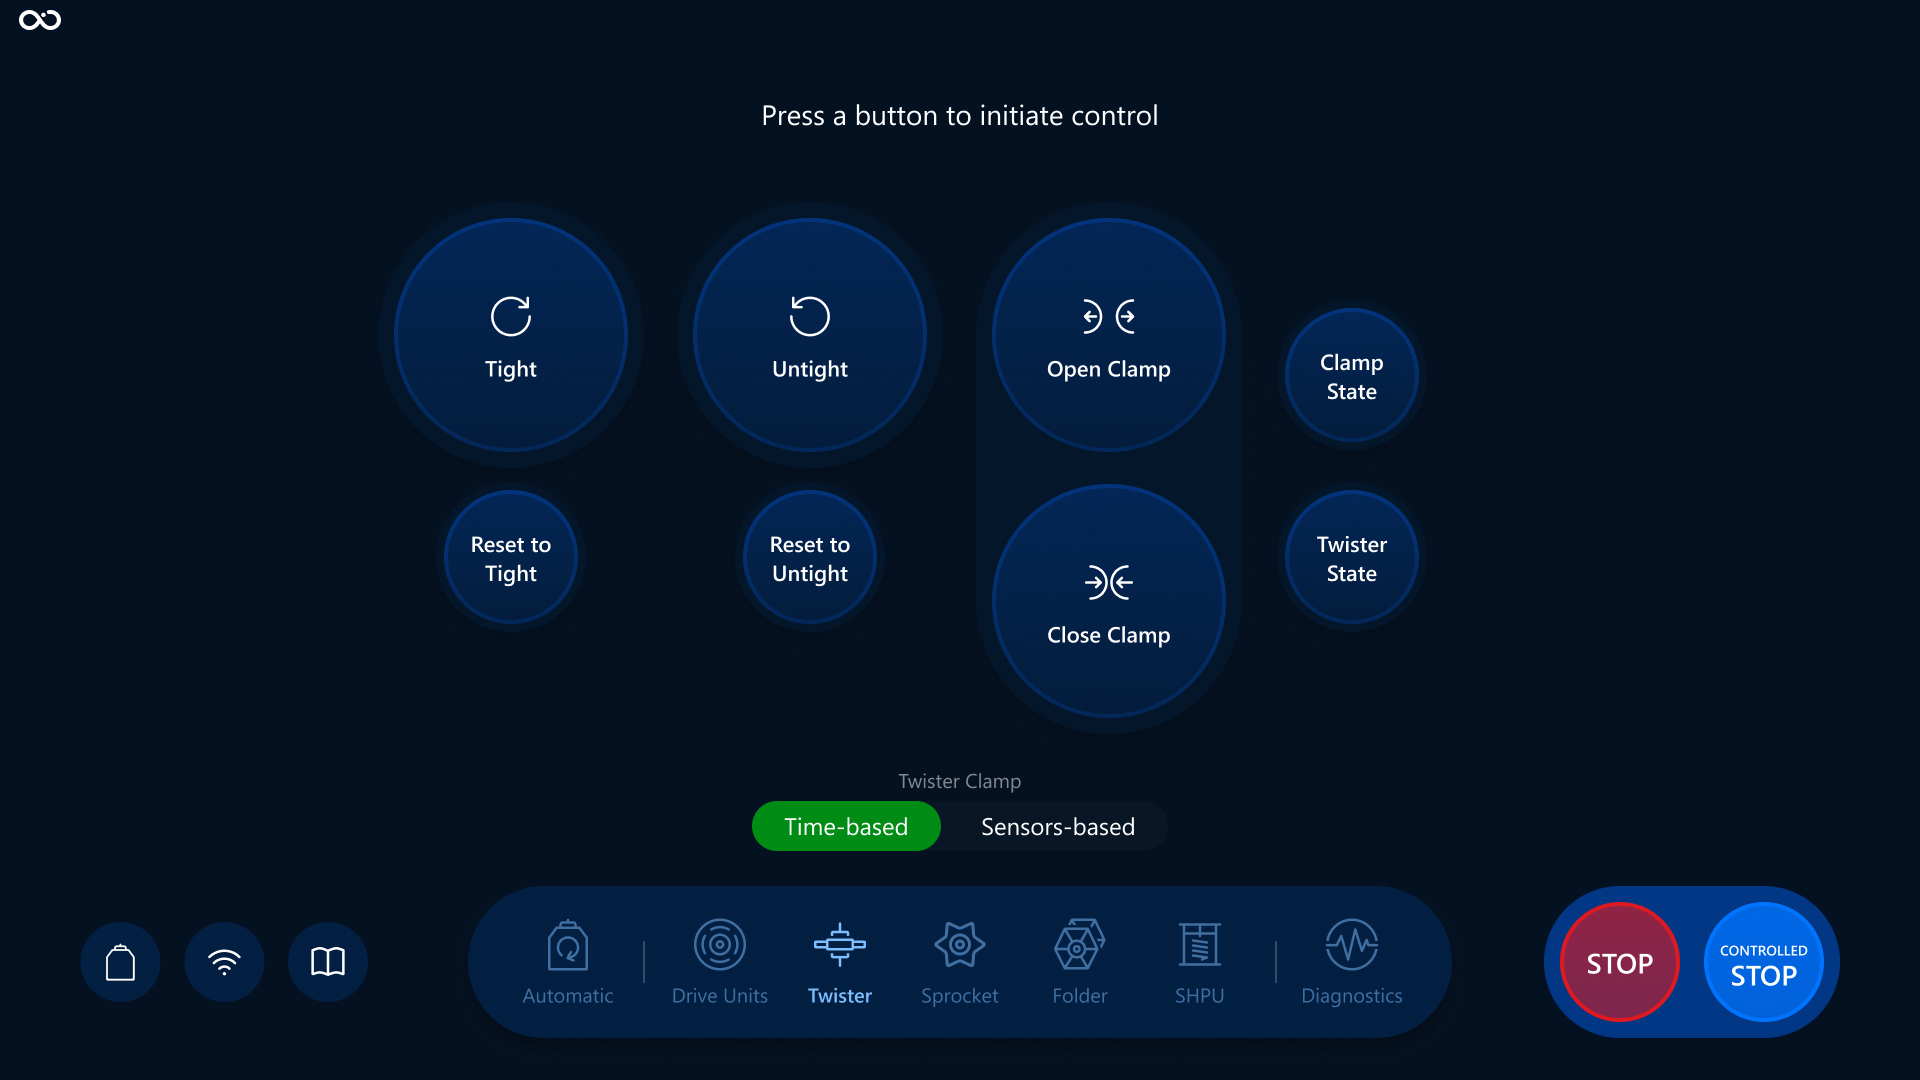
Tight and Reset To Tight
Tight is responsible: tight ST Rod CW.
Reset To Tight is responsible: moving the twister to reset position tight.
The buttons:
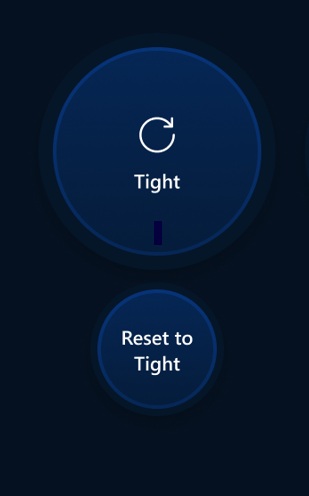
Visualization screen after Tight button is pressed. We can see the values changed:
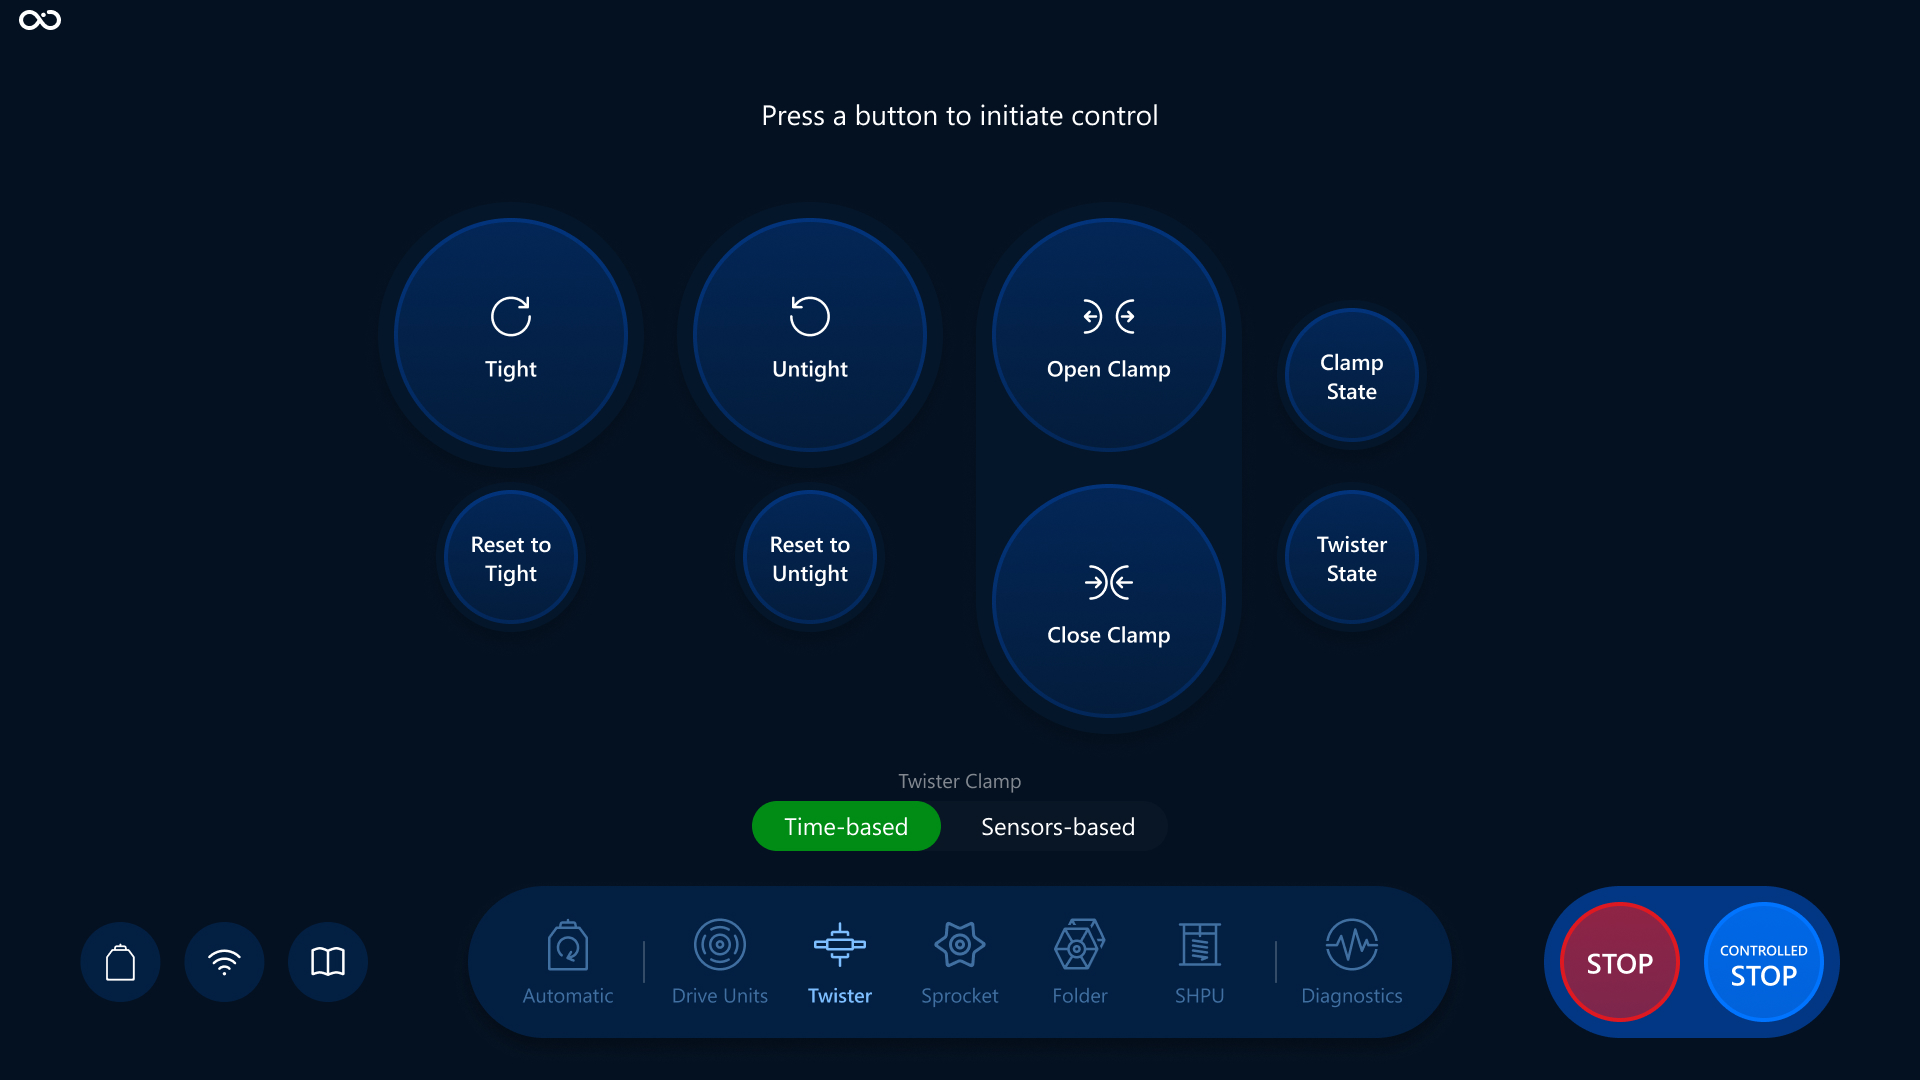
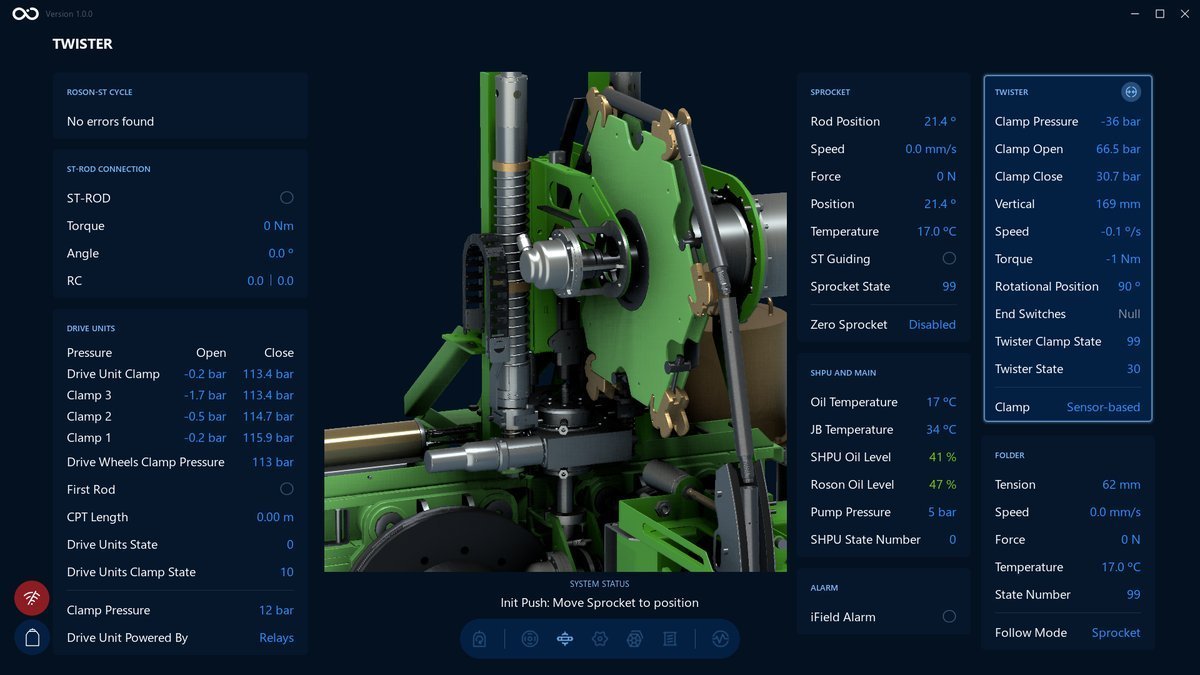
Visualization screen after Reset To Tight button is pressed. We can see the values changed:
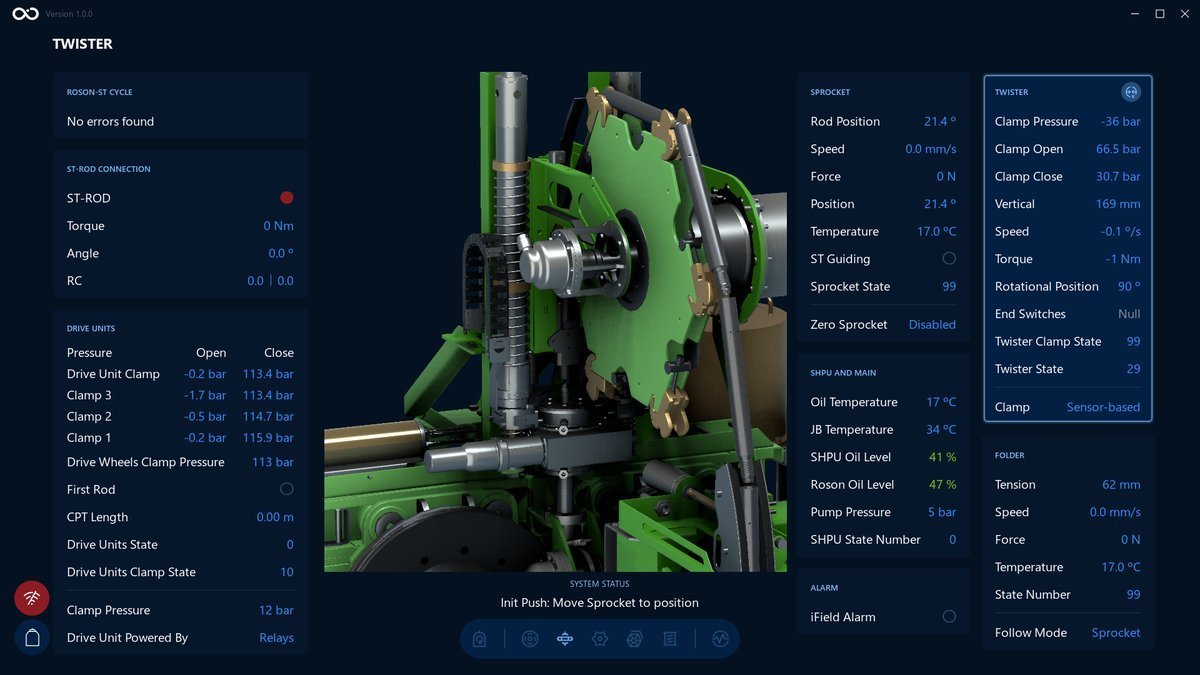
Tap on the Controlled Stop button to stop the process.
Untight and Reset To Untight
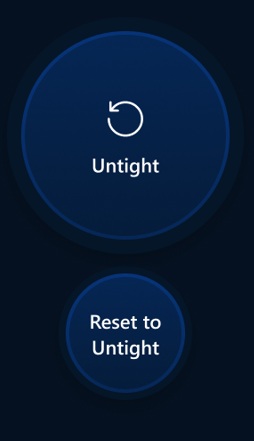
Untight is responsible: untight ST Rod CCW.
Reset To Untight is responsible: moving the twister to reset position untight.
The buttons:
Visualization screen after Untight button is pressed. We can see the values changed:
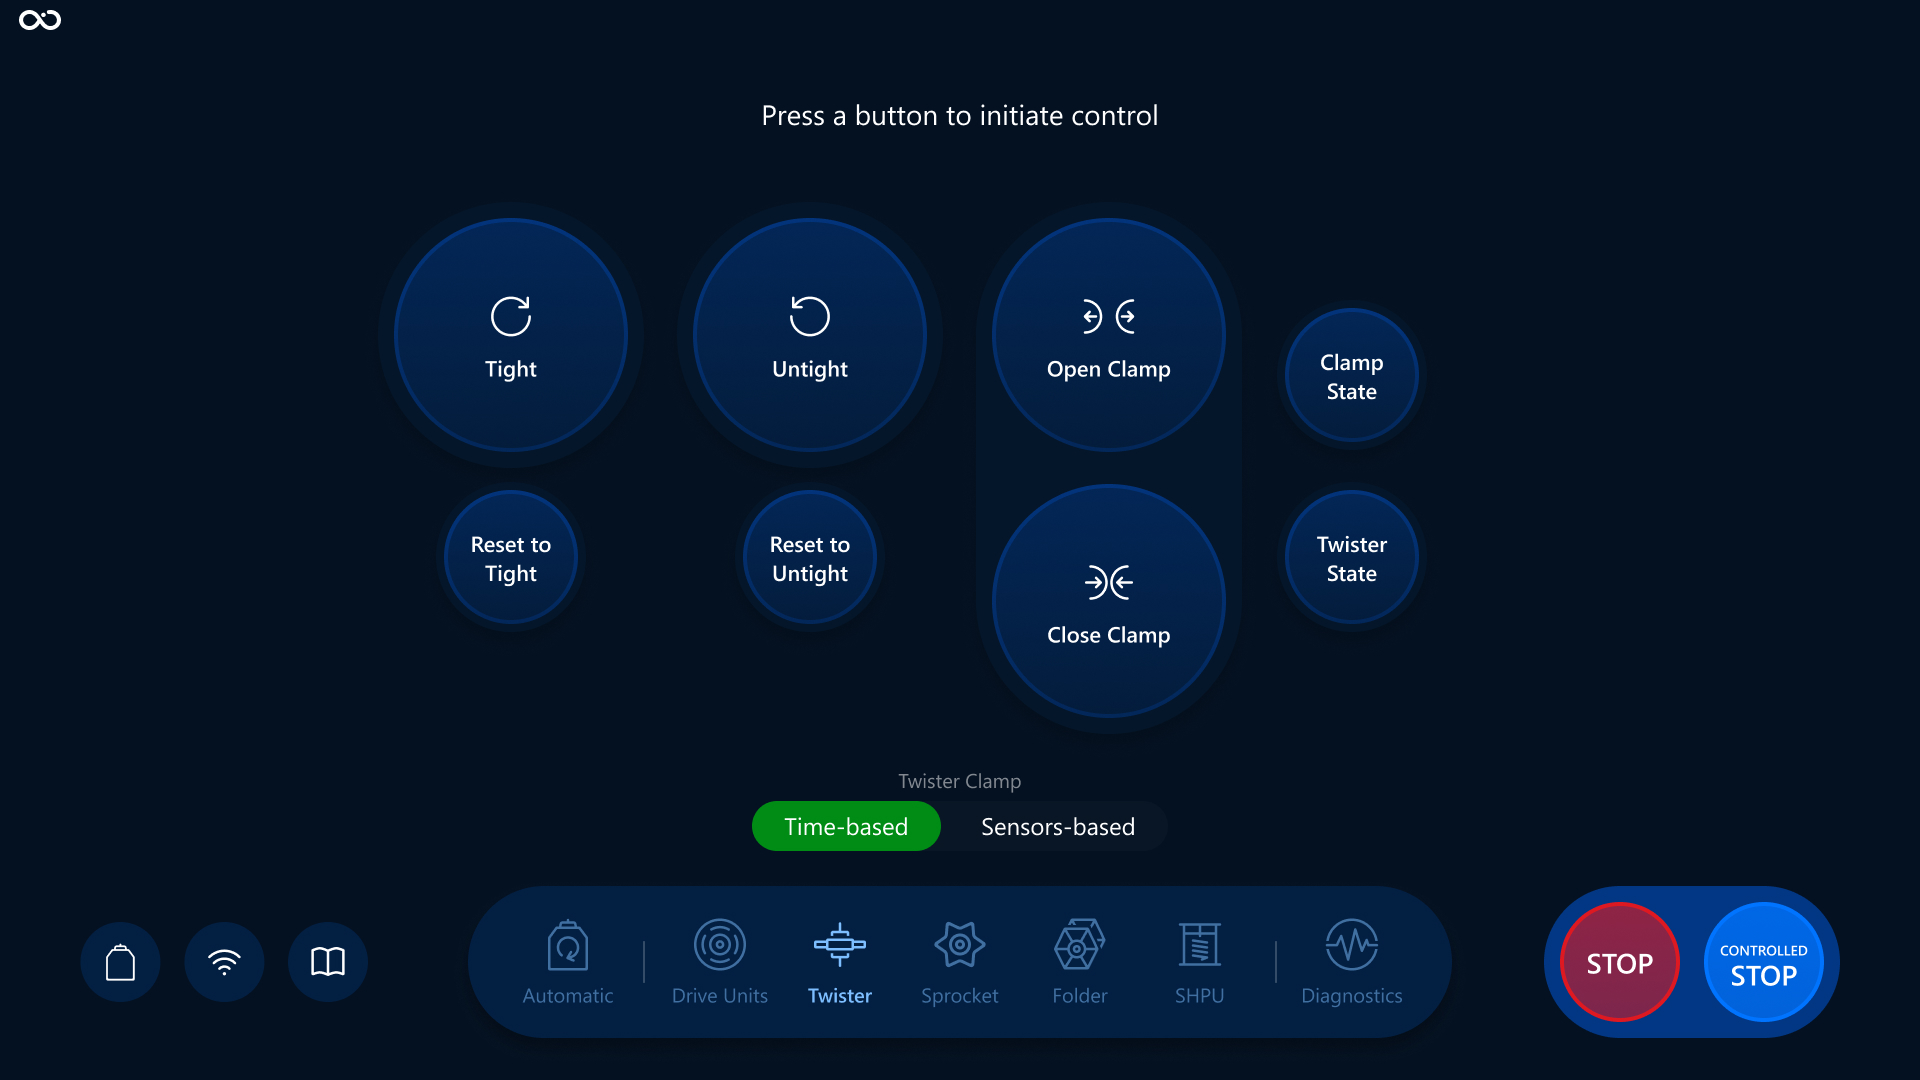
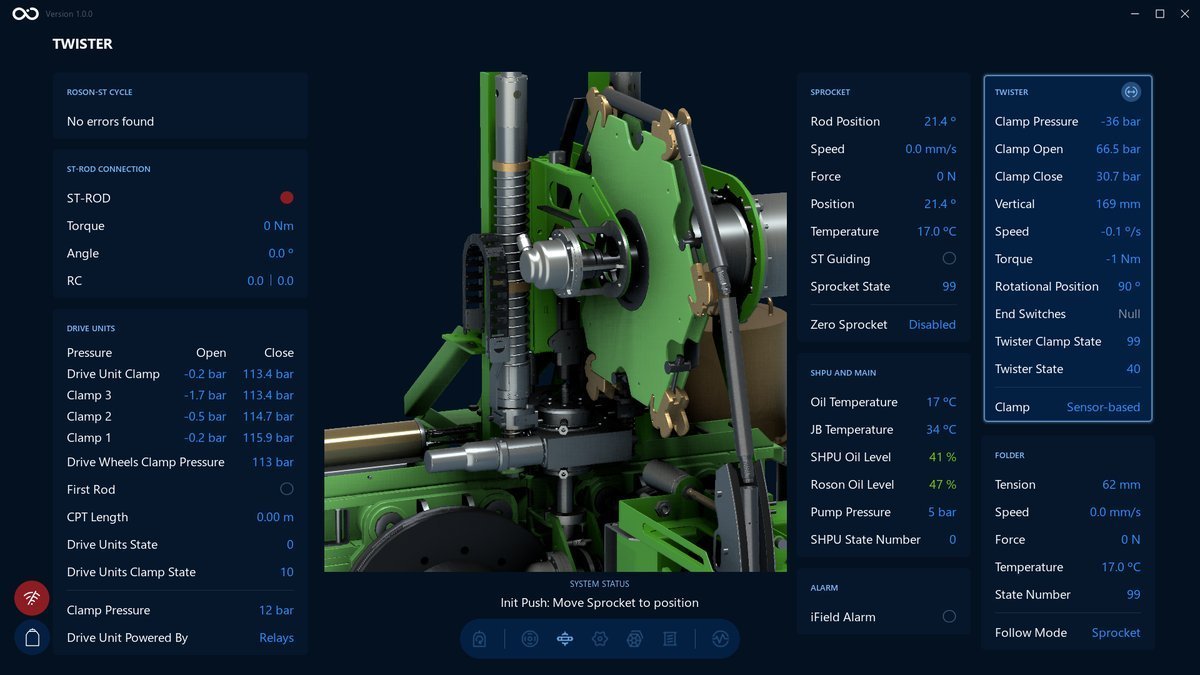
Visualization screen after Reset To Untight button is pressed. We can see the values changed:
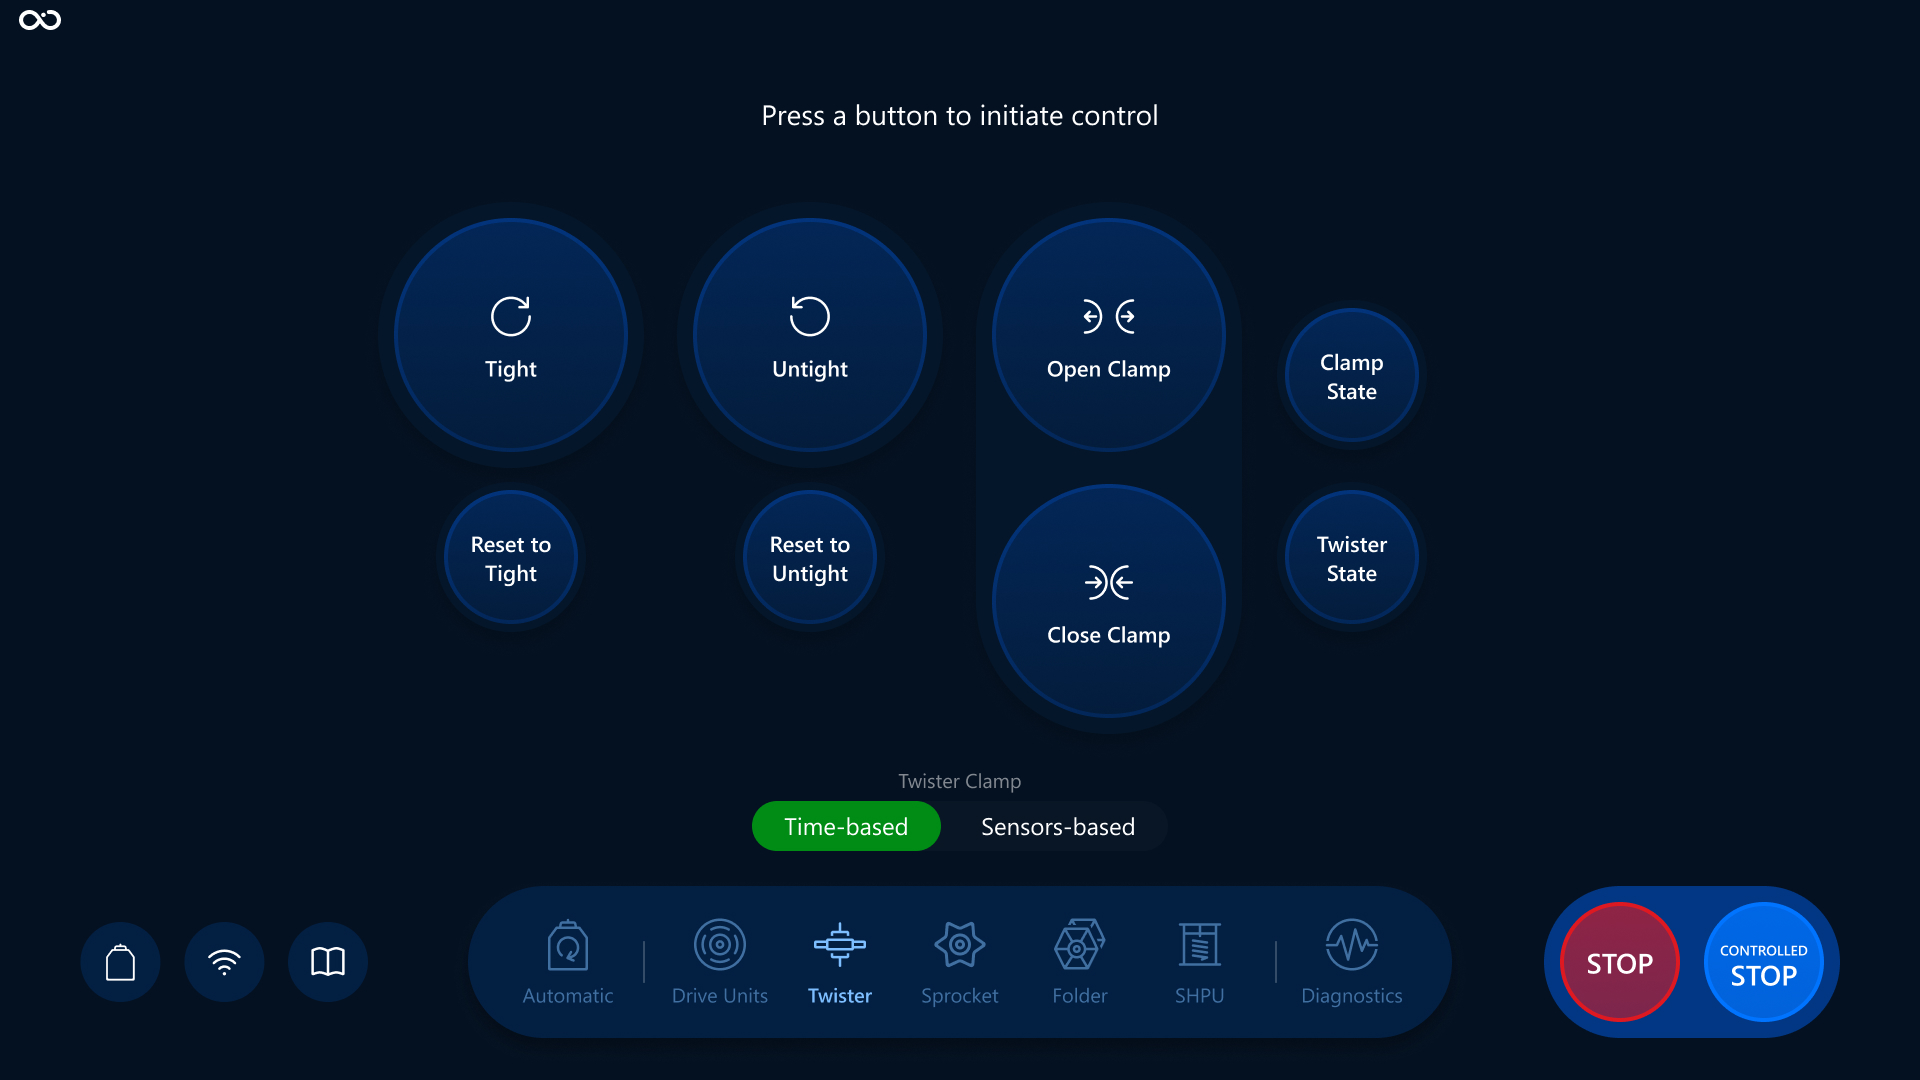
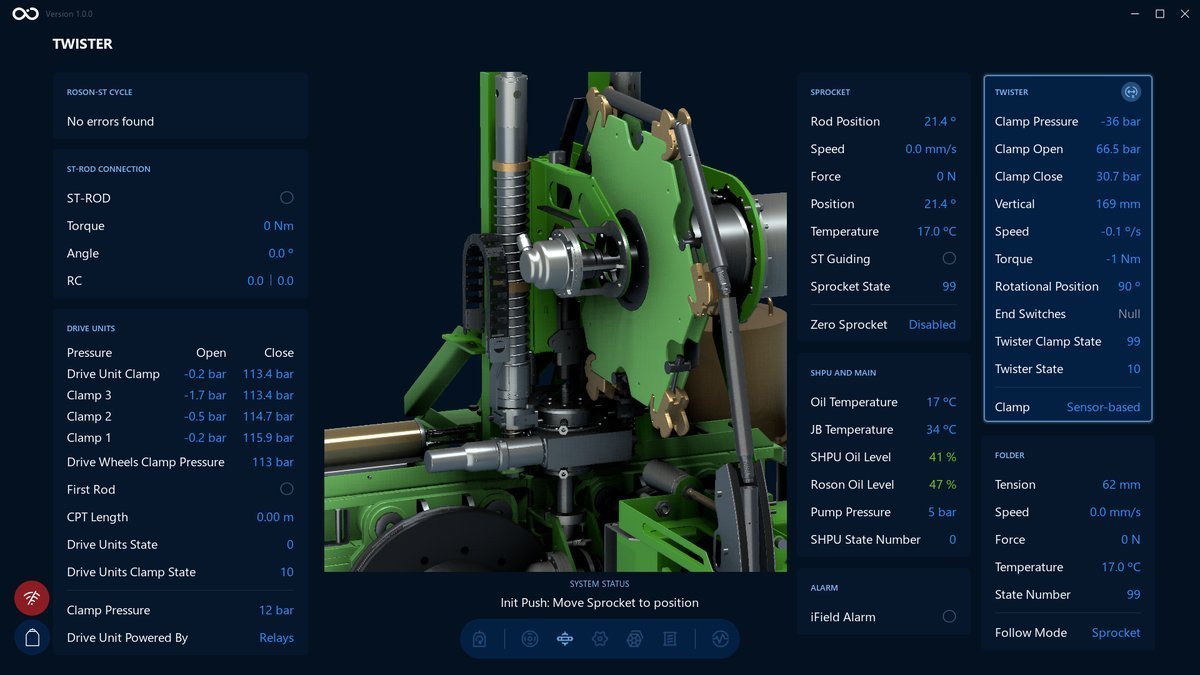
Tap on the Controlled Stop button to stop the process.
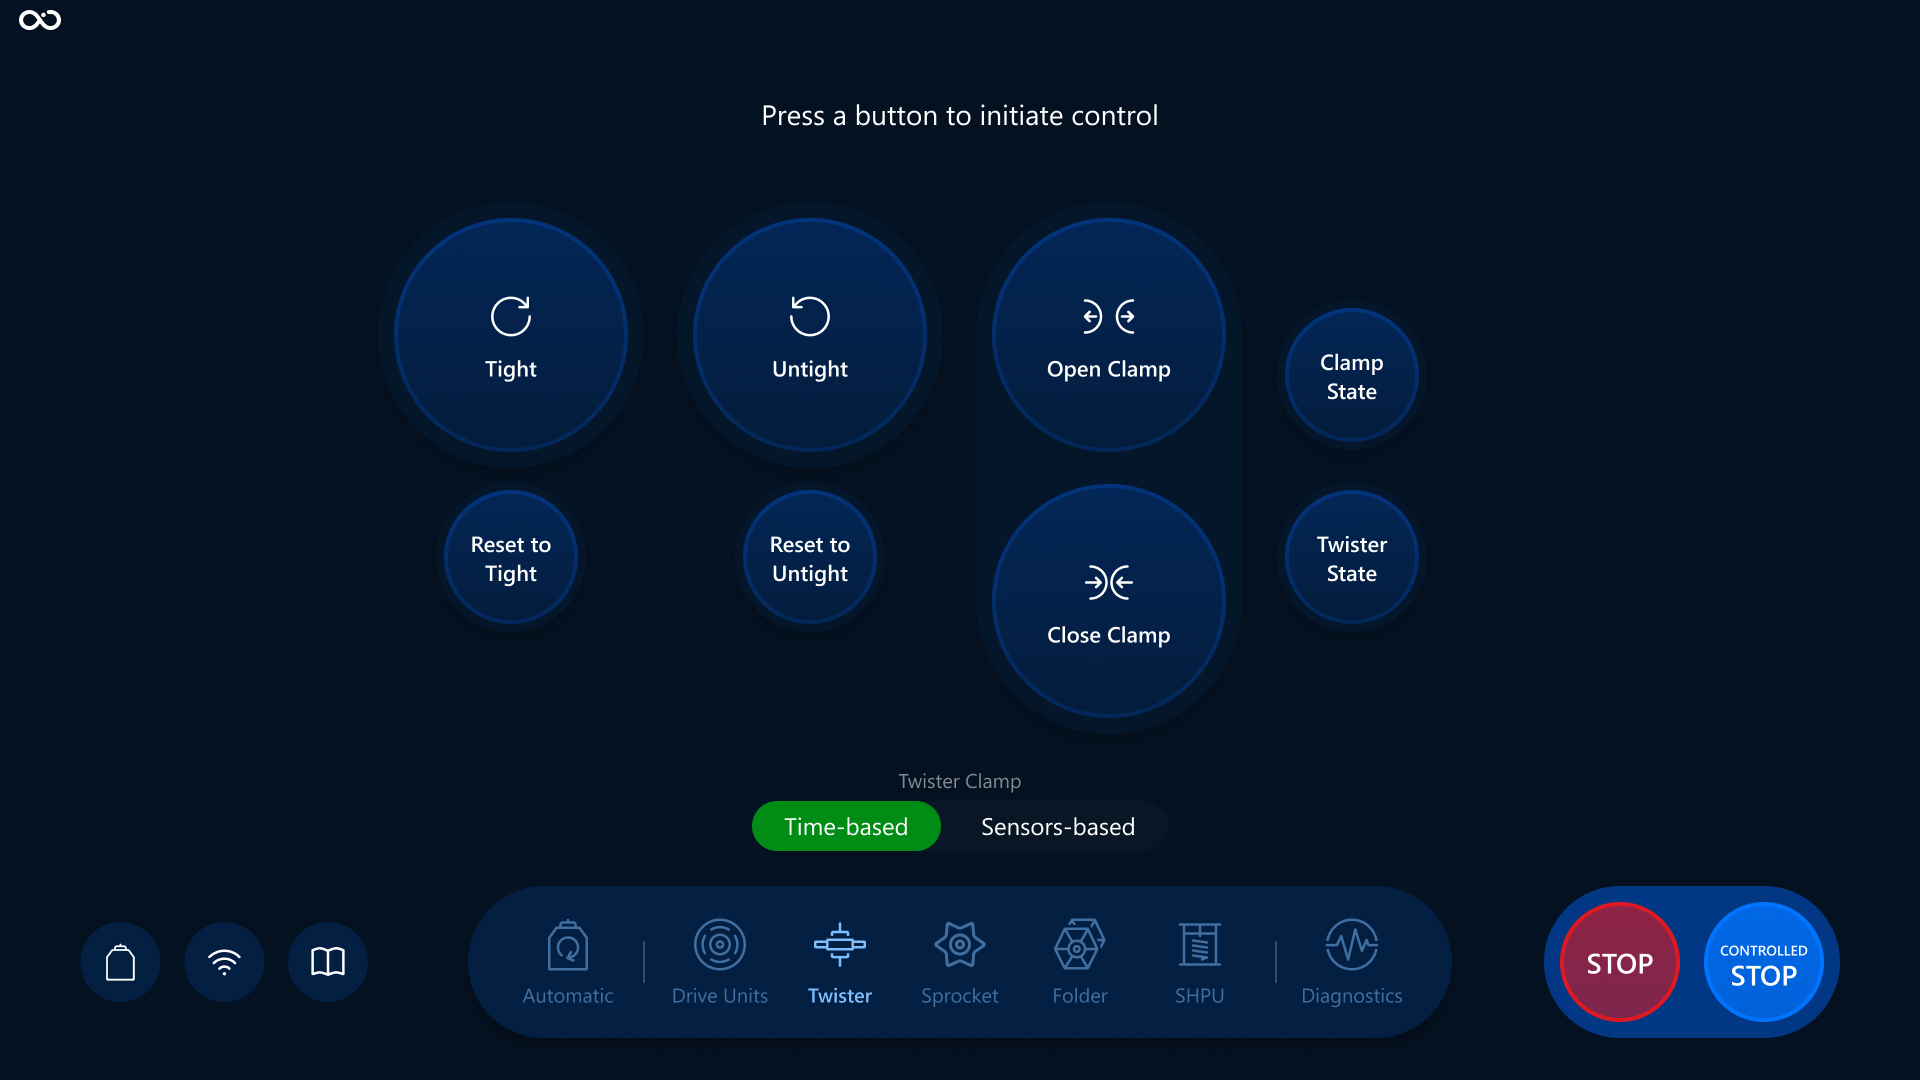
Open Clamp and Close Clamp
Is responsible for opening and closing the twister clamp.
The buttons:
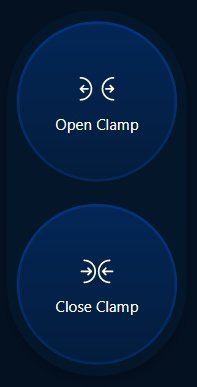
Visualization screen after Open button is pressed. We can see the values changed:
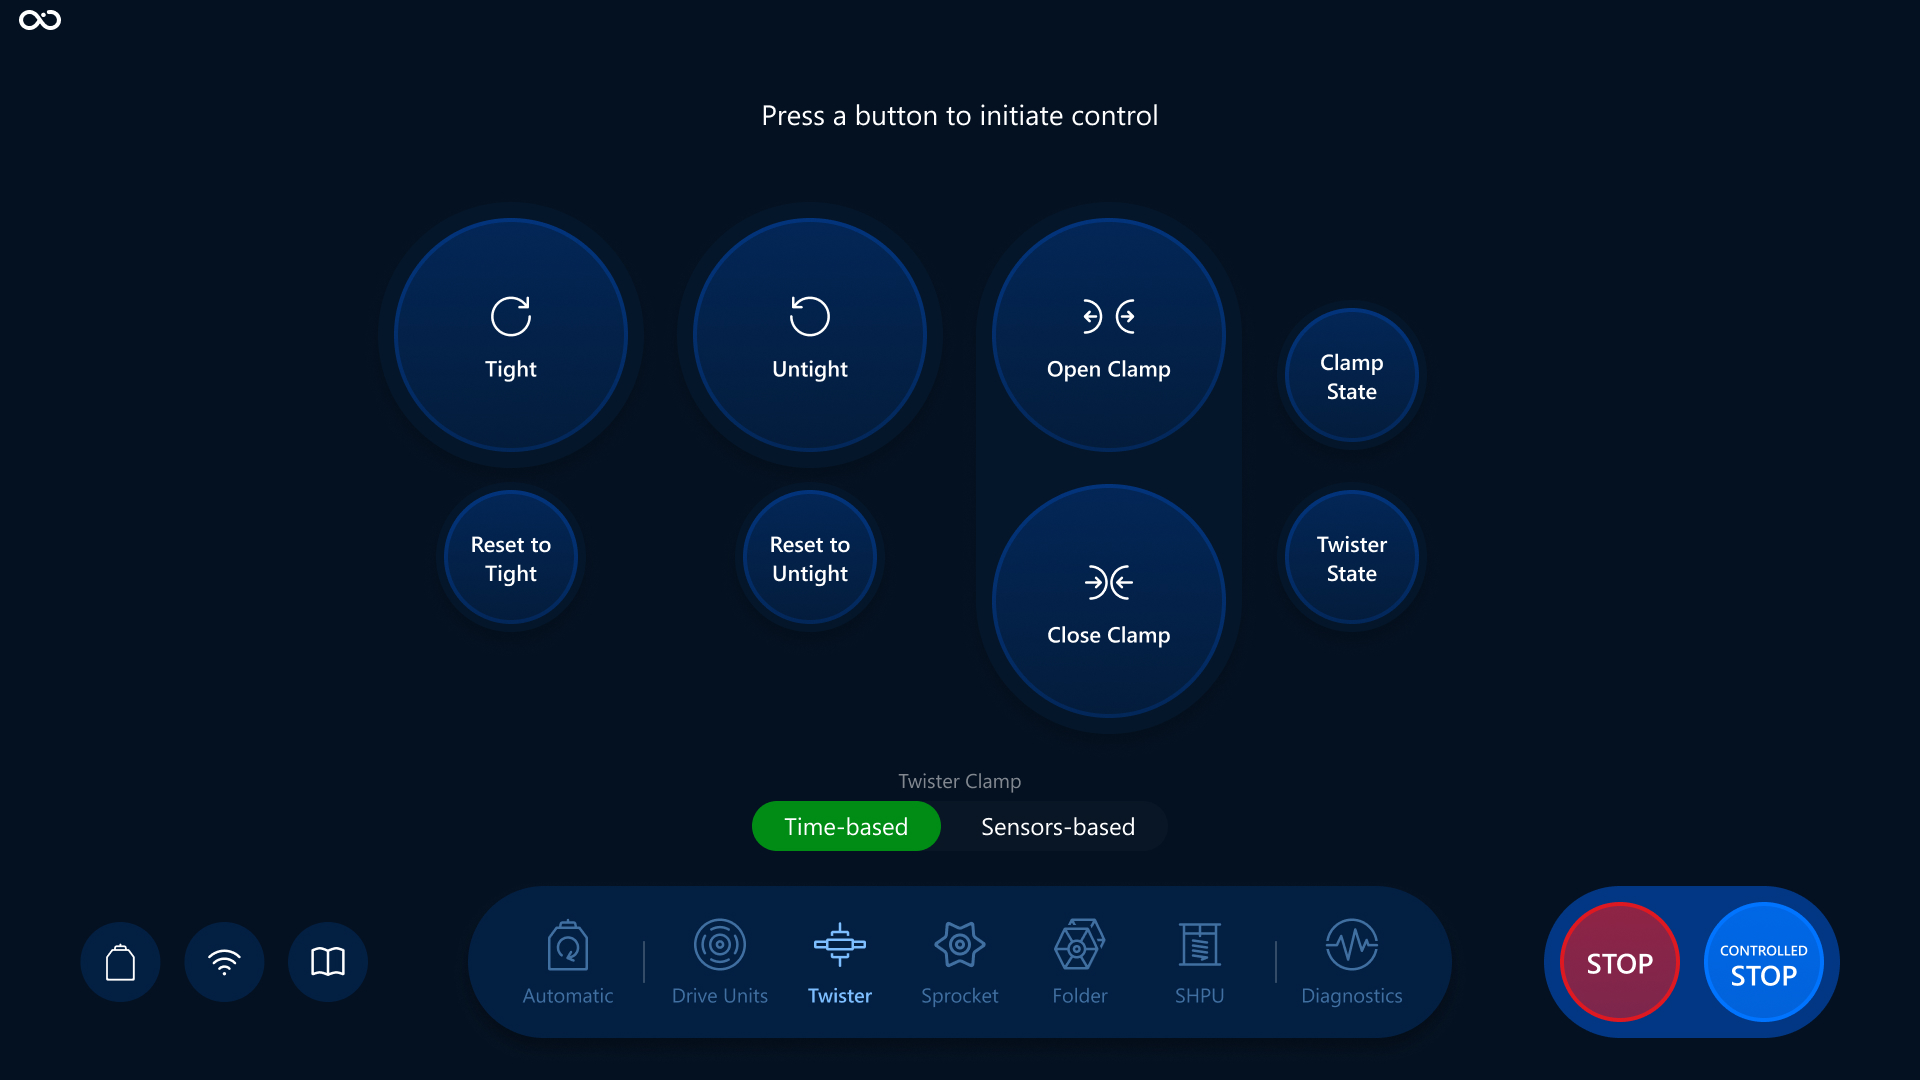
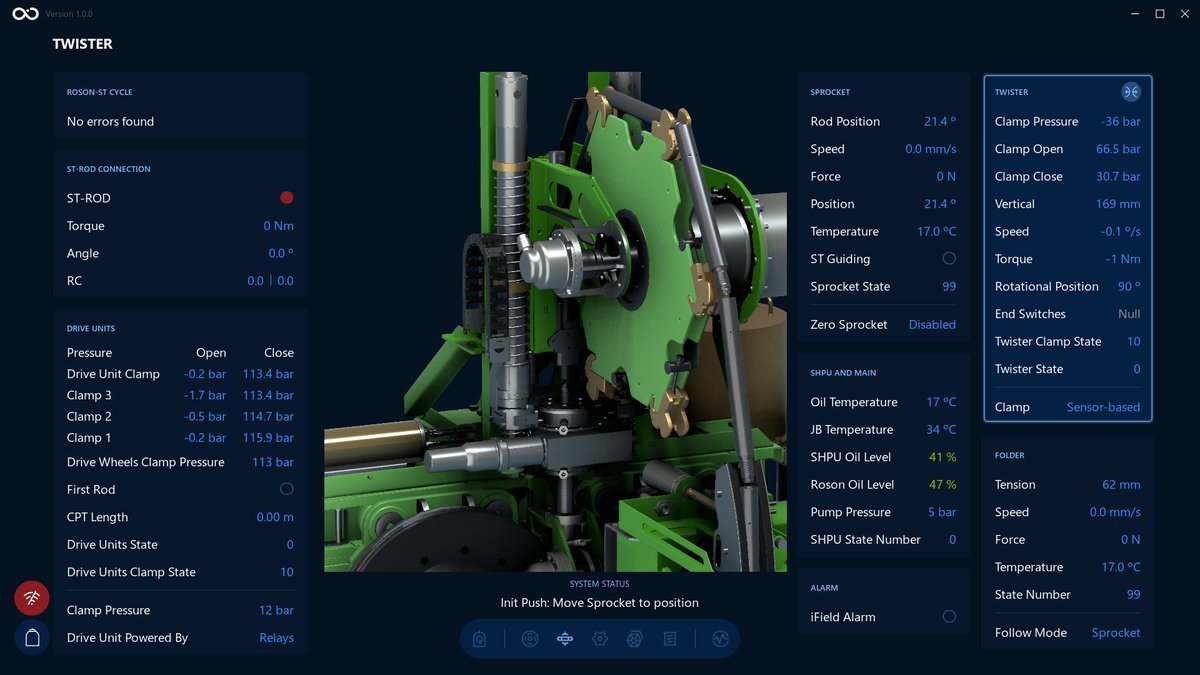
Visualization screen after Close button is pressed. We can see the values changed:
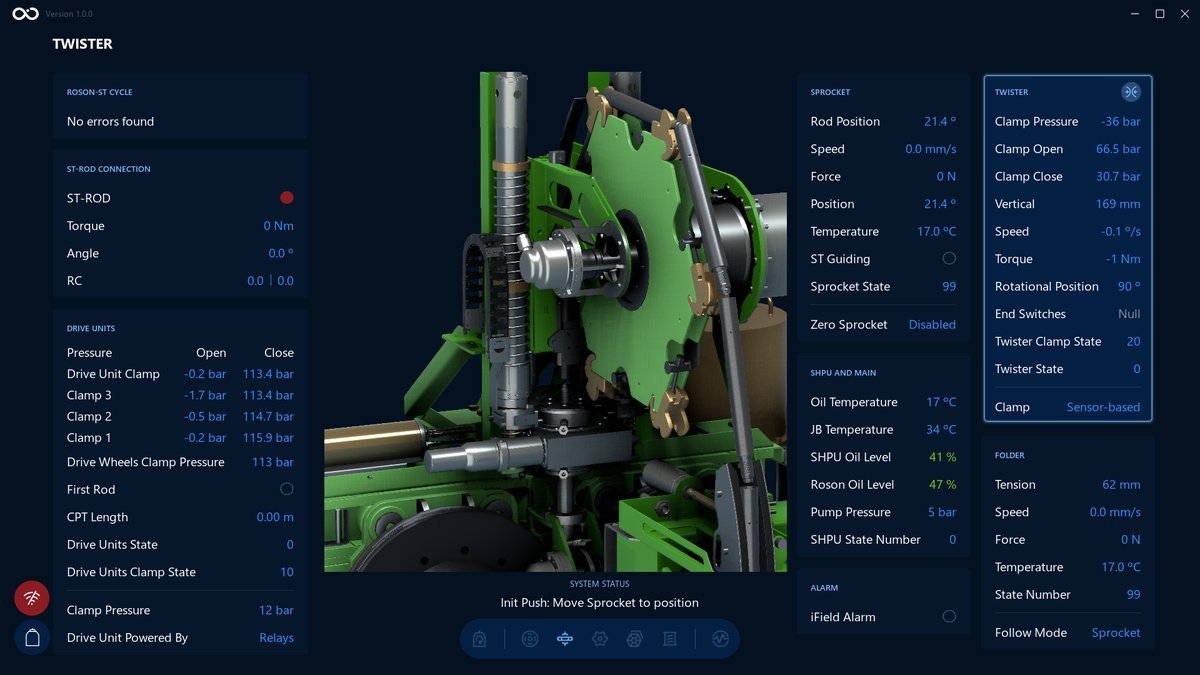
Tap on a Controlled Stop button to stop the process.
Clamp State
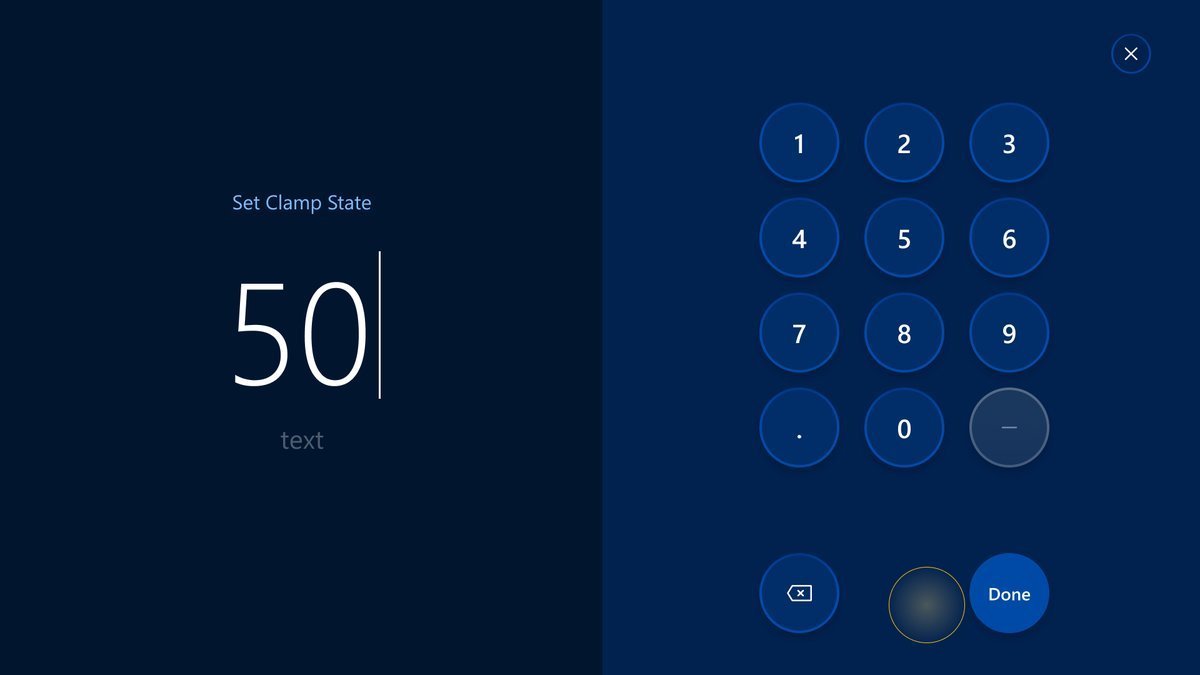
Opens a modal where an operator can set the Clamp State.
The button:
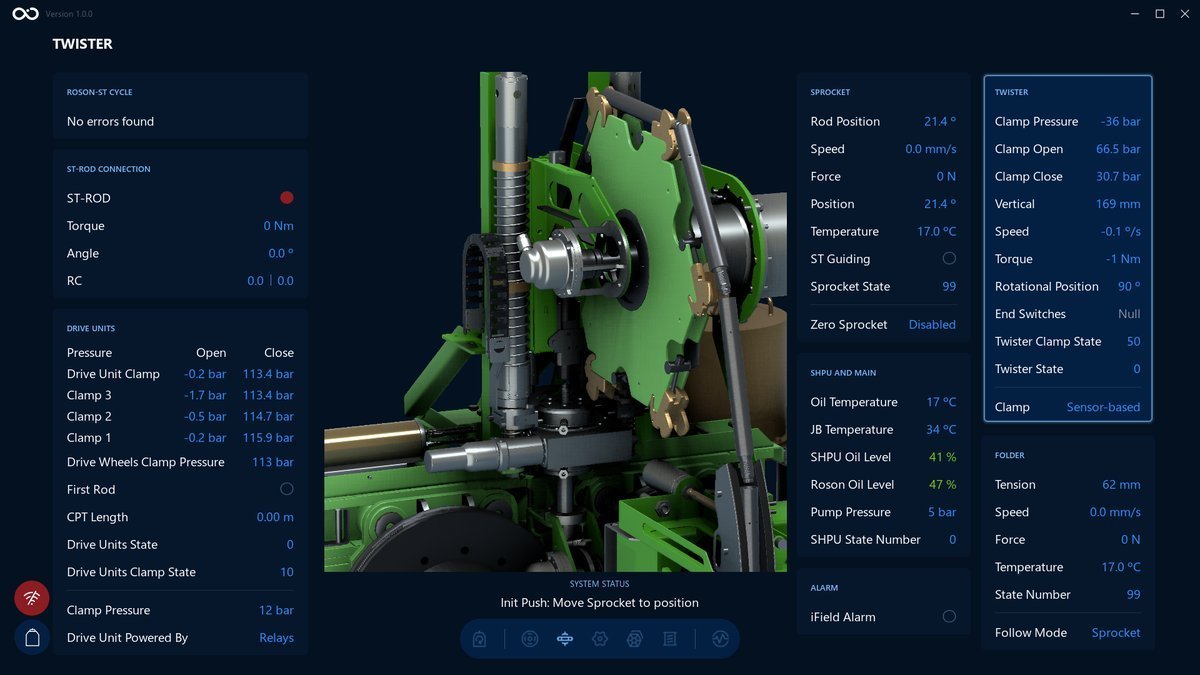
An example of the Visualization screen after changing the value for Clamp State to 50. We can see the Clamp State value changed and highlighted on the top right side:
Twister State
Opens a modal where an operator can set the Twister State.
The button:
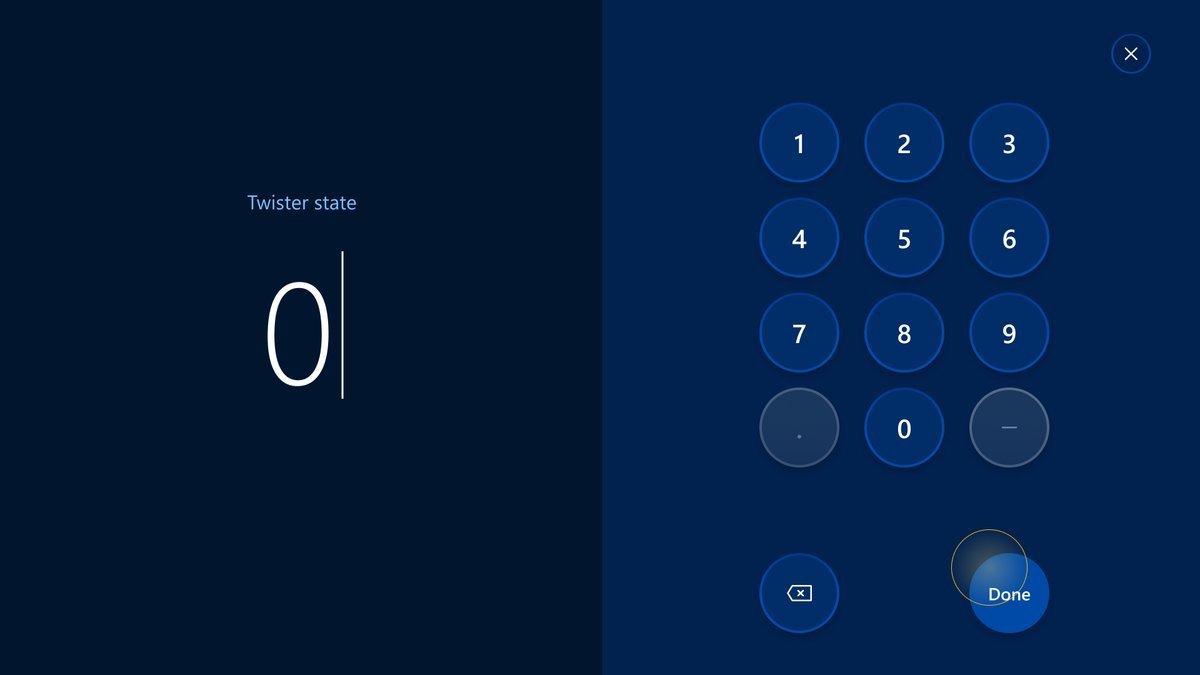
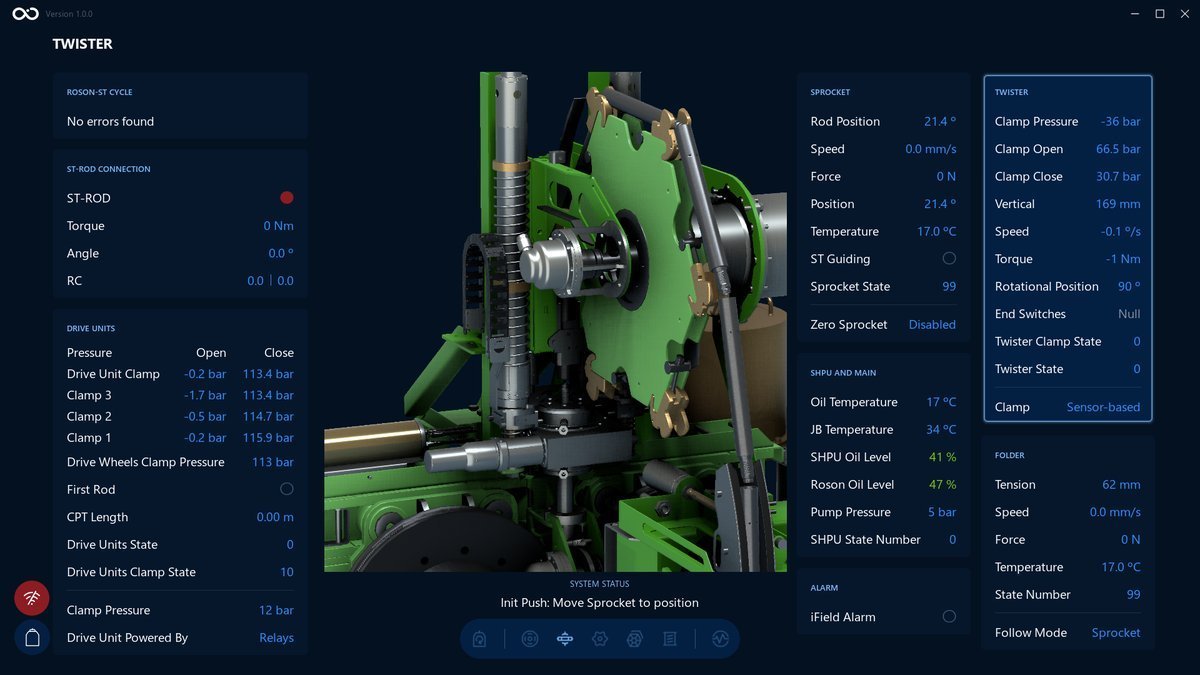
An example of the Visualization screen after changing the value for Twister State to 0. We can see the Twister State value changed and highlighted on the top right side:
Twister Clamp
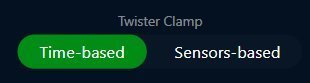
Tap to switch between Time-based and Sensor-based modes.
The switcher:
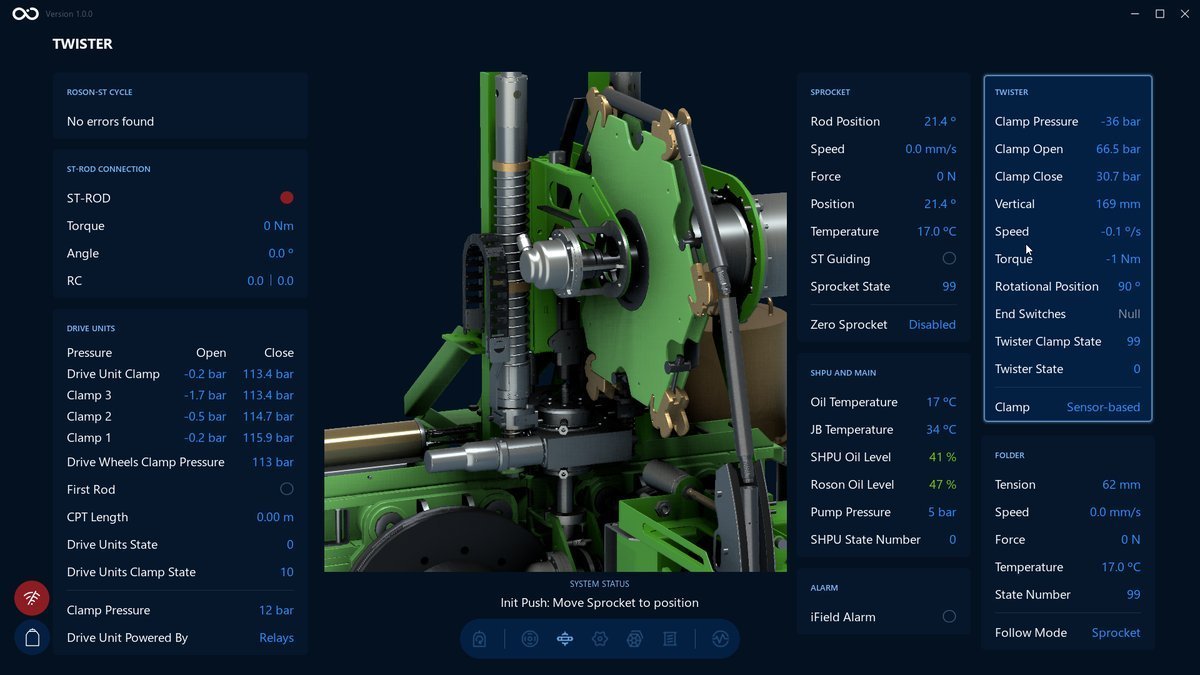
An example of the Visualization screen after Twister Clamp switched to Sensor-based. We can see the Clamp has changed on the top right side:
What's next?
Feel free to go to the next section and learn the Sprocket controls in more detail: Sprocket overview
Sprocket
In this section we will have a closer look at how you can use Sprocket screen to control the system during the CPT operation in Manual Mode.
Navigation
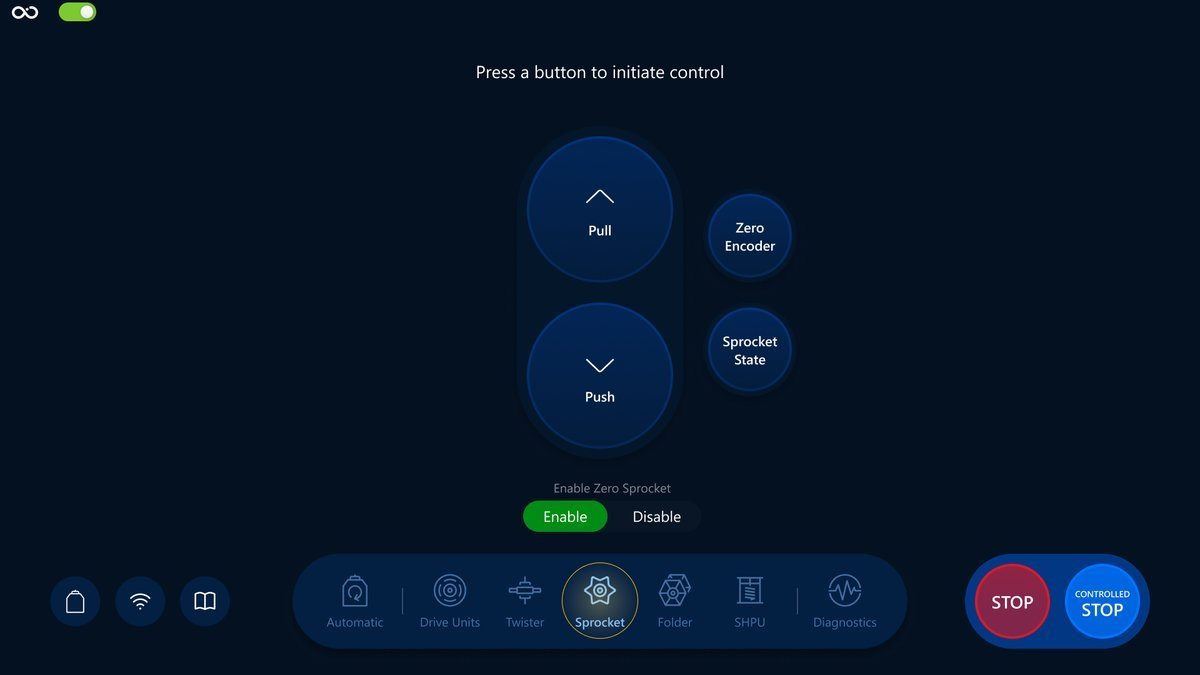
Choose the Sprocket icon in the navigation bar for navigation:
Controls
We will have a look at a brief description of the controls, their responsibilities and also how it reflects on the Visualization screen.
Push and Pull
Are responsible for starting rotating the Sprocket in push and pull modes.
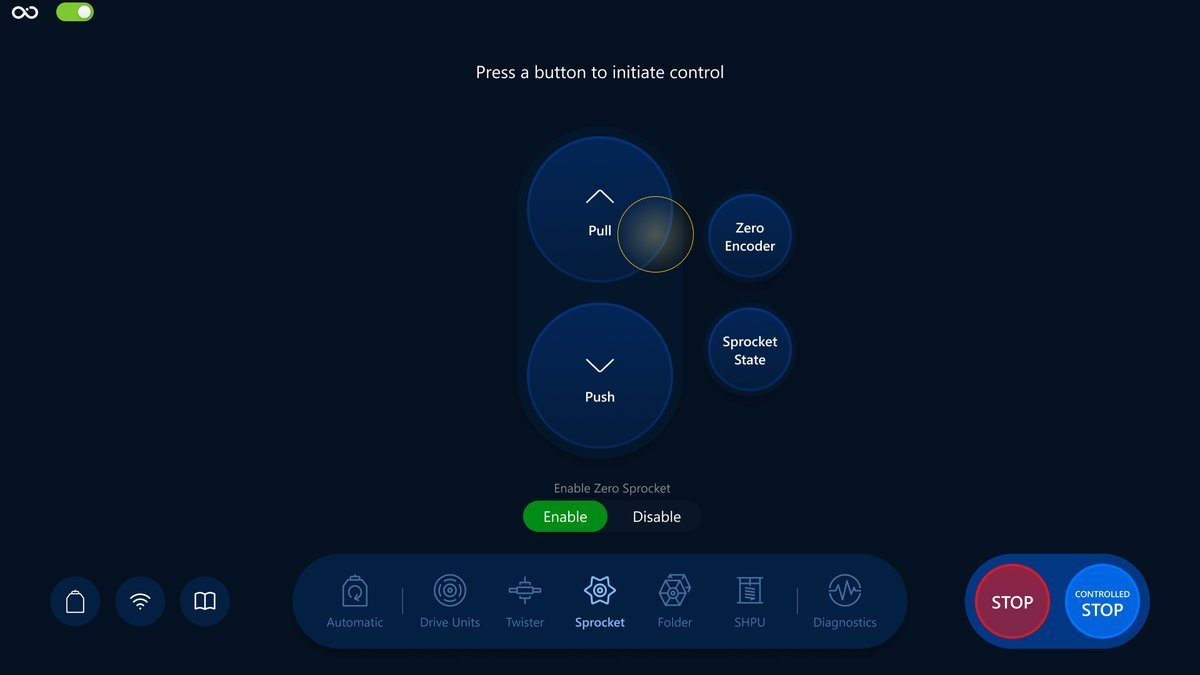
The buttons:
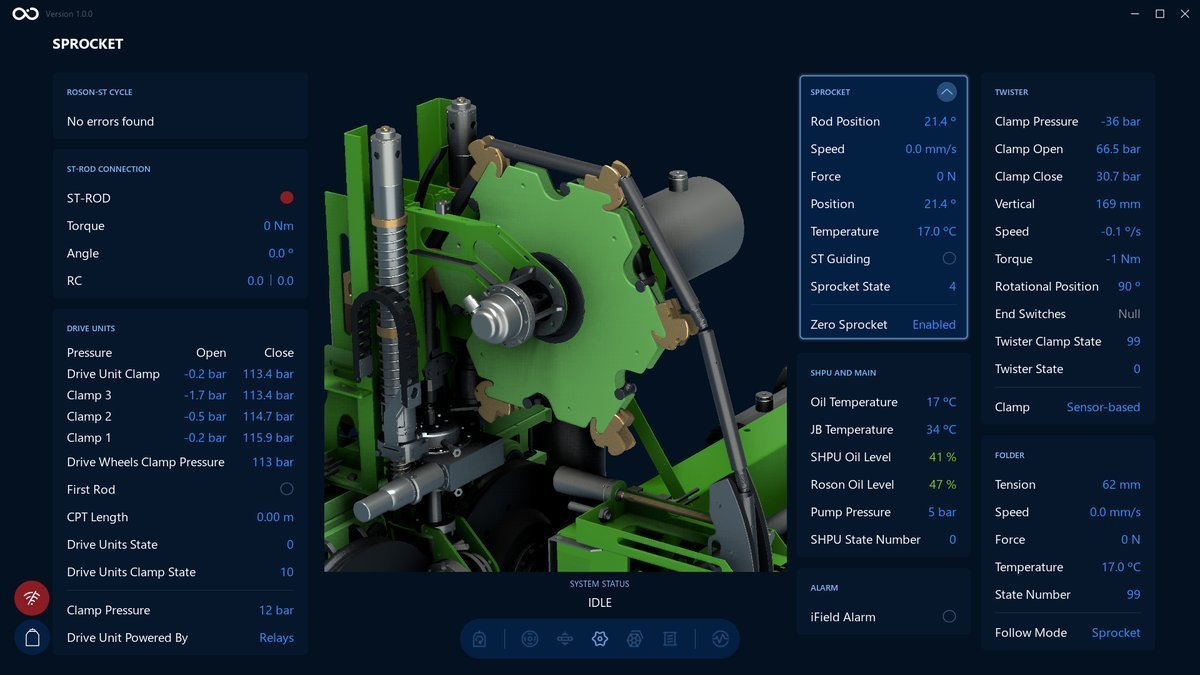
An example of the Visualization screen after Pull button is pressed. We can see the values changed in the Sprocket section:
Tap on the Controlled Stop button to stop the process.
Zero Encoder
Runs Zero Encoder command.
The button:
When "Enable Zero Sprocket" is switched to Disabled, the "Zero Encoder" button is also disabled.
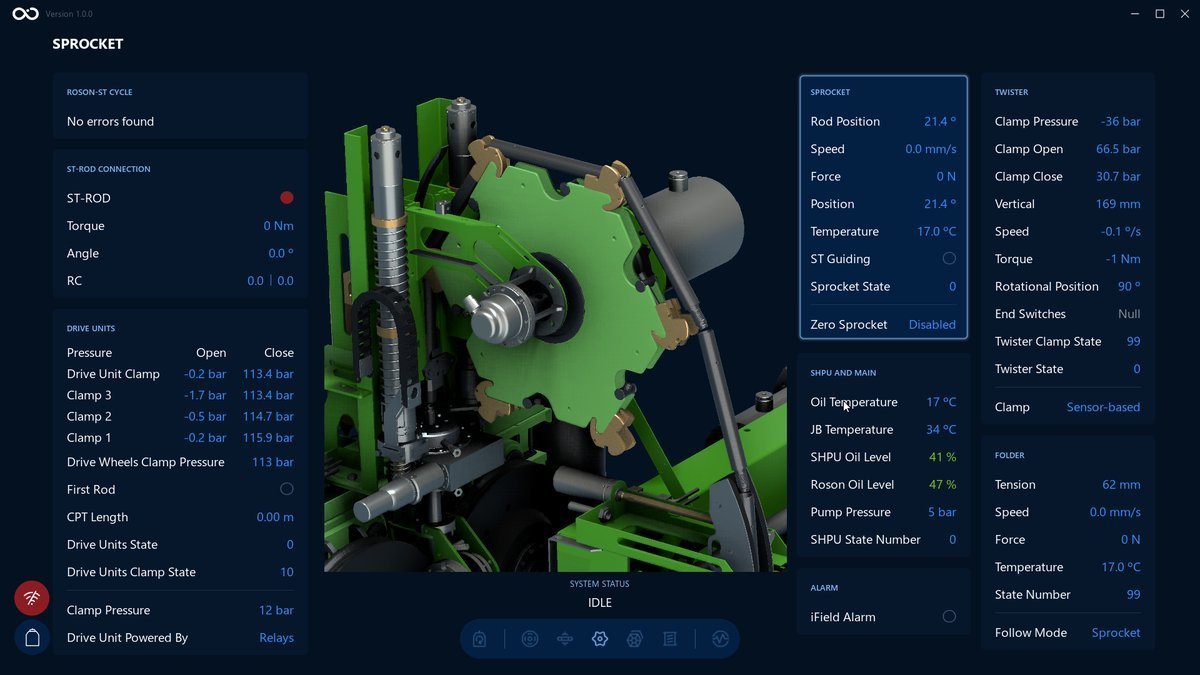
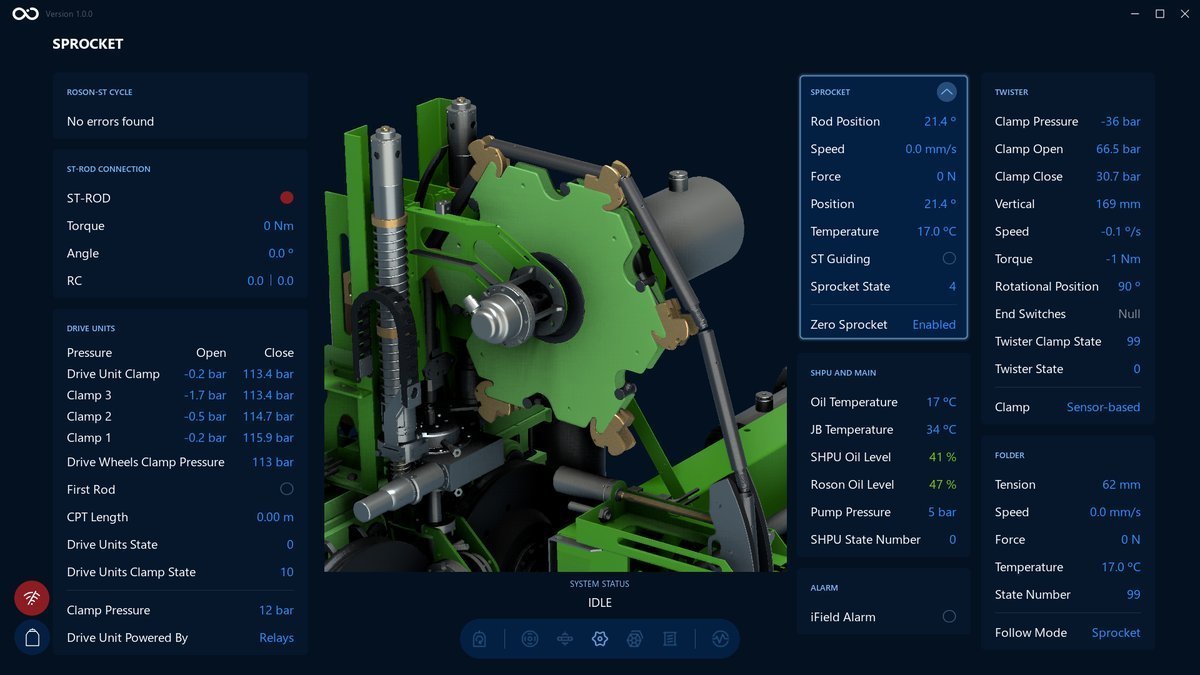
Visualization screen after tap on the zero encoder button. We can see the values changed and highlighted in the Sprocket section:
Sprocket State
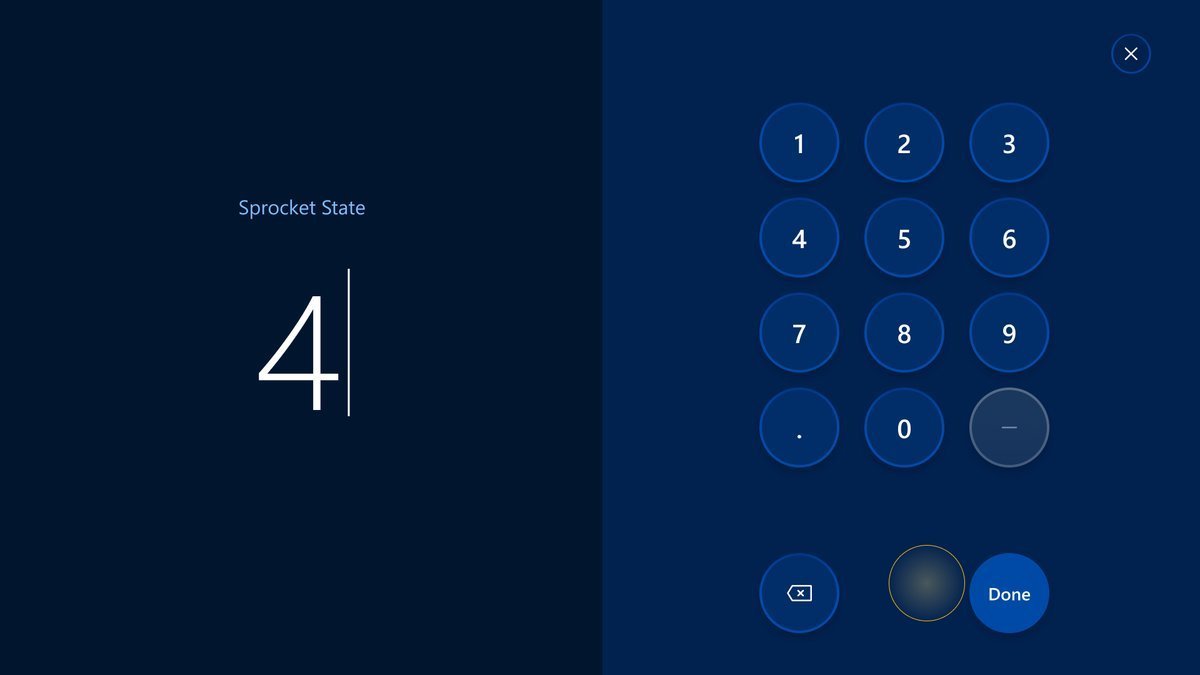
Opens a modal where an operator can set the Sprocket State.
The button:
An example of the Visualization screen after changing the Sprocket State value to 4. We can see the Sprocket State value changed:
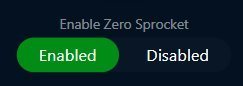
Enable Zero Sprocket
Tap to switch between Enabled and Disabled modes.
The switcher:
An example of the Visualization screen after Enable Zero Sprocket switched to Disabled. We can see the Zero Sprocket has changed:
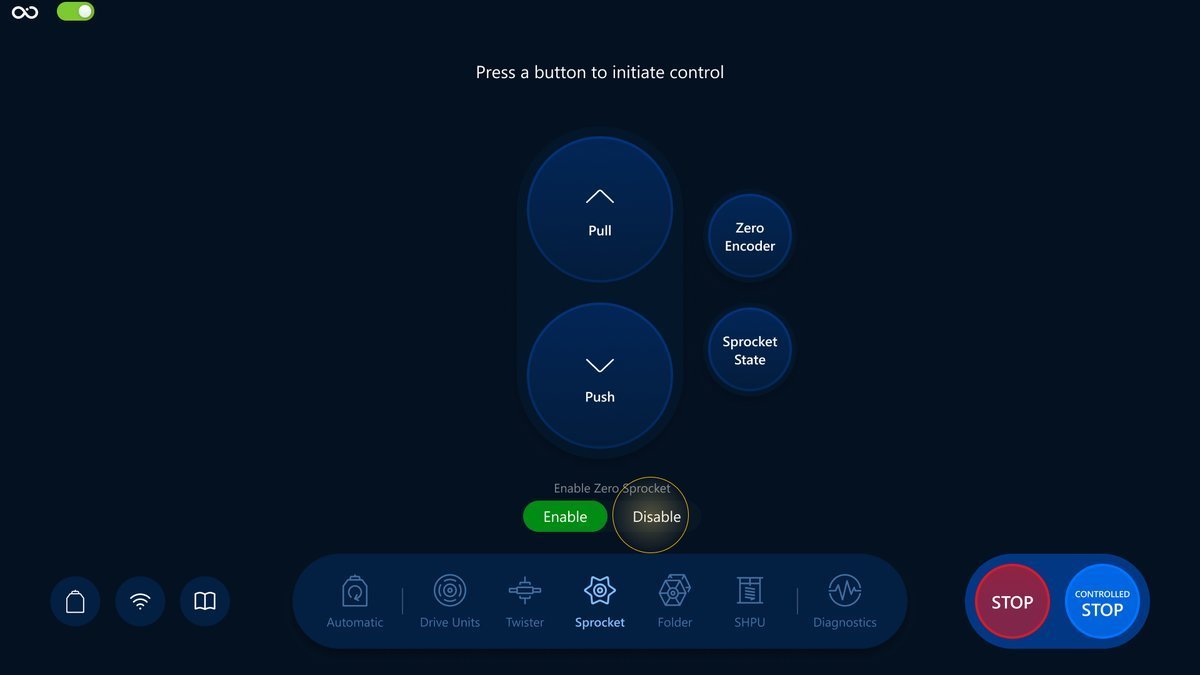
When Enable Zero Sprocket switched to Disabled, Zero Encoder button also disabled.
What's next?
Feel free to go to the next section and learn the Folder controls in more detail: Folder overview
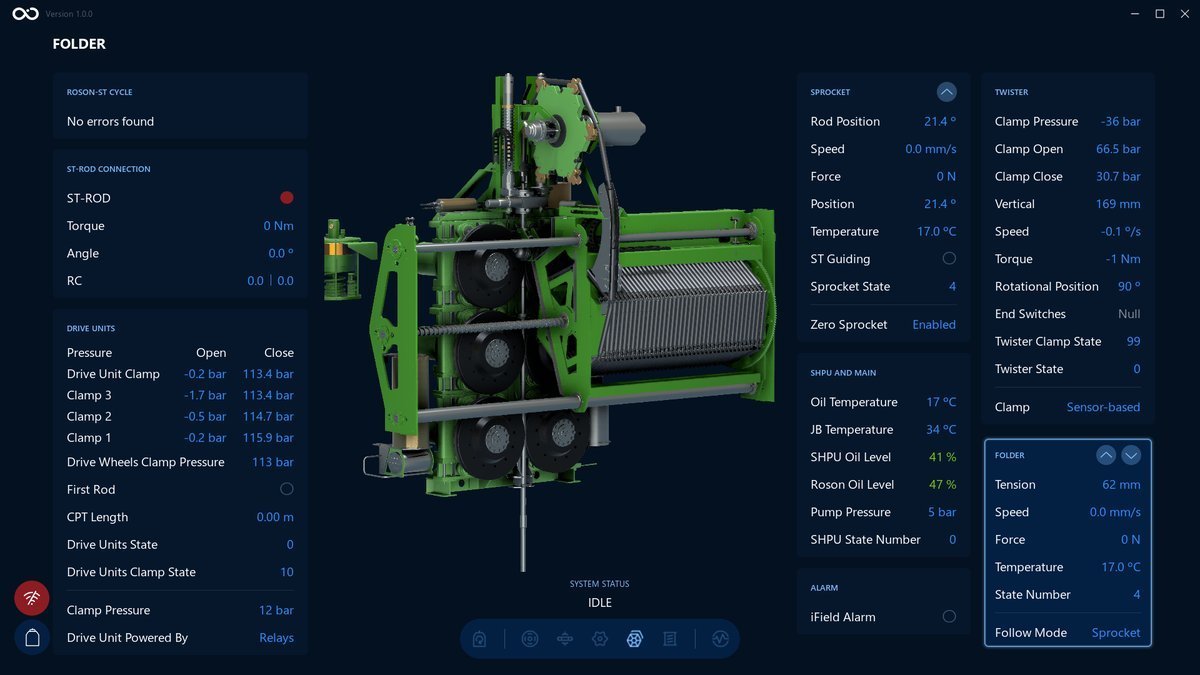
Folder
In this section we will have a closer look at how you can use Folder screen to control the system during the CPT operation in Manual Mode.
Navigation
Choose the Folder icon in the navigation bar for navigation:
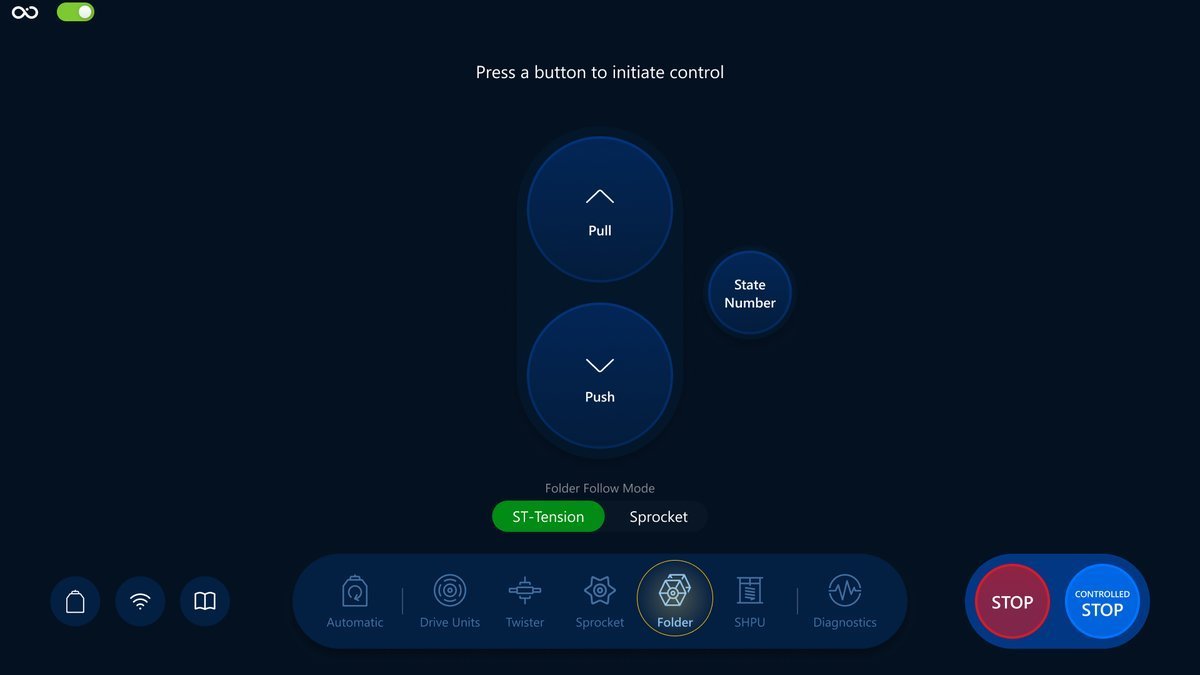
Controls
We will have a look at a brief description of the controls, their responsibilities and also how it reflects on the Visualization screen.
Push and Pull
Are responsible for starting rotating the Folder in push and pull modes.
The buttons:
An example of the Visualization screen after Push button is pressed. We can see the values changed in the Folder section:
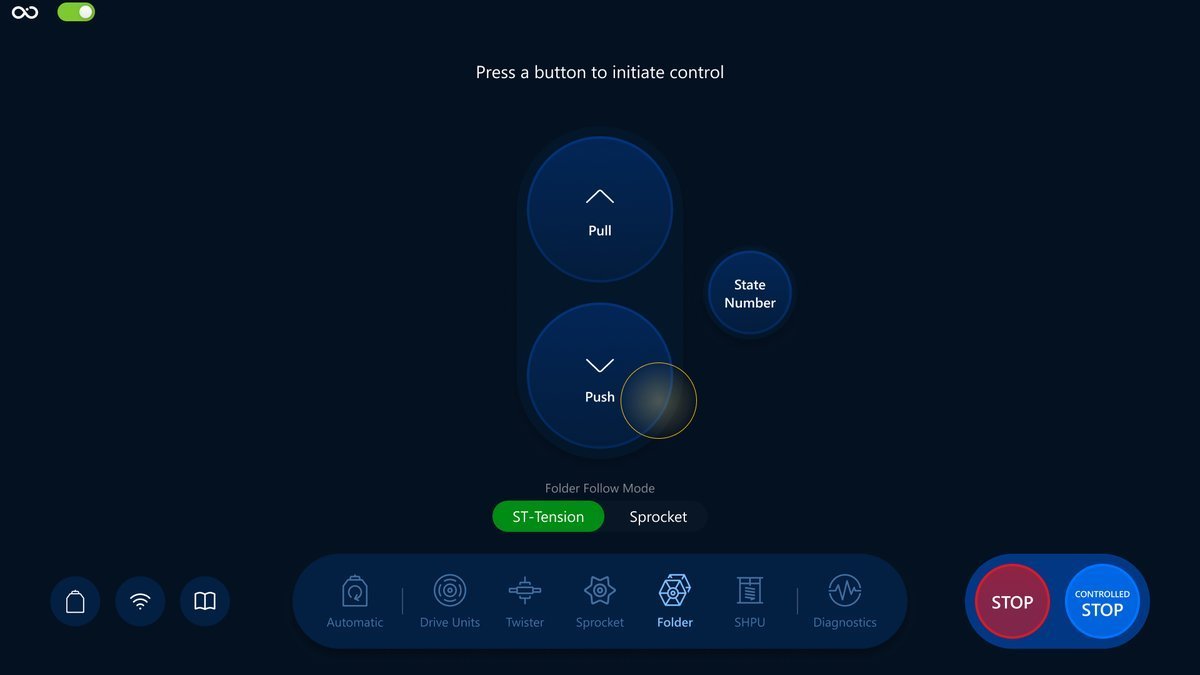
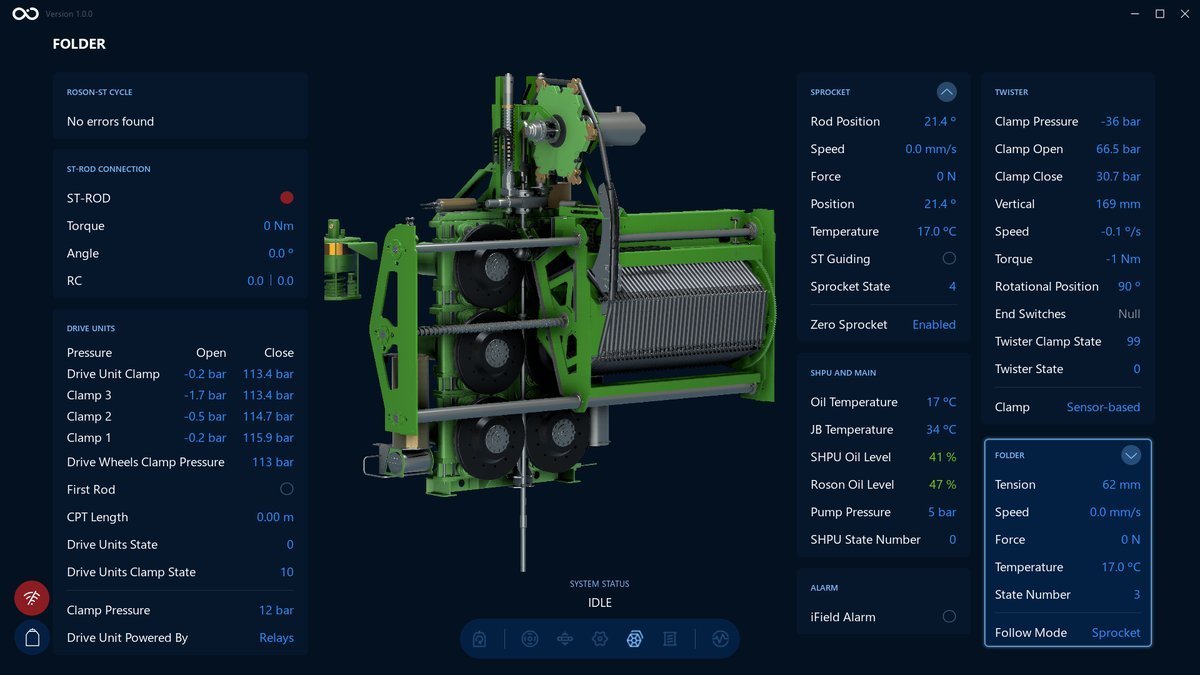
Tap on the Controlled Stop button to stop the process.
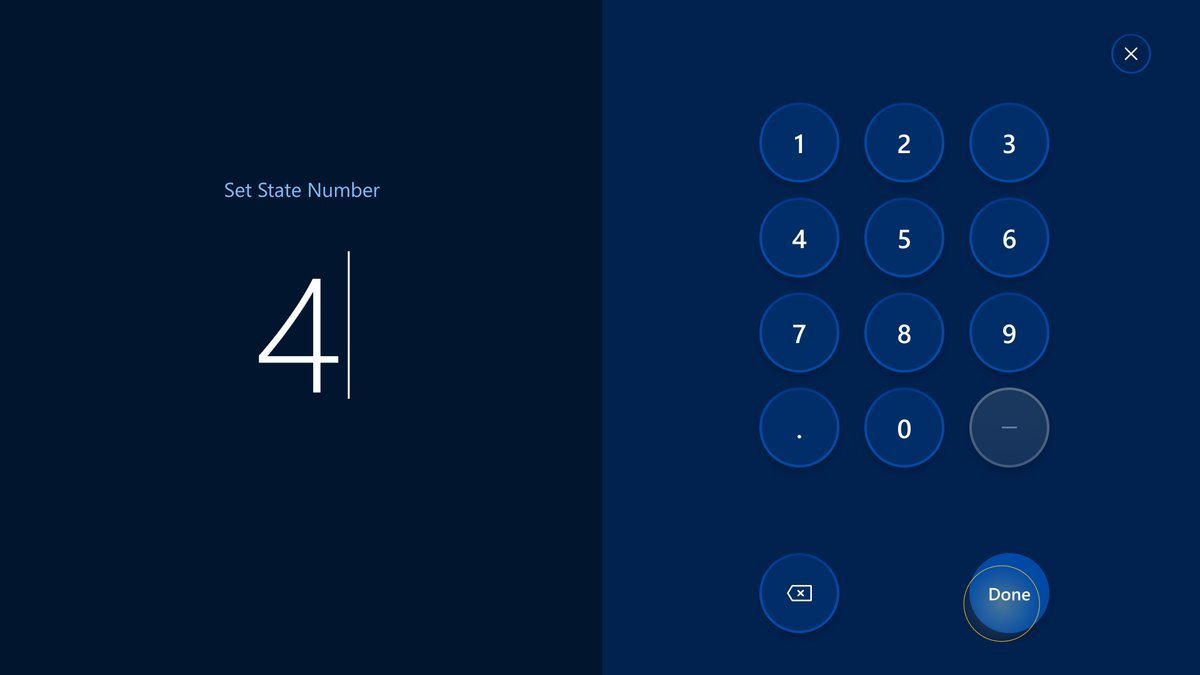
State Number
Opens a modal where an operator can set the State Number.
The button:
An example of the Visualization screen after changing the value for State Number to 4. We can see the State Number value changed:
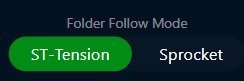
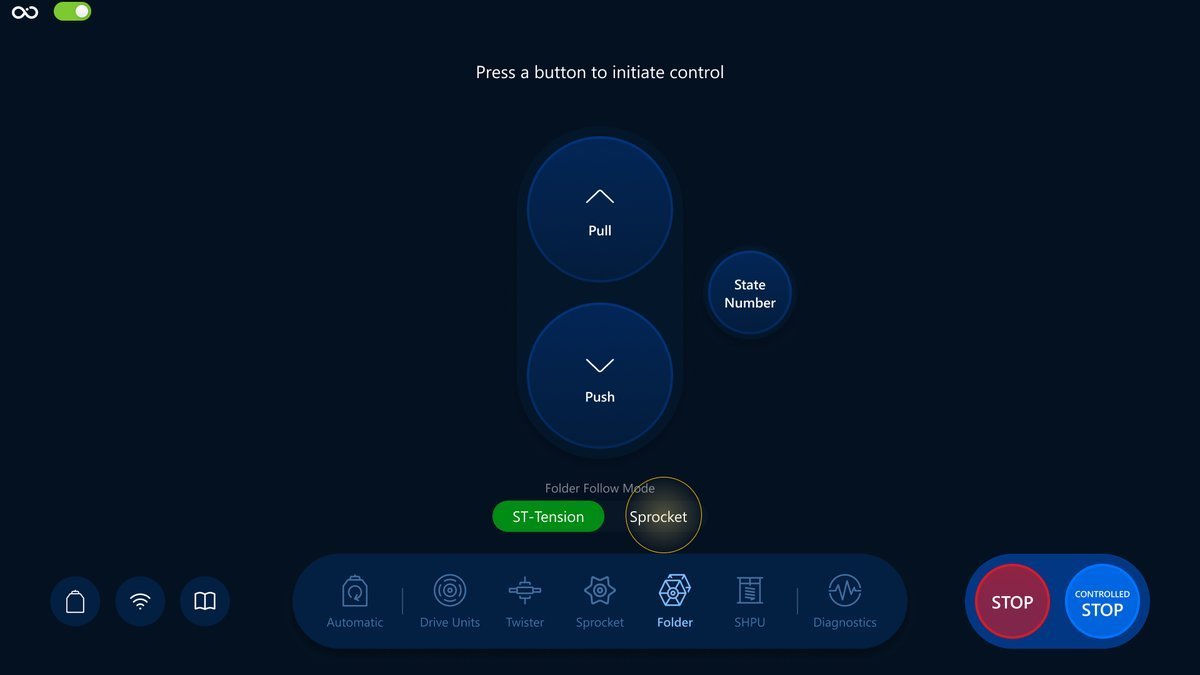
Folder Follow Mode
Tap to switch between ST-Tension and Sprocket modes.
The switcher:
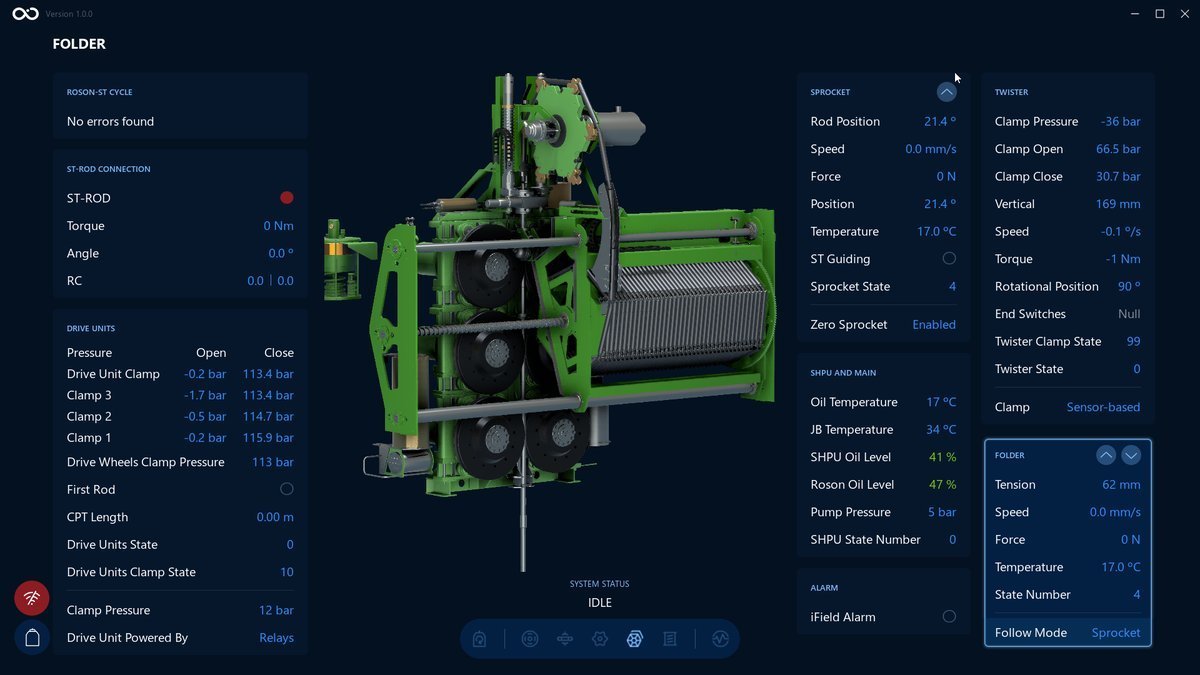
An example of the Visualization screen after Follow Mode switched to Sprocket. We can see the Follow Mode has changed:
What's next?
Feel free to go to the next section and learn the SHPU controls in more detail: SHPU overview
SHPU
In this section we will have a closer look at how you can use SHPU screen to control the system during the CPT operation in Manual Mode.
Navigation
Choose the SHPU icon in the navigation bar for navigation:
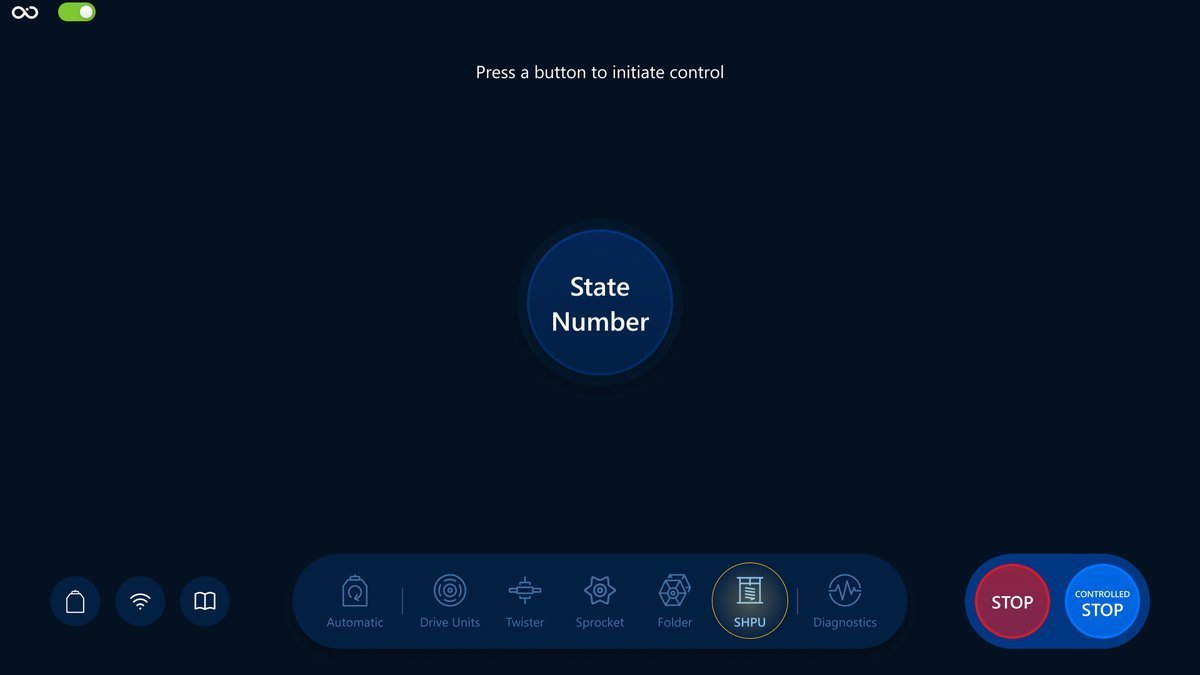
Controls
We will have a look at a brief description of the controls, their responsibilities and also how it reflects the Visualization screen.
State Number
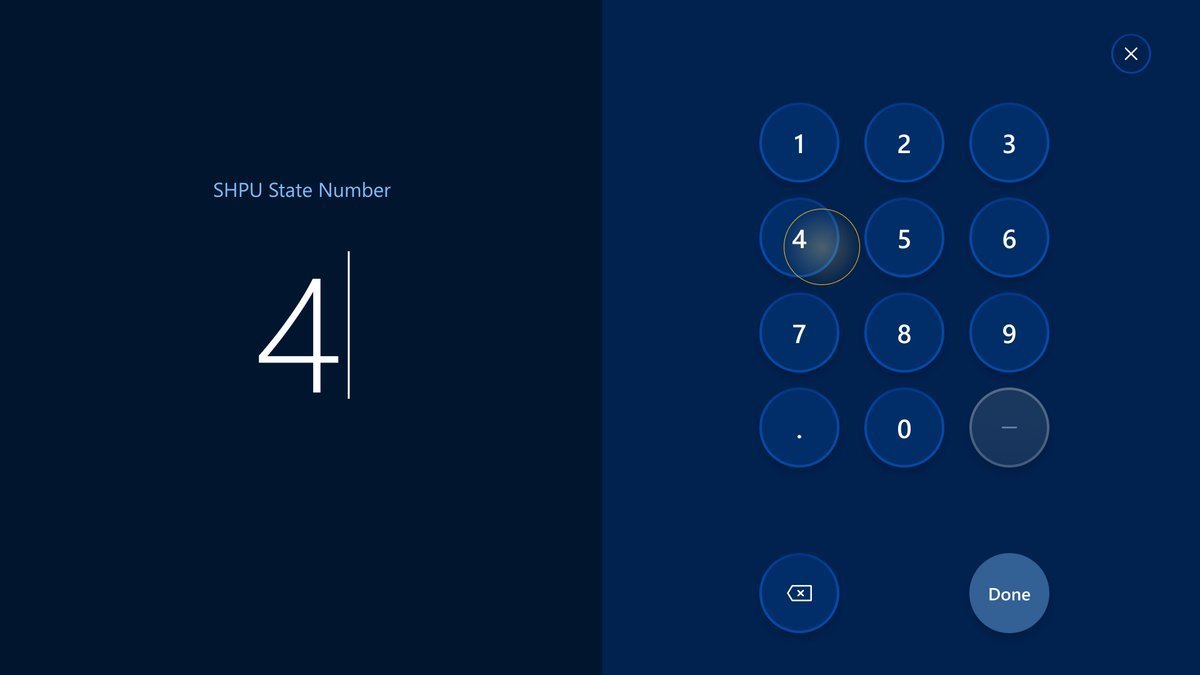
Opens a modal where an operator can set the State Number.
The button:
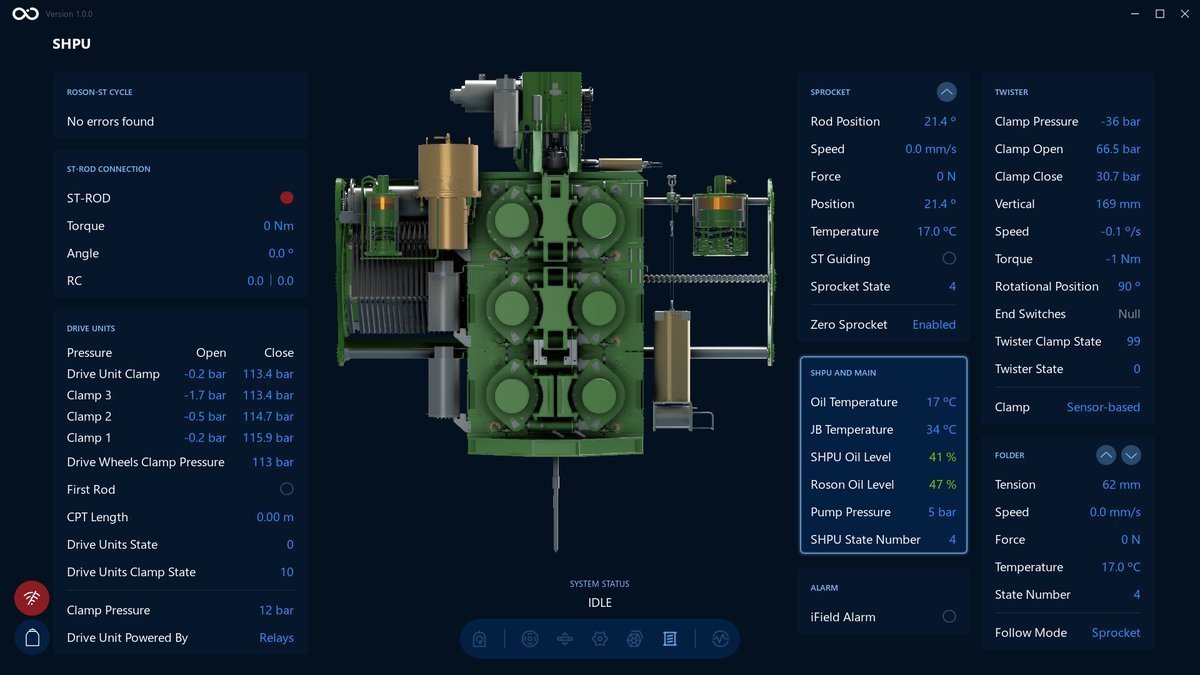
An example of the Visualization screen after changing the value for SHPU State Number to 4. We can see the SHPU State Number value changed:
What's next?
Feel free to go to the next section and learn the Diagnostics screen controls in more detail: Diagnostics overview
Ended: Manual Mode
Diagnostics Screen
In this section we will have a closer look at the Diagnostics screen with settings and additional diagnostics of the Roson system.
Navigation
Choose the Diagnostics icon in the navigation bar for navigation:
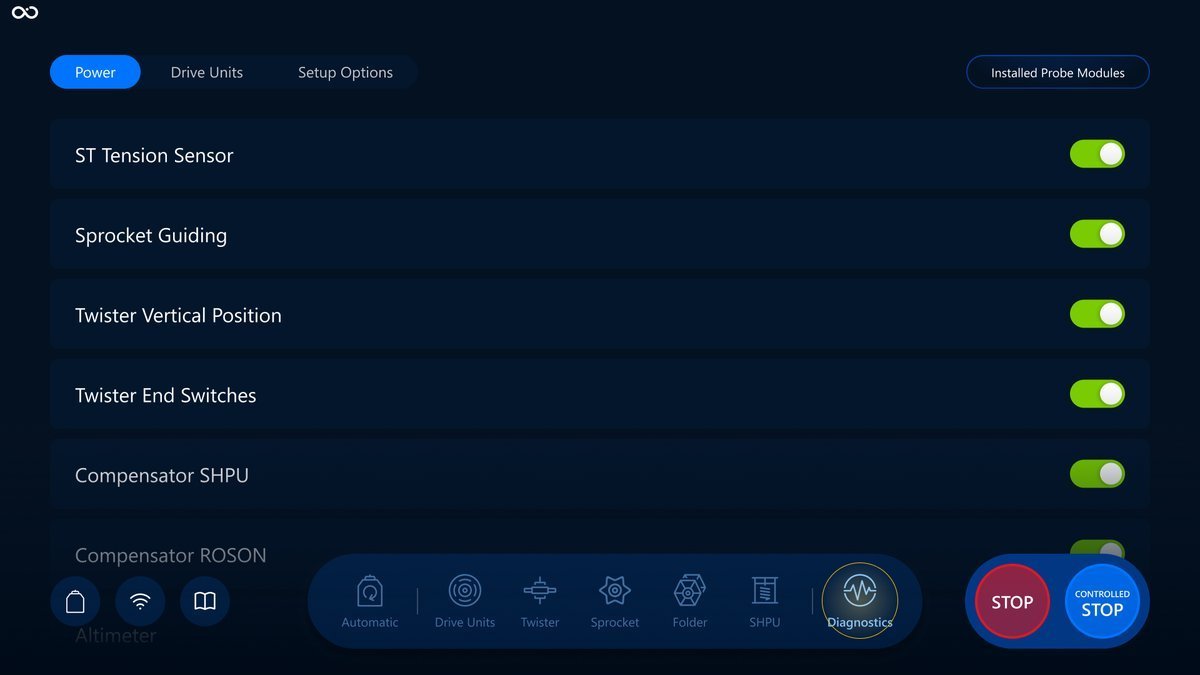
Toggles
On the Diagnostics screen, we will mostly use toggles rather than action buttons. By using toggles you can switch between two values (on and off):
Here is an example with the "on" option:

With the "off" option:

Secondary statuses for toggles
Other than On and Off, there are situational and intermediary statuses, such as disabled, waiting, warning and error:
Disabled
Indicates that the toggle is currently not interactive:
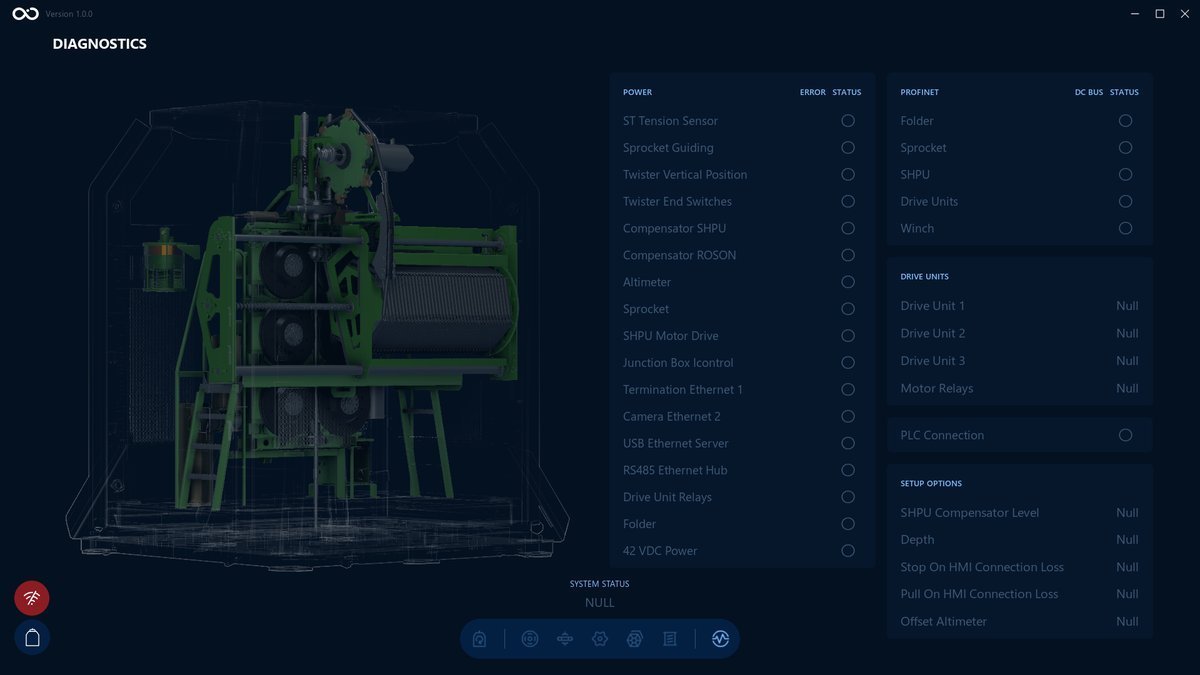

Waiting
Indicates that the operation is pending, and you need to wait until the moment it turns to another status. You can't interact with the toggle during the time this status is active:

Activated
If response was successful than toggle would receive the Activated status. After 5 sec status will switch into Enabled.

Warning
Indicates that there is a connection problem. It's also not interactive:

Read the system status message to see what went wrong.
Error
Indicates that one of the Roson’s components has an error:
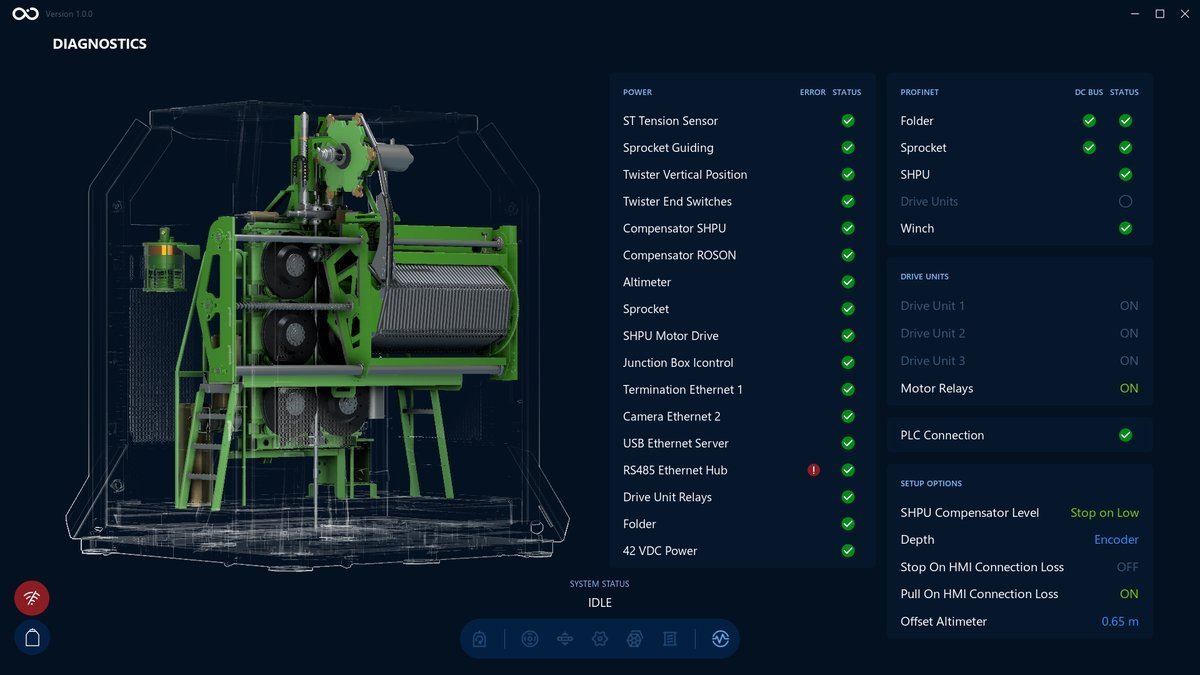

Read the system status message to know why the operation failed.
Controls
We will have a look at a brief description of the controls, their responsibilities and also how it reflects on the Visualization screen.
There are 3 available tabs with the different controls (Power, Drive Units and Setup Options) and Installed Probe Modules.
Power tab
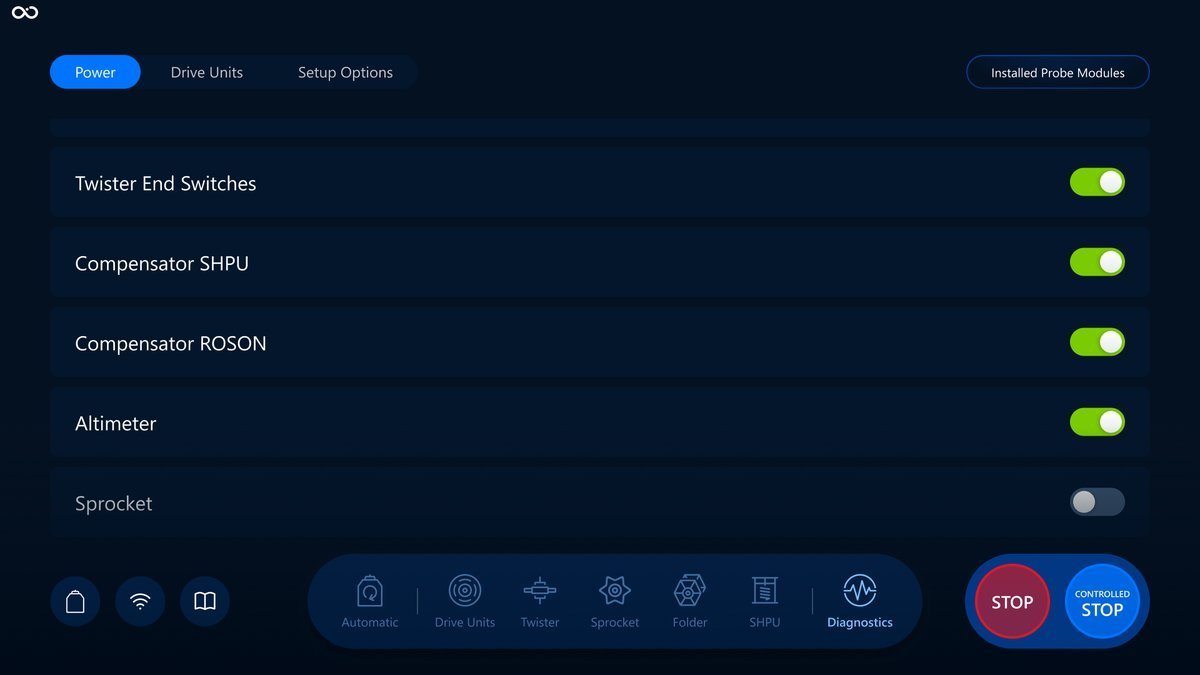
In the power tab, the corresponding function can be powered on or powered off. Next, you will see an example of an interaction with the toggle that powers off the Sprocket and how it reflects on the visualization screen:
Control action:
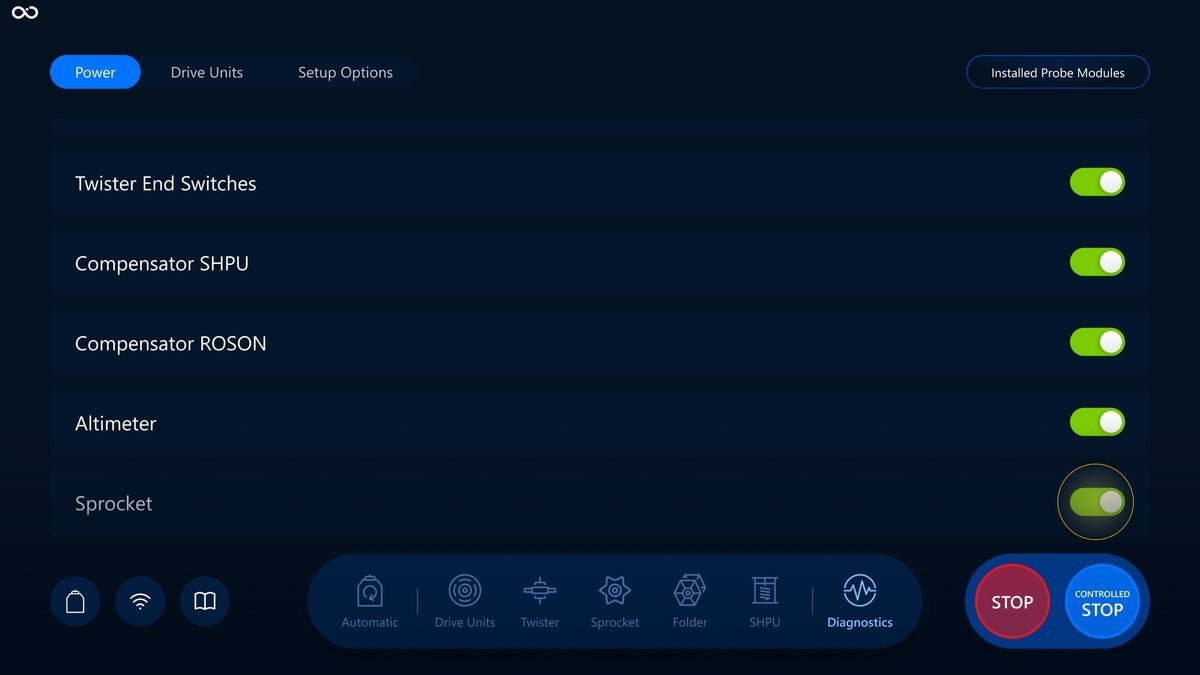
Toggle is turned off:
The Sprocket is powered off on the Visualization screen:
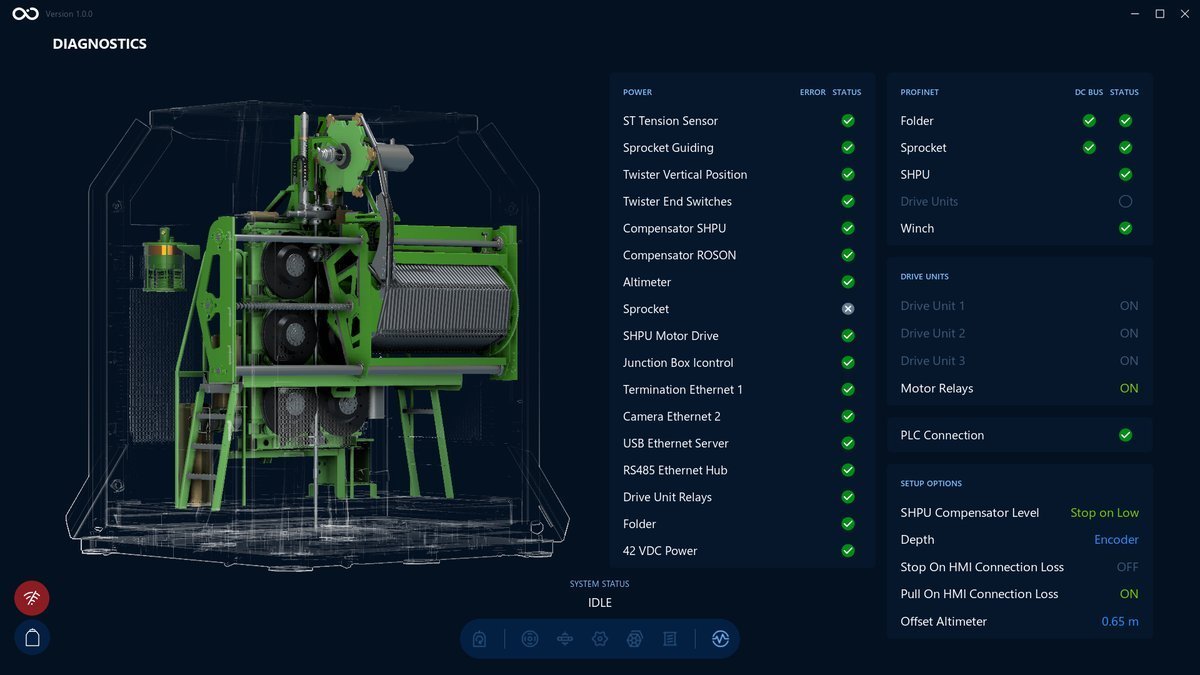
The same logic applies to other toggles in the power tab.
Termination Ethernet 1 button and toggle are disabled for clicking. As an exception, this toggle is disabled at all times because it directly affects the connection between HMI/OPC Server and the PLC.
Drive Units tab
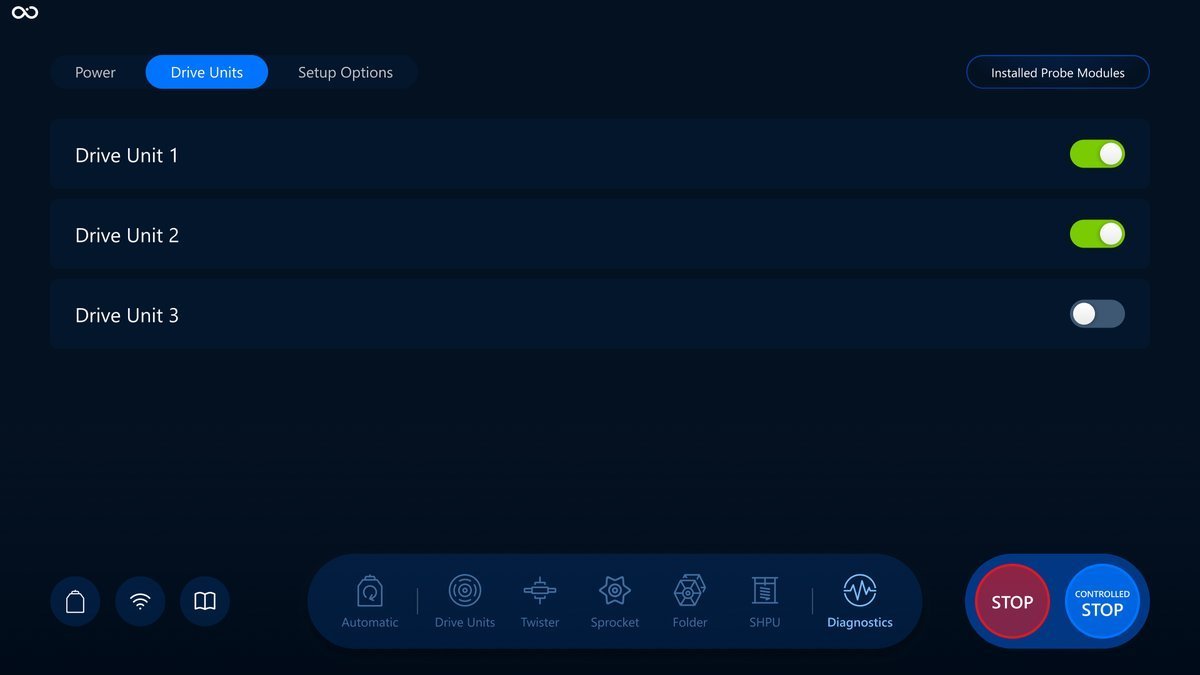
In the Drive Units tab, you can turn on or turn off each Drive Units power individually. Here is an example of an interaction with the toggle that turns off the Drive Unit 3 and how it reflects on the visualization screen:
When Drive Unit Powered By switched to Relays, Diagnostics: Drive Units tab is disabled.
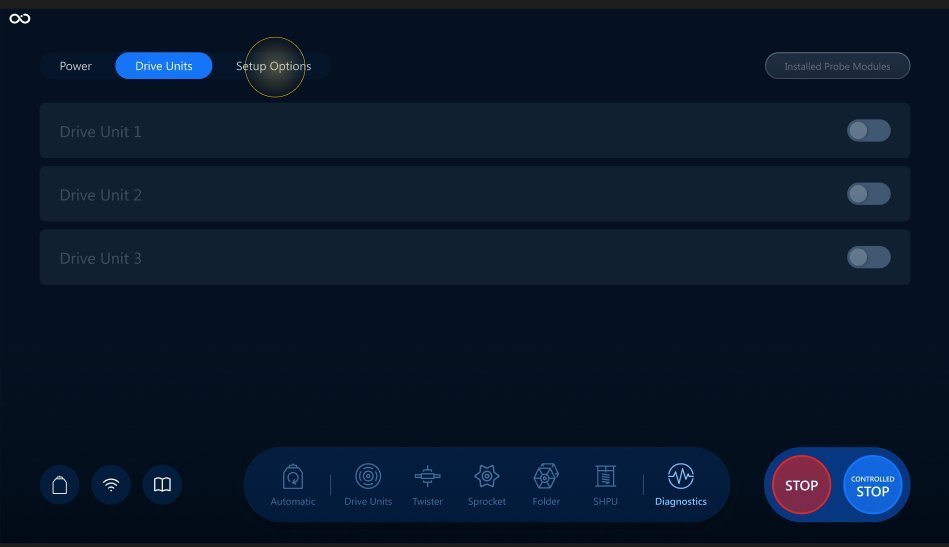
Control action:
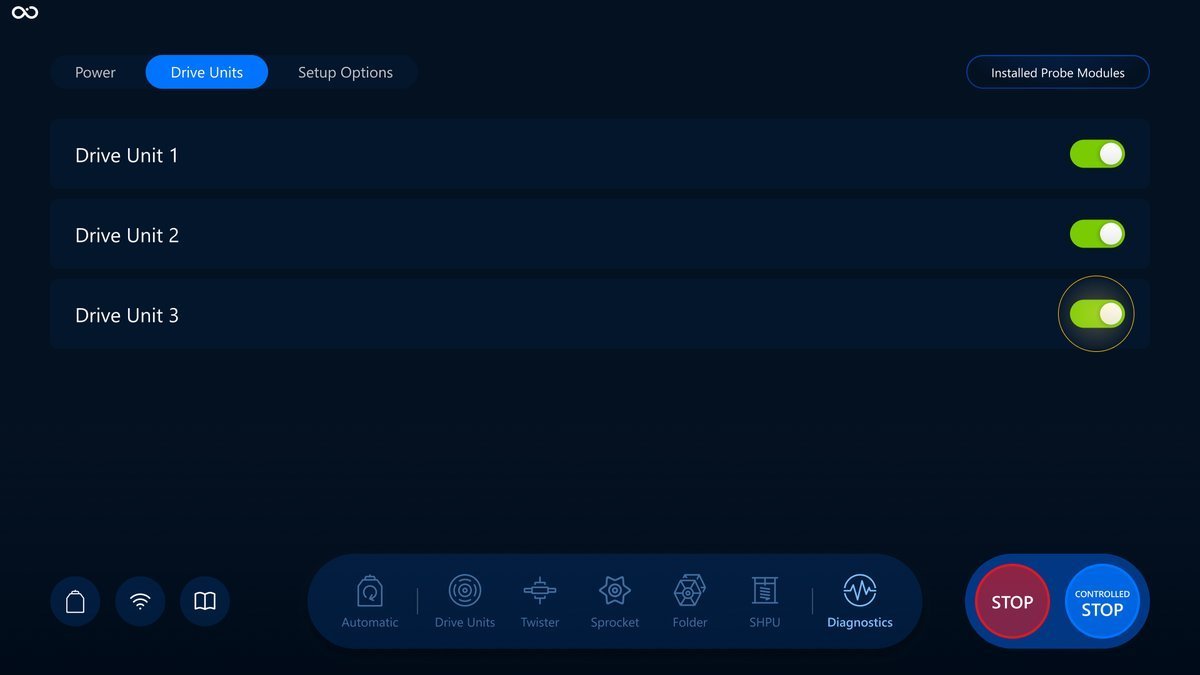
Toggle is turned off:
The Drive Unit 3 is turned off on the Visualization screen:
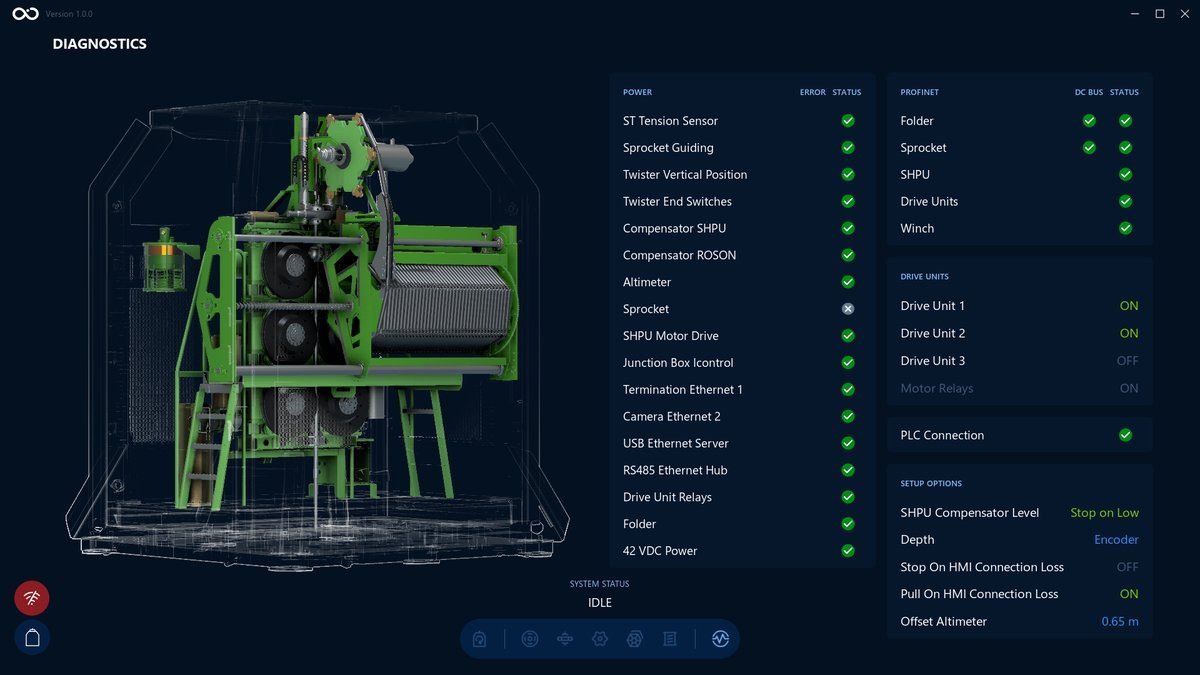
The same logic applies to other toggles in the drive units tab.
Setup Options tab
In the Setup Options tab, there are different functions you can manage, lets take a closer look:
SHPU Compensator Level
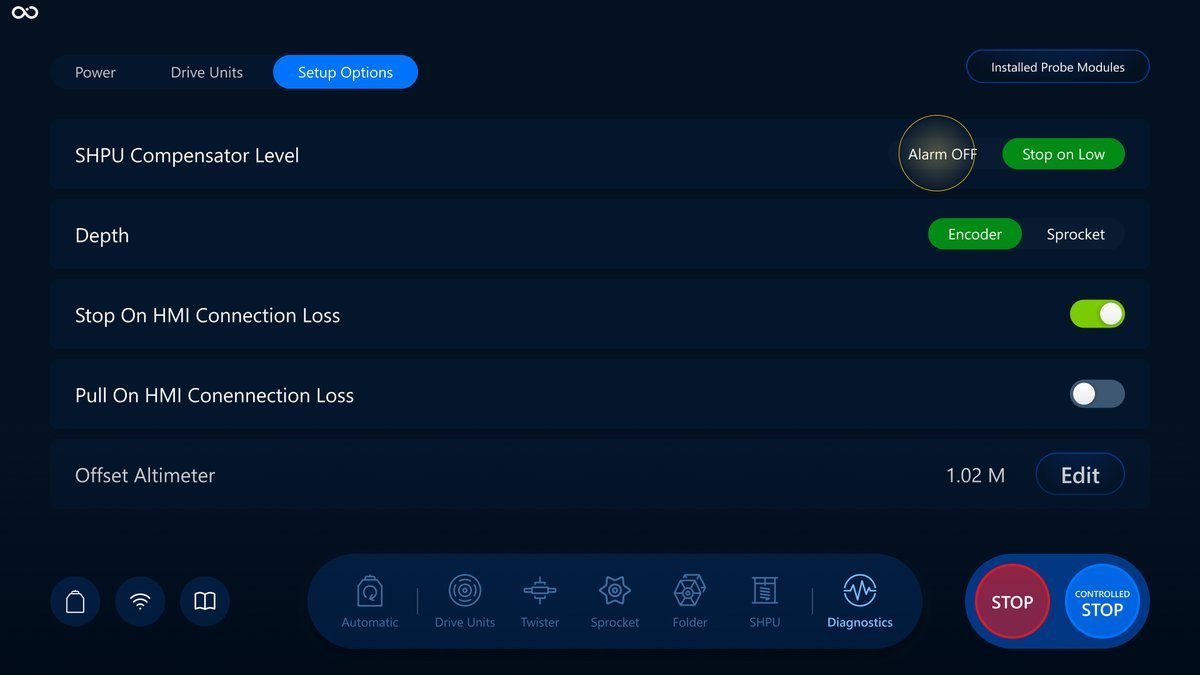
You can switch between Alarm OFF and Stop On Low functions by tapping on the desired option.
Tap to switch SHPU Compensator Level to Alarm OFF:
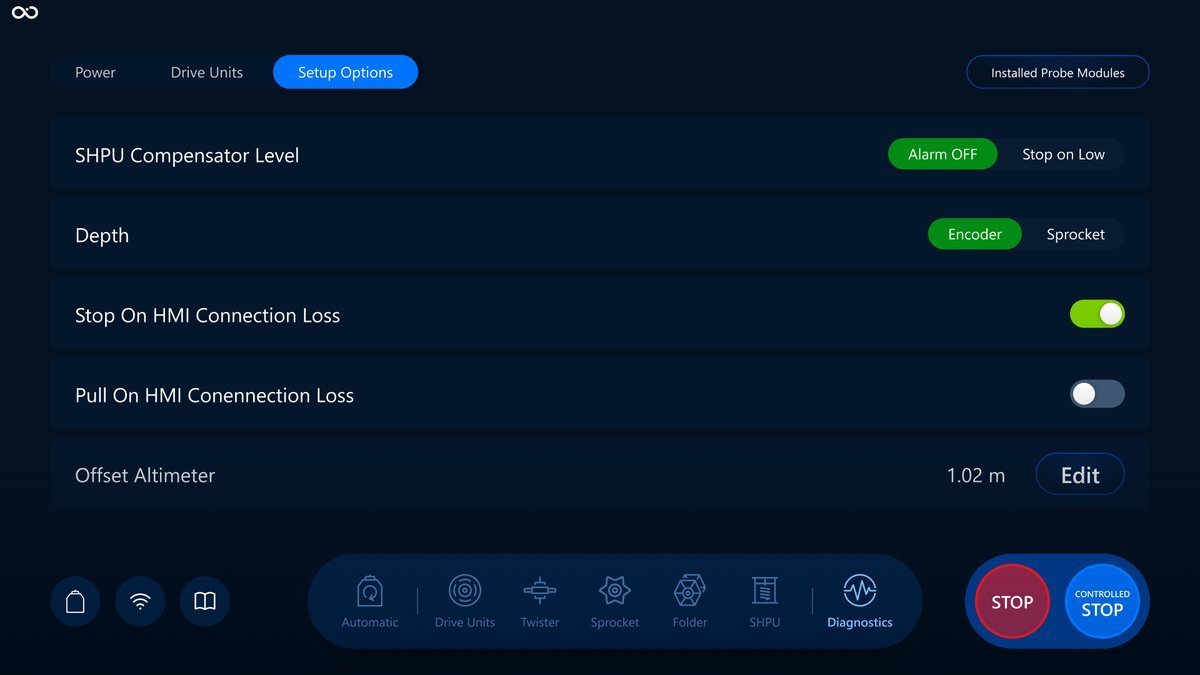
Visualization screen:
Depth
You can switch between Encoder and Sprocket functions by tapping on the desired option.
Tap to switch Sprocket to Encoder:
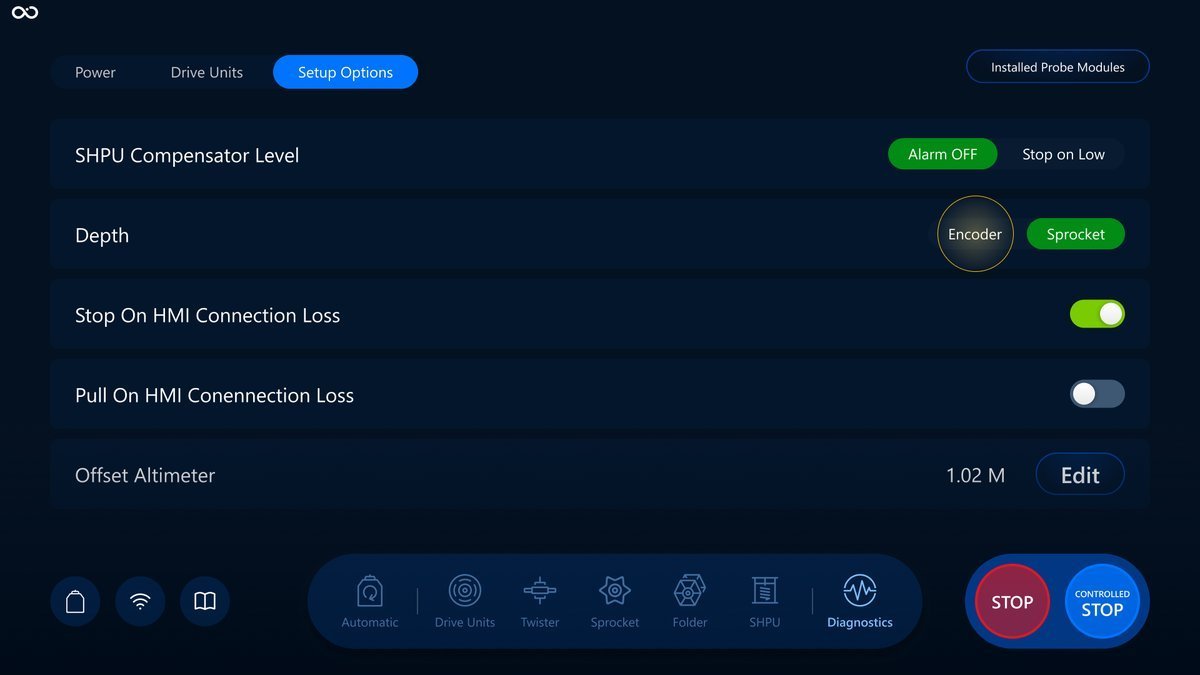
Visualization screen:
Stop On HMI Connection Loss
Pull On HMI Connection Loss is Disabled when Stop on HMI Connection loss is Off.
Tap Stop on HMI Connection loss to turn on the function:
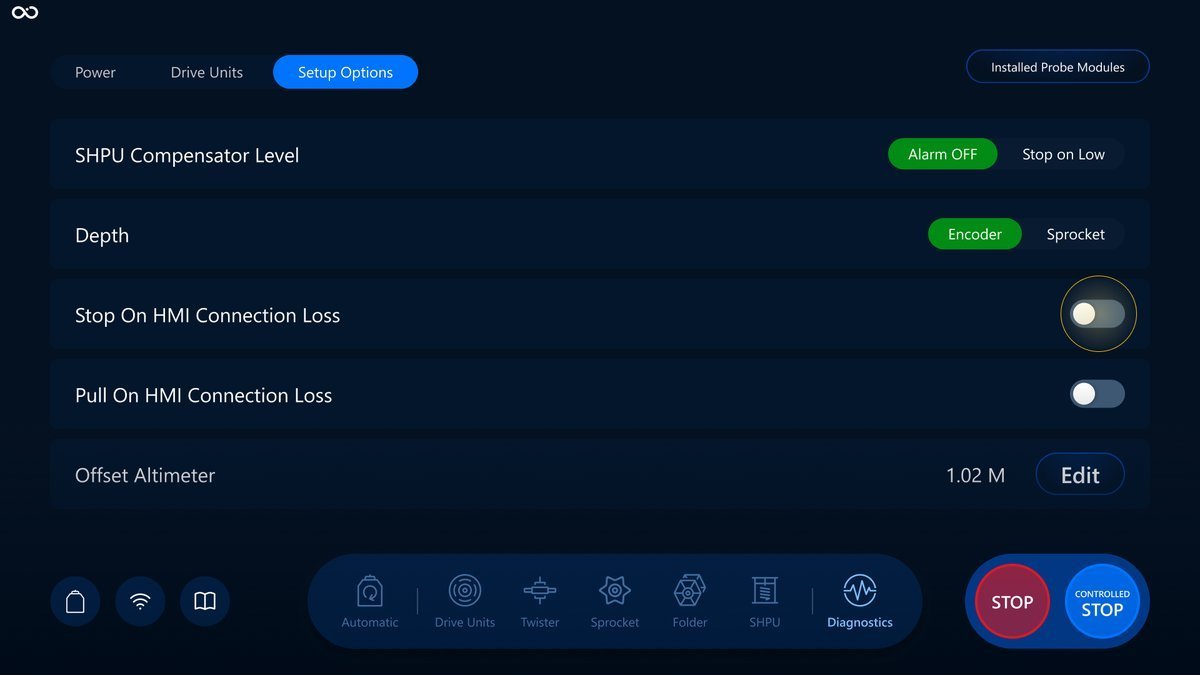
Toggle is turned on:
The Stop On HMI Connection Loss is turned on. Visualization screen:
The same logic applies to the Pull On HMI Connection Loss toggle.
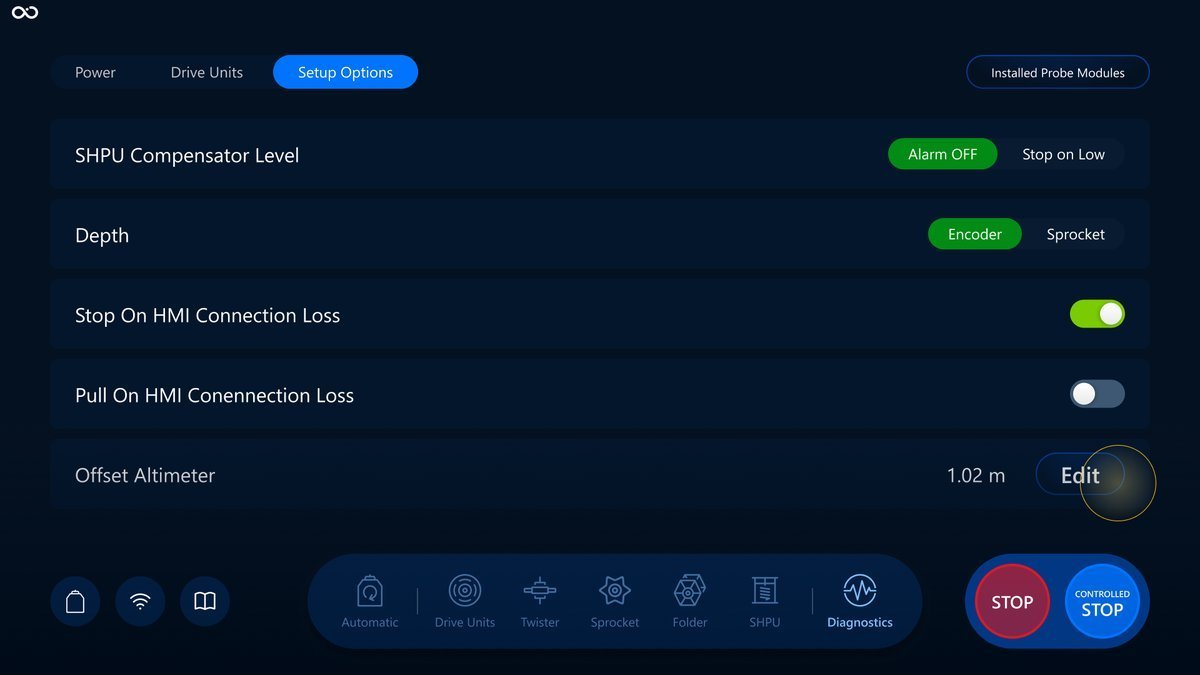
Offset Altimeter
Tap the Edit button to open the modal to change the value. A number on the left side of the button shows the current value. If there is no number, the value still needs to be set.
Here is an example of changing the value for the Offset Altimeter:
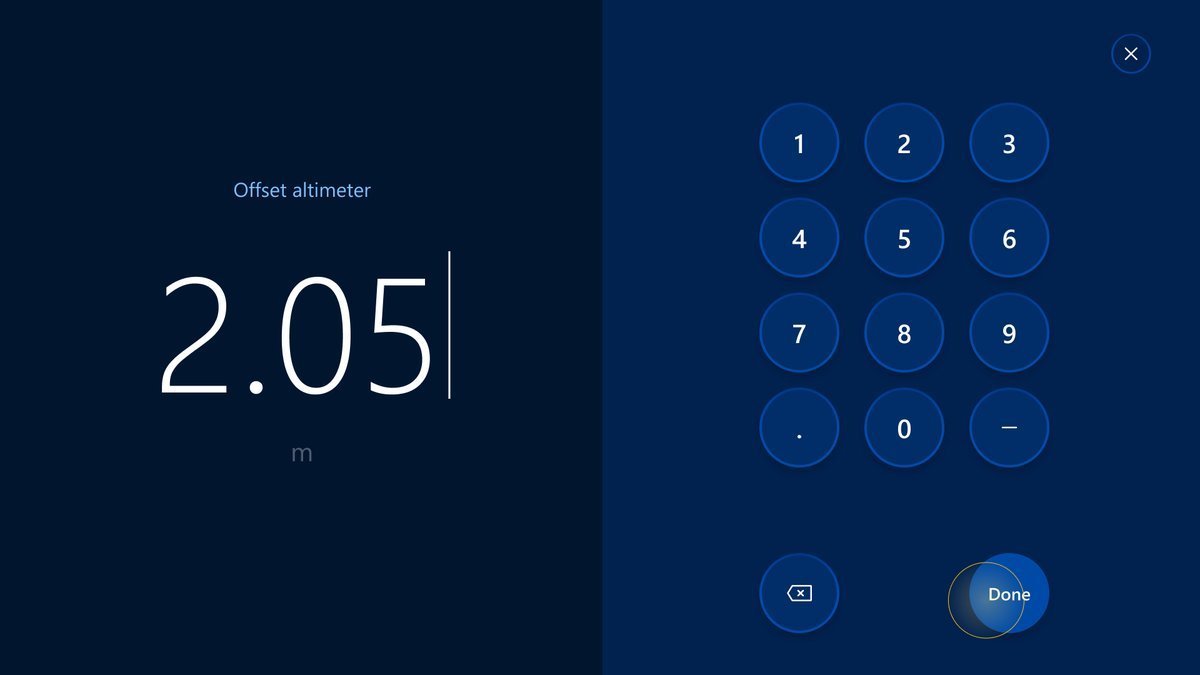
After you set the value into Offset Altimeter it receive Waiting status.

If response was successful than toggle would receive the Activated status. After 5 sec status will switch into Enabled.

If connection failed, Offset Altimeter will receive Warning status.

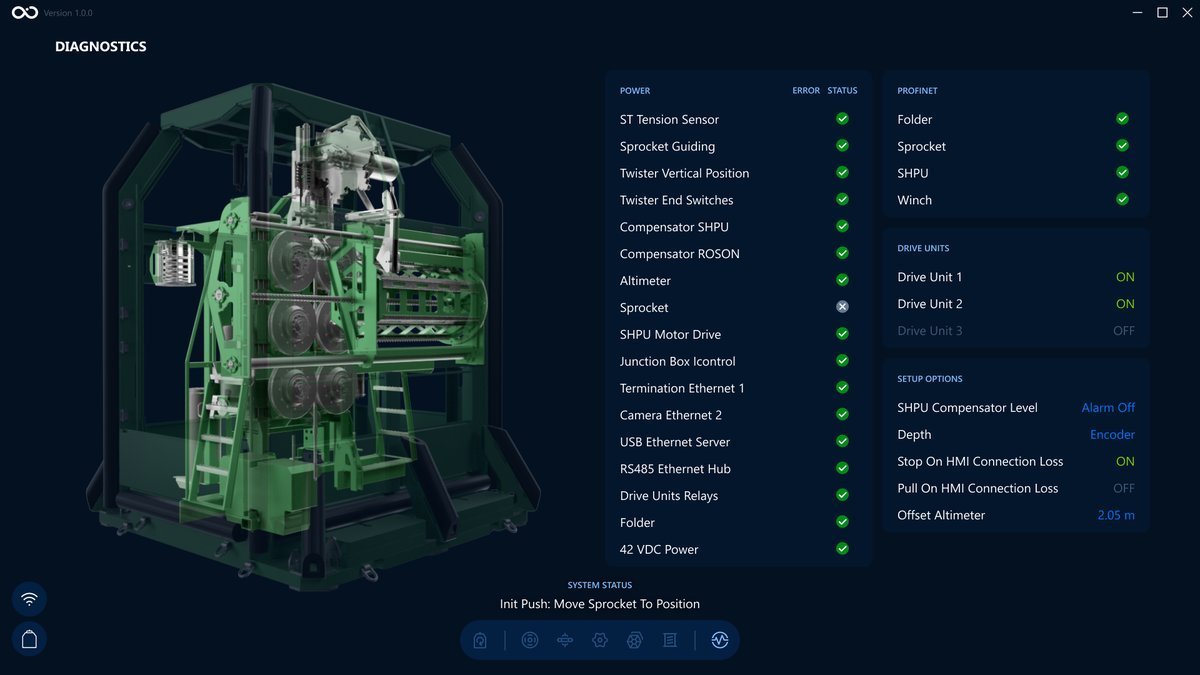
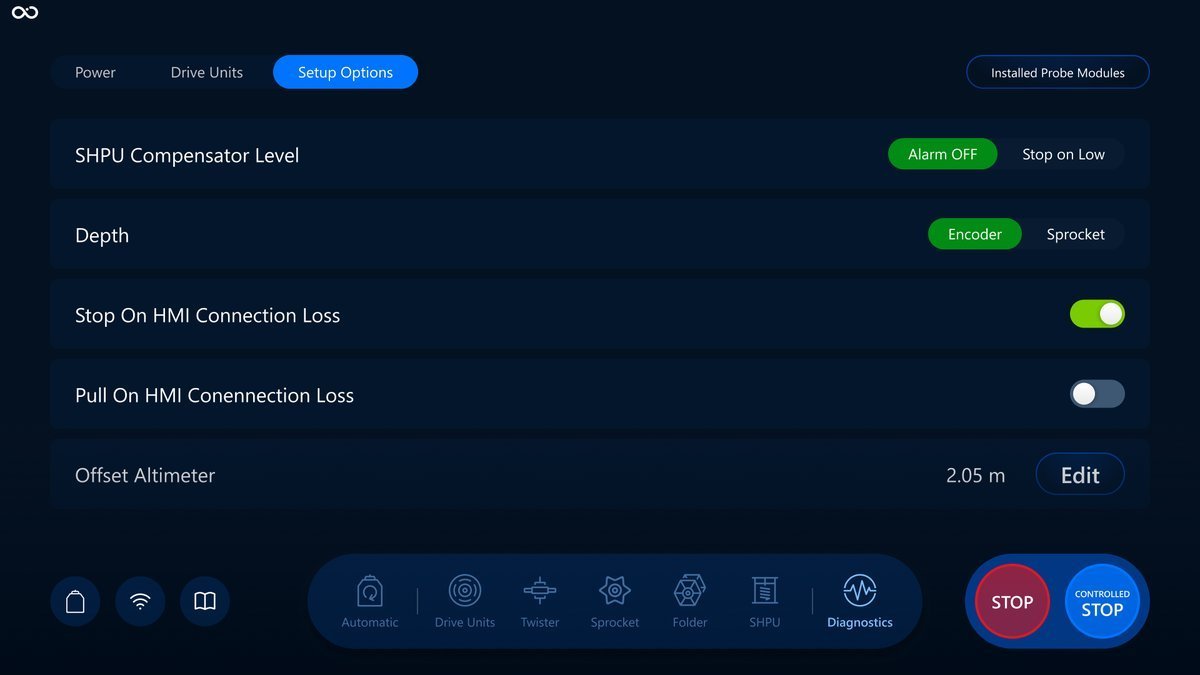
The value changed to "2.05m" on the Visualization screen and on the label next to the "Edit" button:
Installed Probe Modules
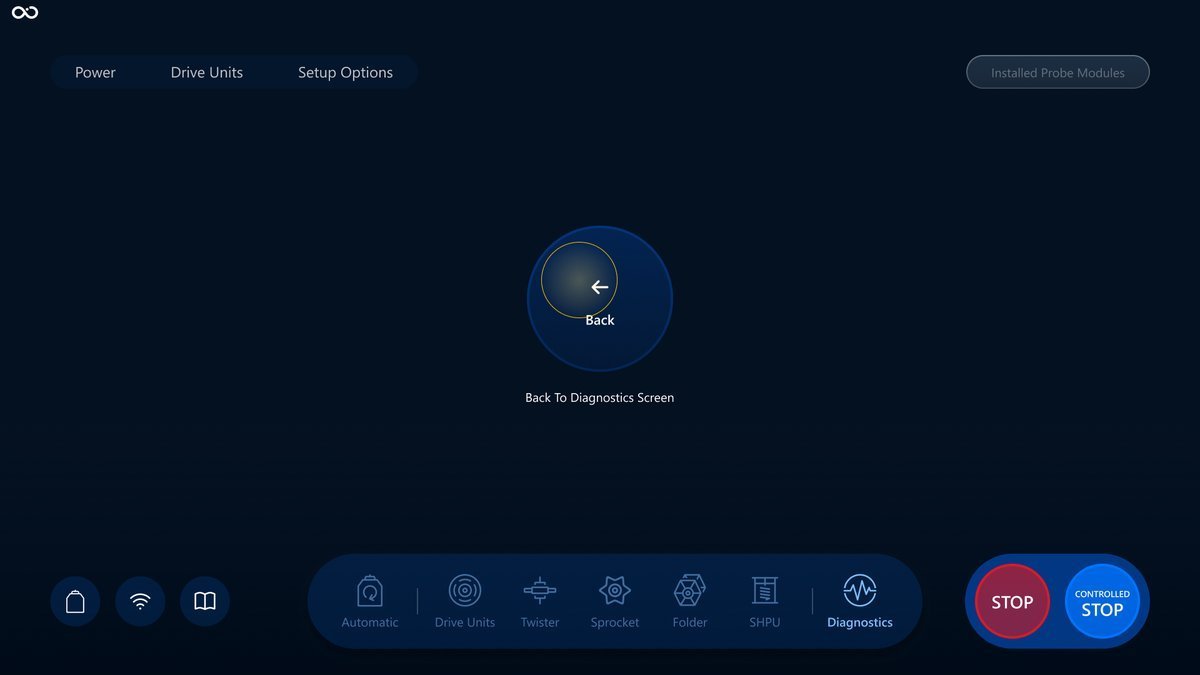
The button opens the modal on the Visualization screen with the modules installed in the Roson. The button is enabled if there is an active connection to ROSON.
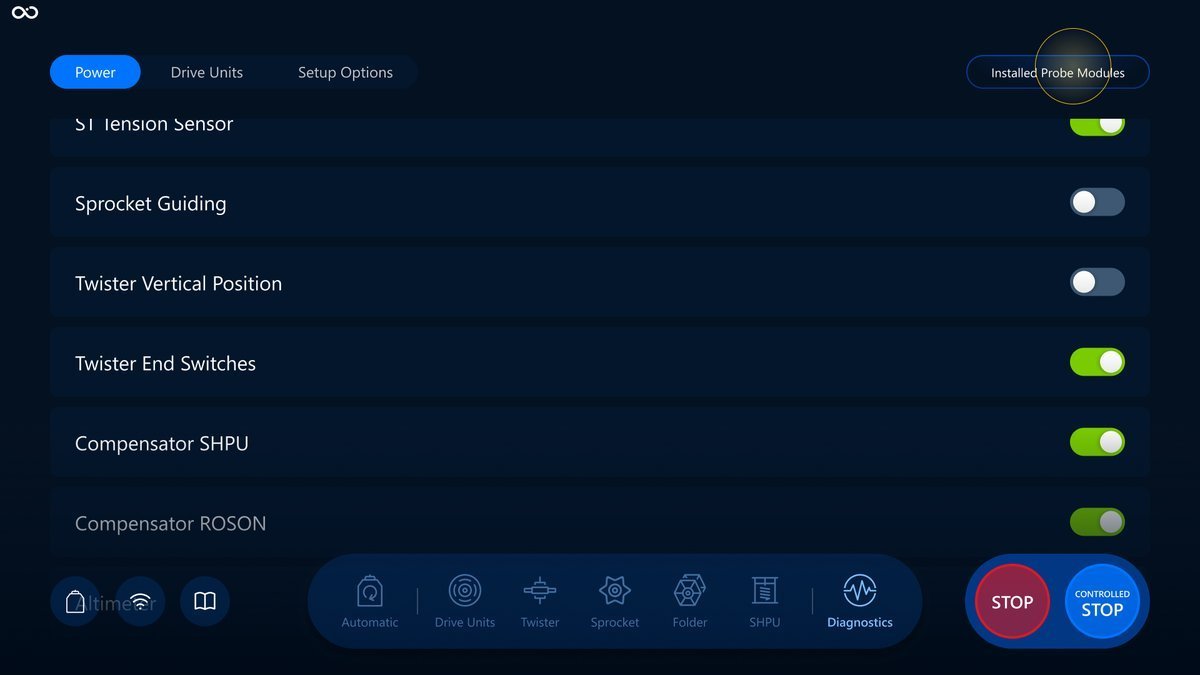
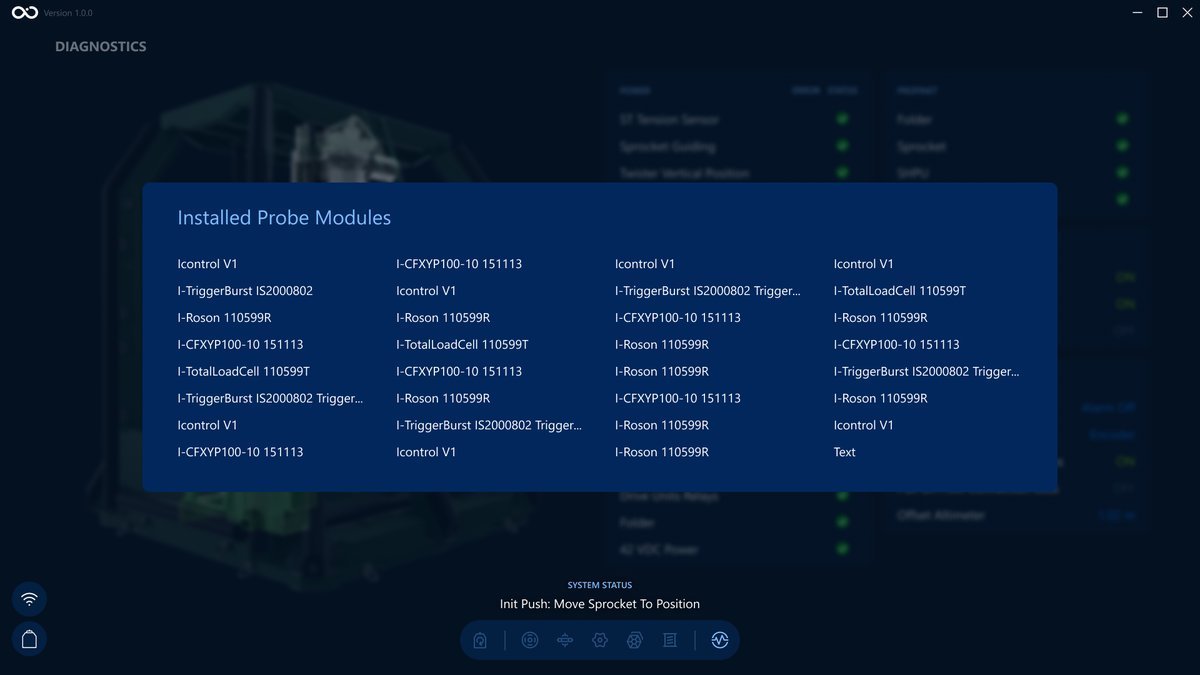
To close the modal tap the Back button which will be displayed right after you open the modal.
What's next?
Feel free to have a deeper dive into the Network section by following this link: Network overview.
Network Interface
In this section, we will discuss how network issues can affect an operation so that you are prepared to handle the situation properly may it arise.
Network panel
This is where you can track the status of the connections between Vessel and different systems.
Tap the network icon to open the network panel:
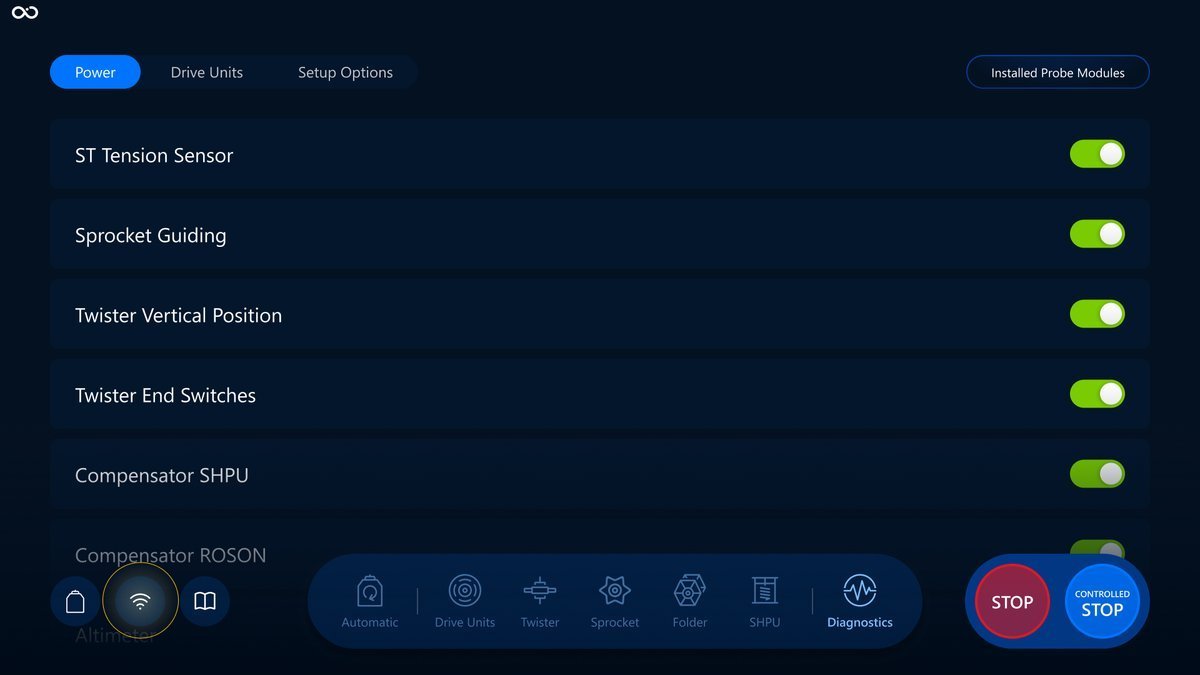
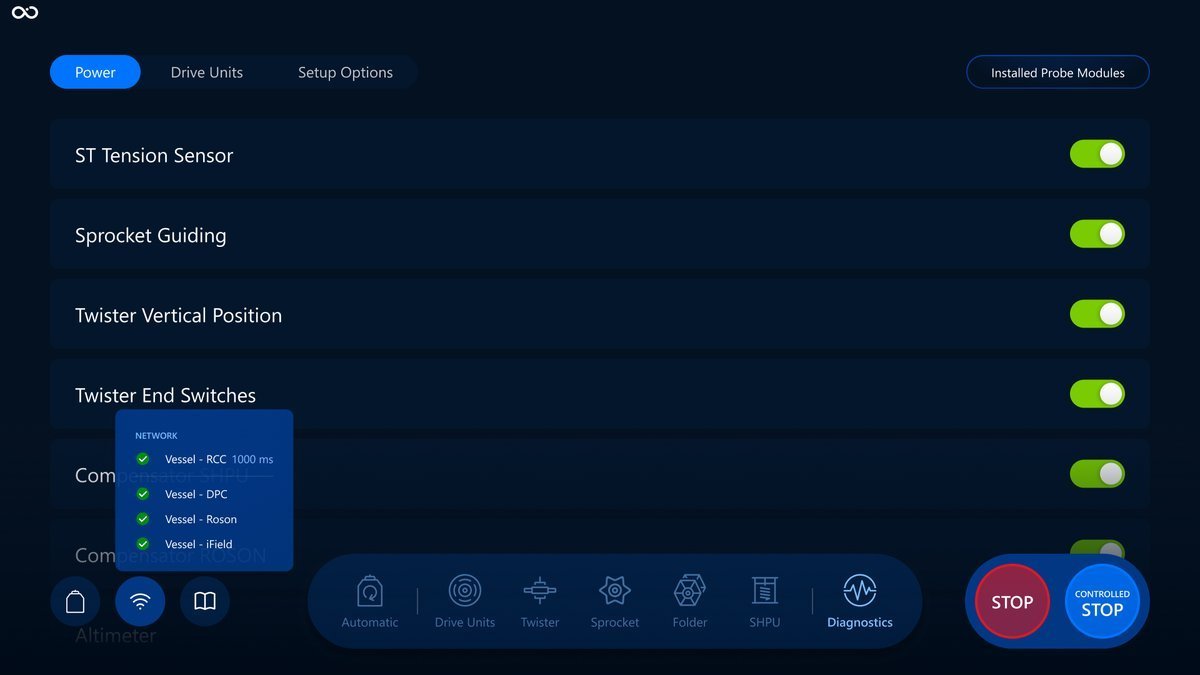
Opened panel on the Visualization screen:
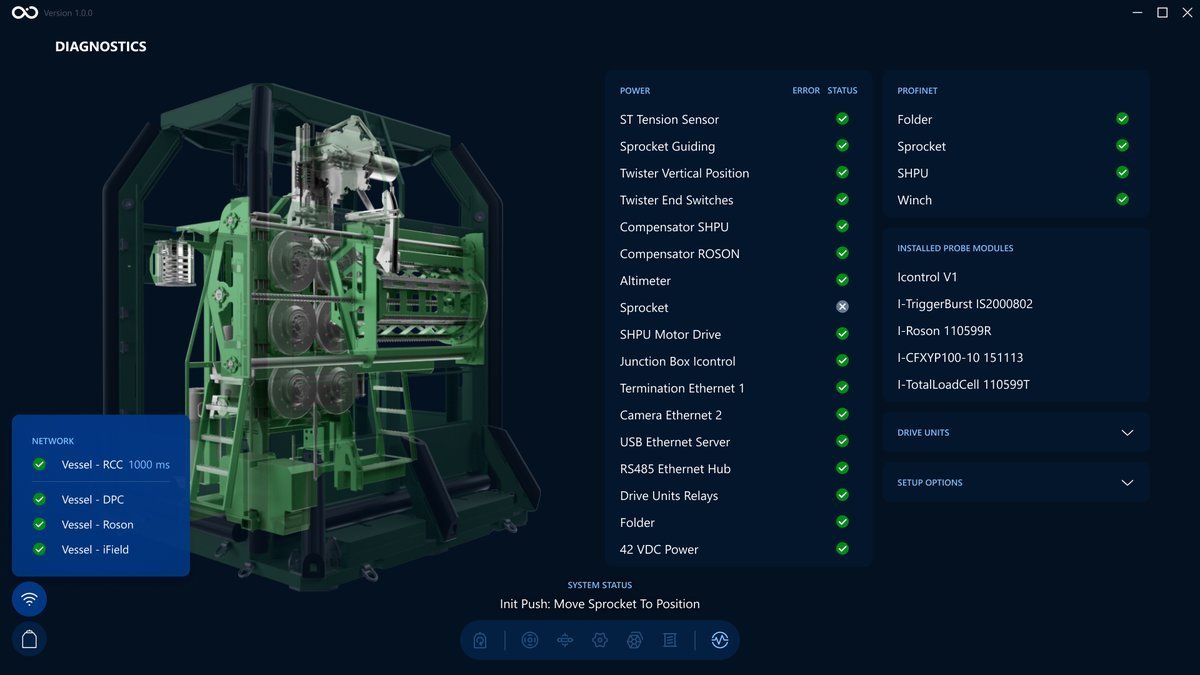
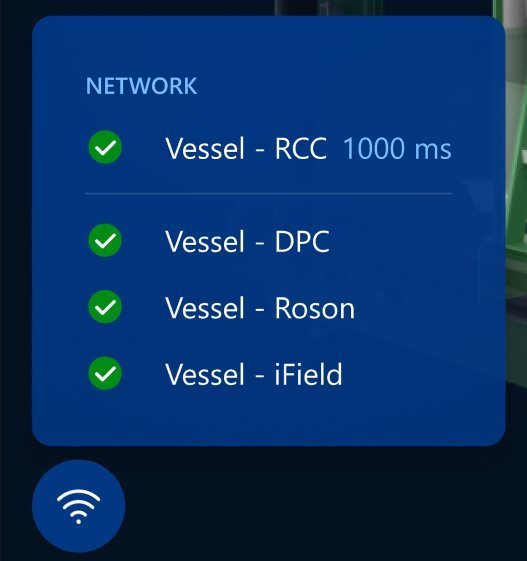
The next picture represents all the connections and statuses. The icon on the left side shows the status of the network connection.
In case of a connection loss, the button that opens the panel and the respective icon will change to error:
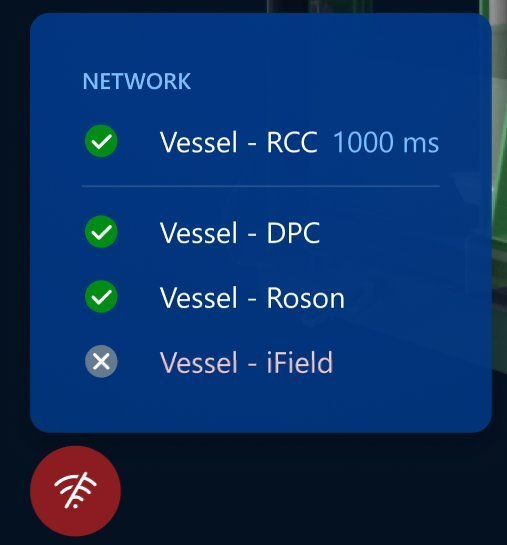
Connections
Throughout an operation, you may experience connectivity issues between all software related to CPT execution. This section aims to describe each connection and what happens to software once a connection issue appears.
| Connection | Description | No connection Impact |
|---|---|---|
Vessel - RCC |
Represents the connection between CPT Vessel software and Remote Control Center. This connection provides additional information about the latency placed on the right side.  |
|
Vessel - DPC |
Represents the connection between CPT Software and DPC.  |
"Recover CPT" and "Accept (DPC State Change)" buttons will be disabled. All CPT controls are enabled, as controlling the CPT will be feasible without DPC connection. |
Vessel - Roson |
Represents the connection between CPT Software and Roson HMI.  |
All controls are disabled, as connection with OPC Server failed and no commands can be sent. IField software is enabled; however, executing a new test won’t be possible since controlling the Roson is not possible. |
Vessel - IField |
Represents the connection between CPT software and IField.  |
All controls are enabled, as controlling the CPT will be feasible without IField connection. IField software is not possible to control. |
To address any network issues, contact Service Desk or Support Team.
Network issues during an operation
There are three ways the system behaves during Network issues.
-
If there is Network issues as in the screenshot below, network icon should be red to alert the user there is at least one connection issue.
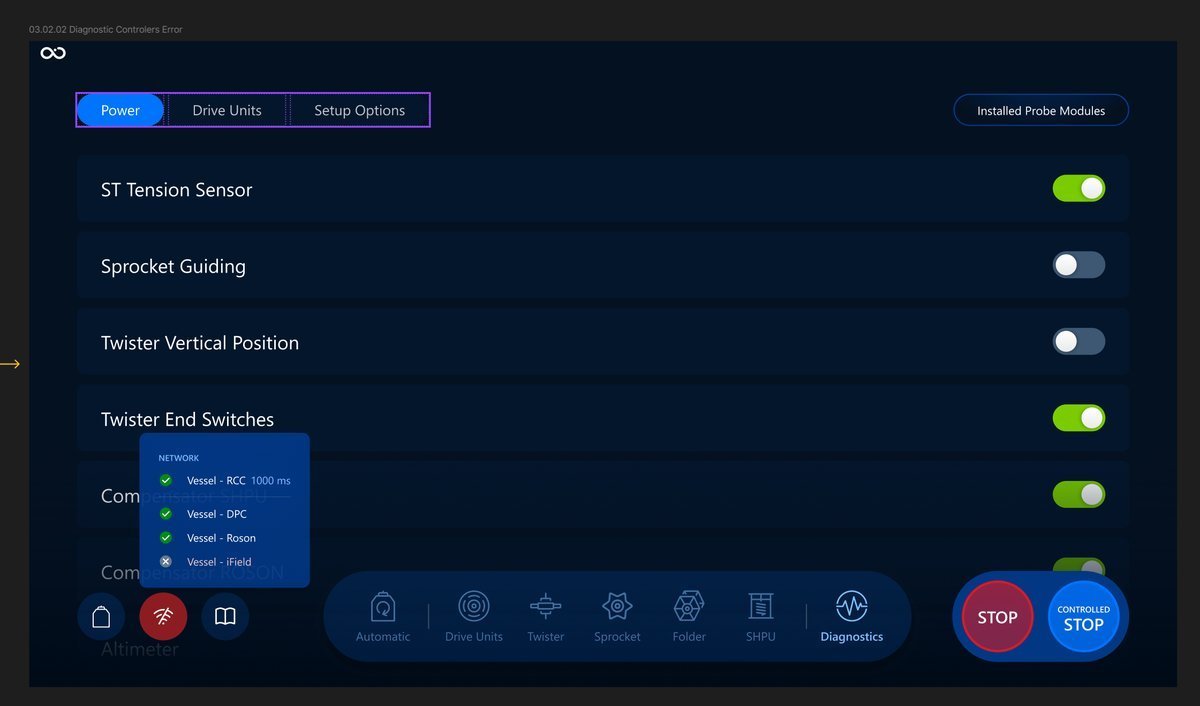
-
If there is no connection with Roson, all the buttons are disabled, meaning it is not possible to click them.
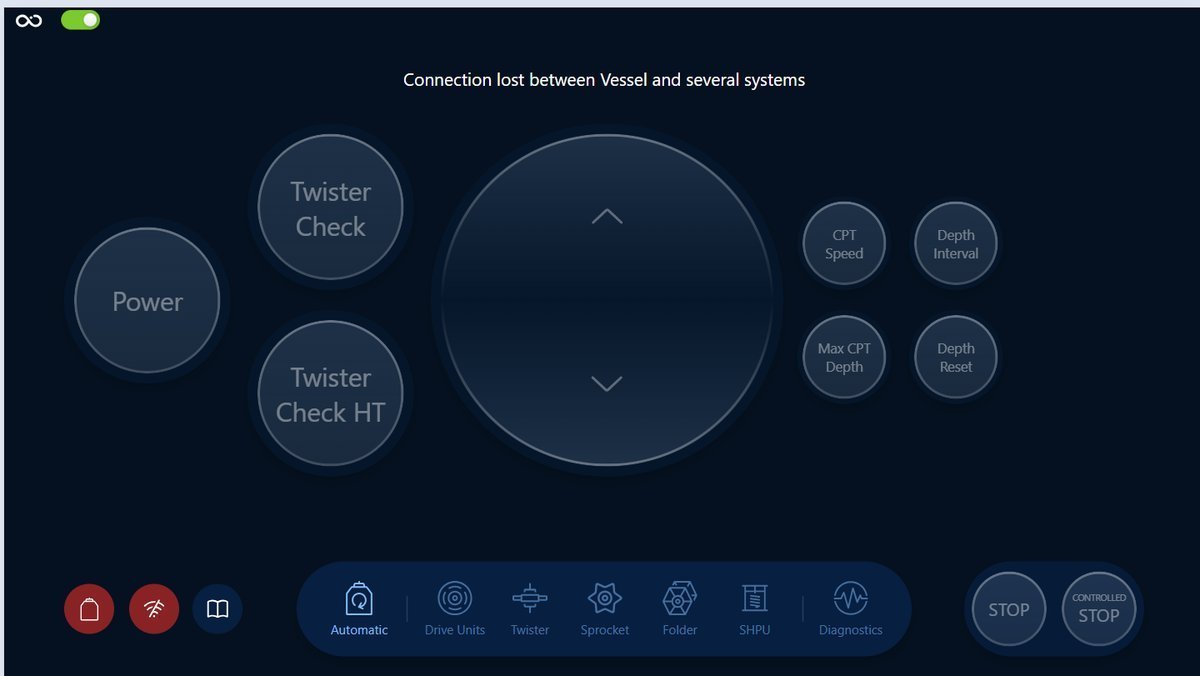
-
If requested action fails the corresponding button becomes yellow and the system message appears.
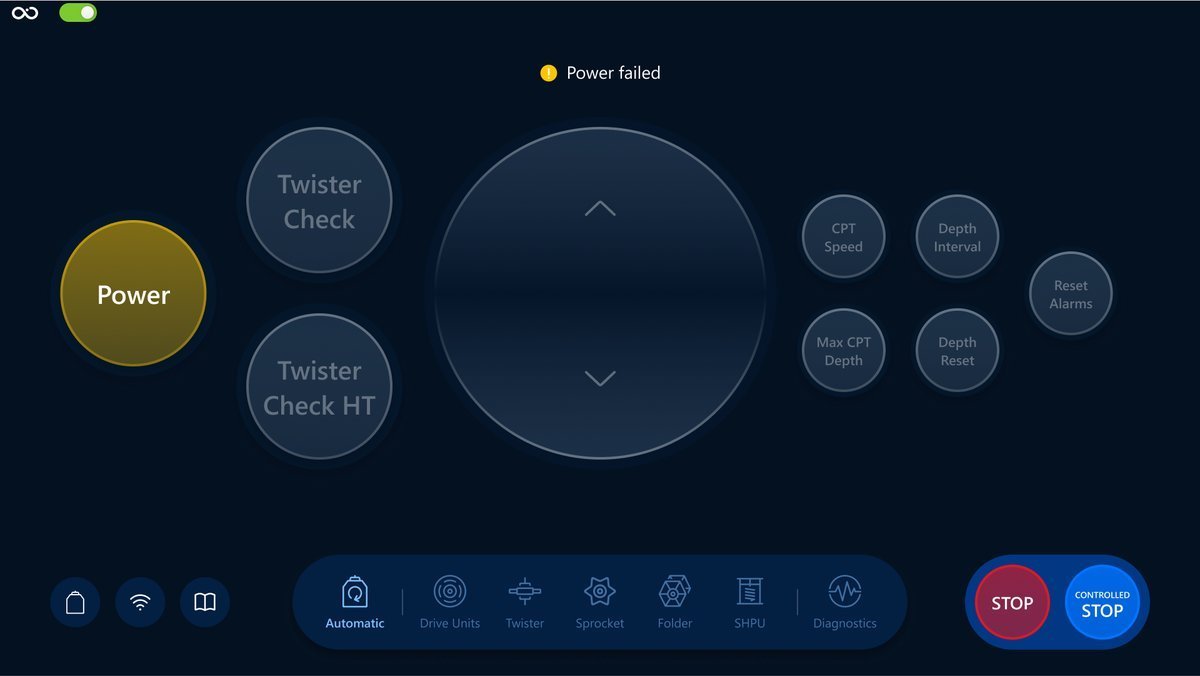
After 3 seconds the button should switch to normal state:
Next section
In this section, you've learned about the network issues and how to work with them. Feel free to move on with the DPC Integration.
DPC Interface
This section will look closer at the DPC and how to use its controls.
What is the DPC?
The OI Armada Dynamic Payload Control (DPC) System operates and monitors payloads deployed from the OI Armada fleet of Unmanned Surface Vessels (USVs). This knowledge base contains information pertaining to DPC system software, including relationships with external systems, as well as developer and end-user information to provide a comprehensive OI Armada DPC information database.
The chosen method for communication with DPC is using states, for each part of the launch and recovery process. The DPC provides the current state and target state to the payload, and the payload uses these states to determine any checks that should be completed. The payload provides the state it is configured to be in and the system's health.
Modal usage
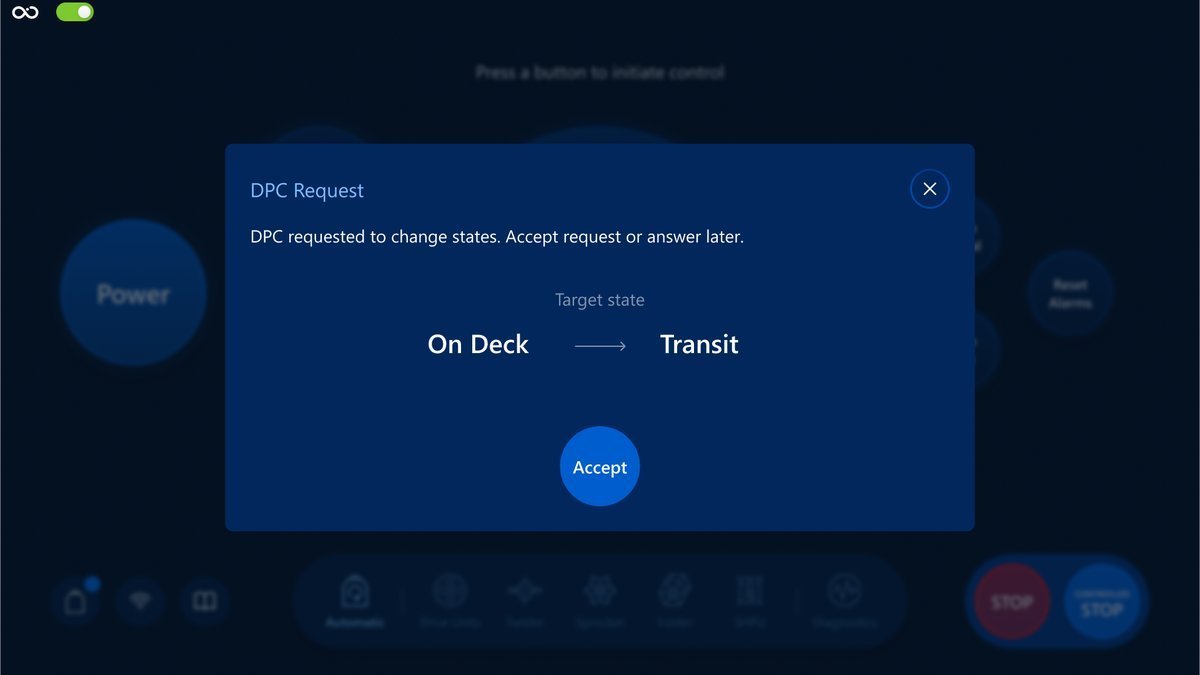
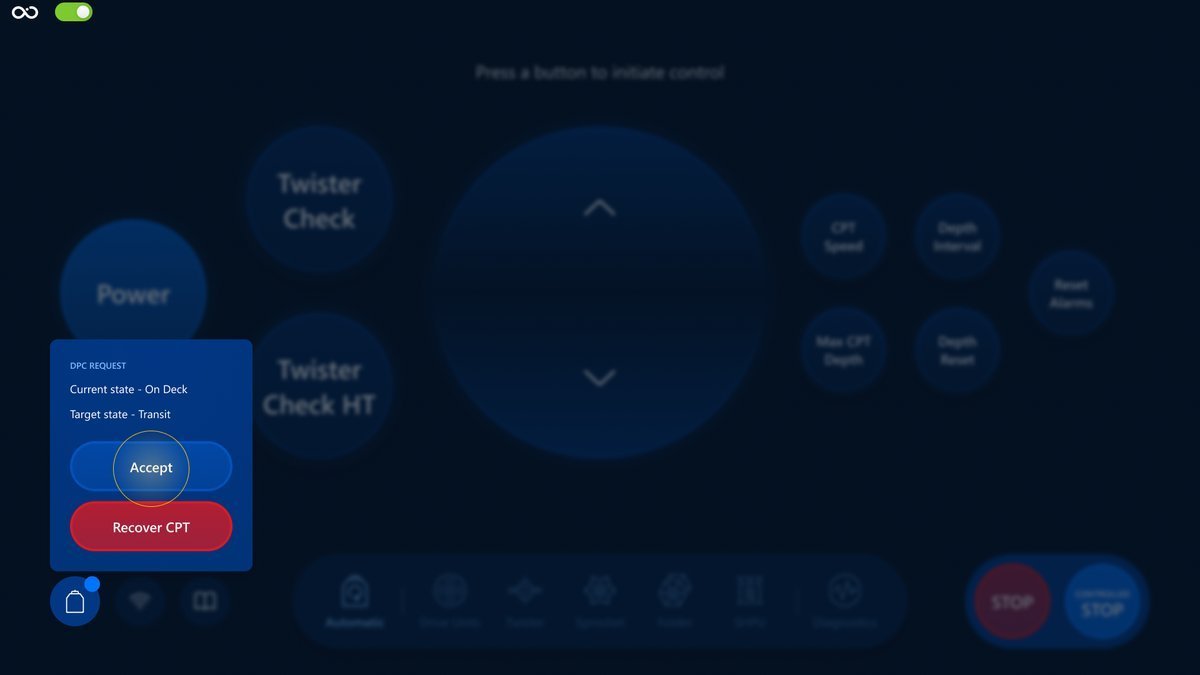
Once DPC requests to change states, the modal will appear on the screen:
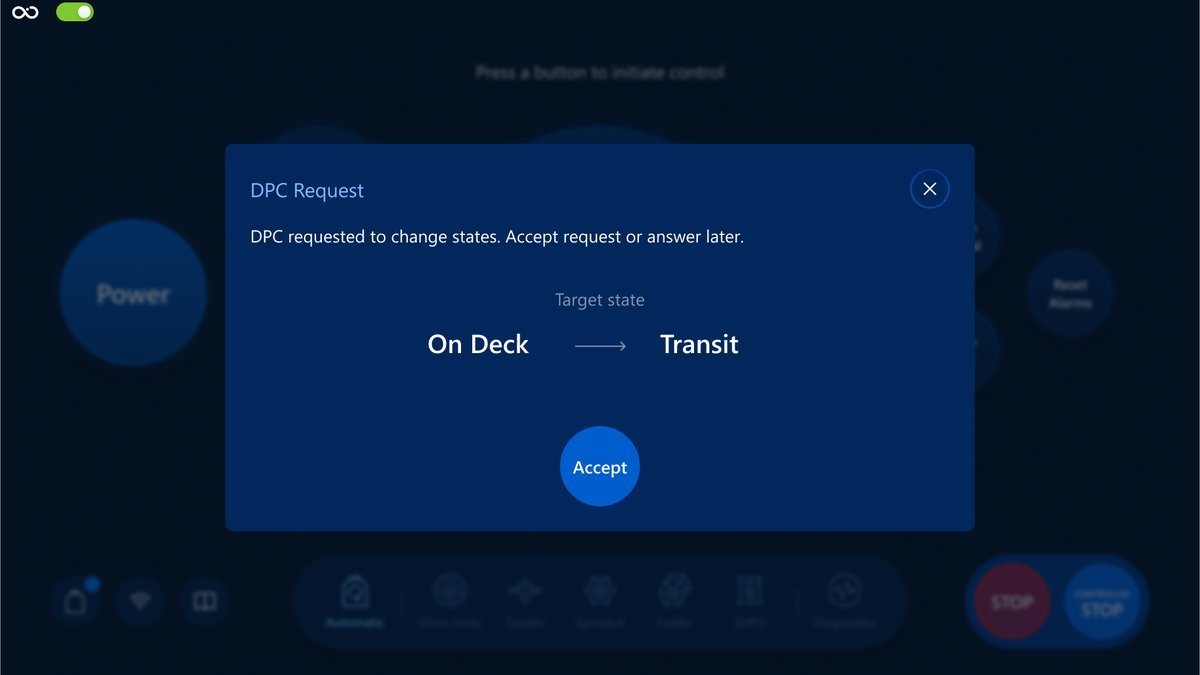
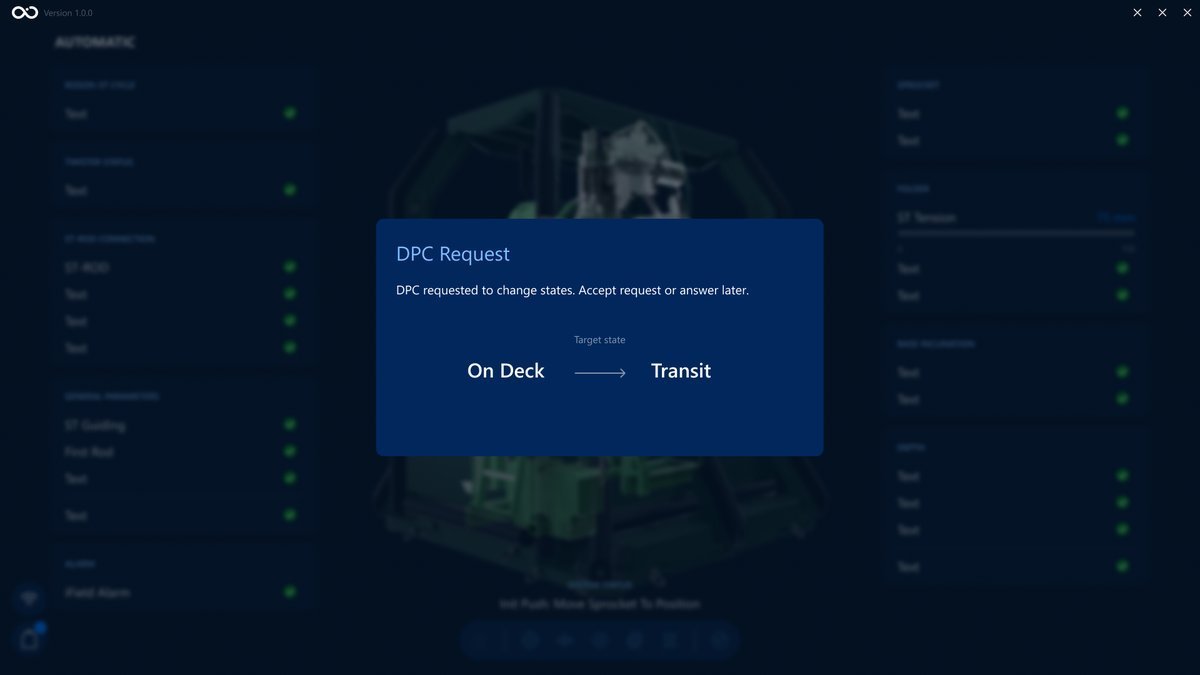
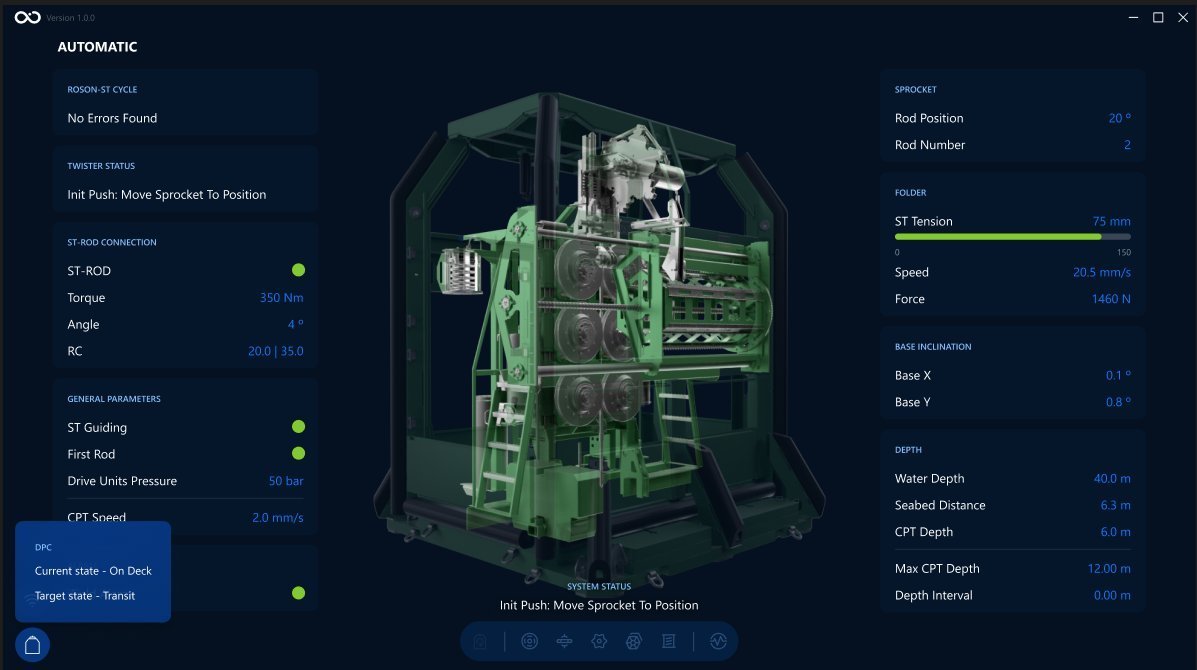
Visualization screen:
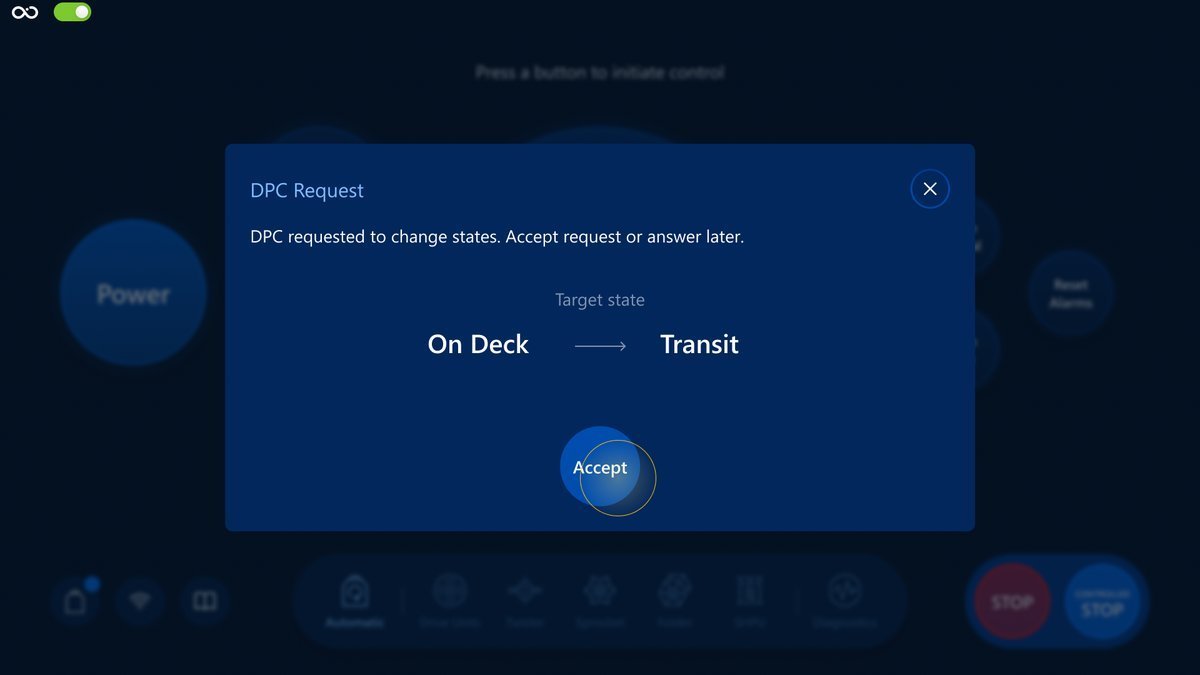
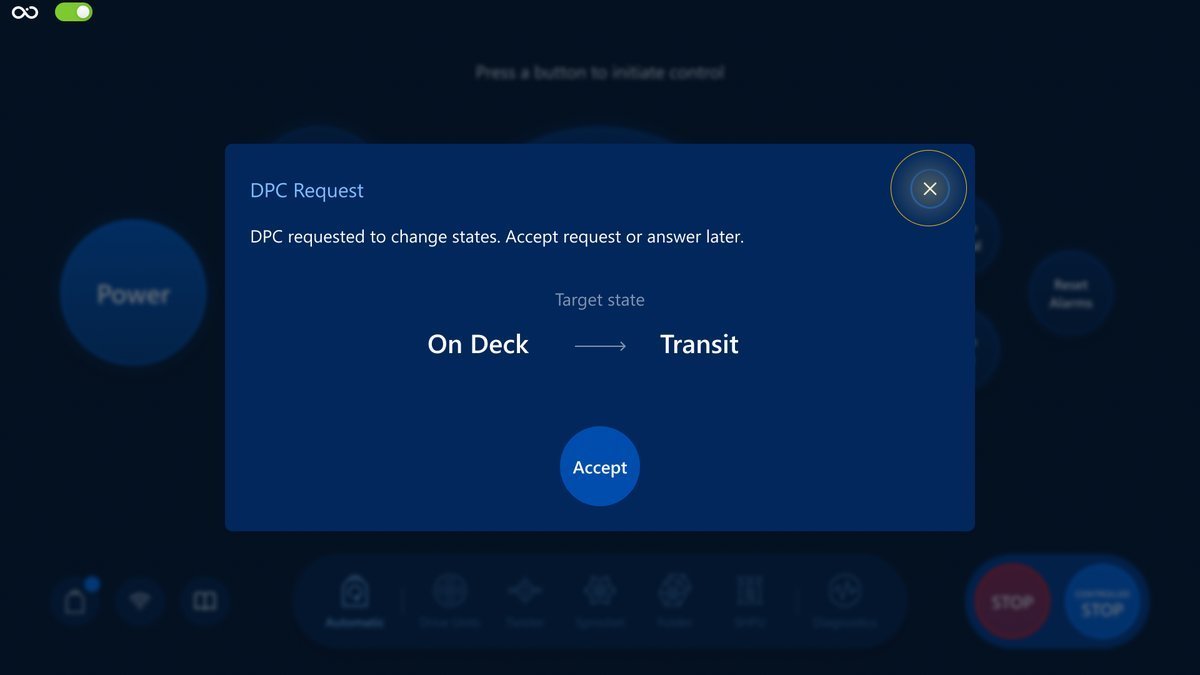
Tap the Accept button to accept the DPC request or close button to answer later.
The modal will be closed automatically once the Accept message is sent:
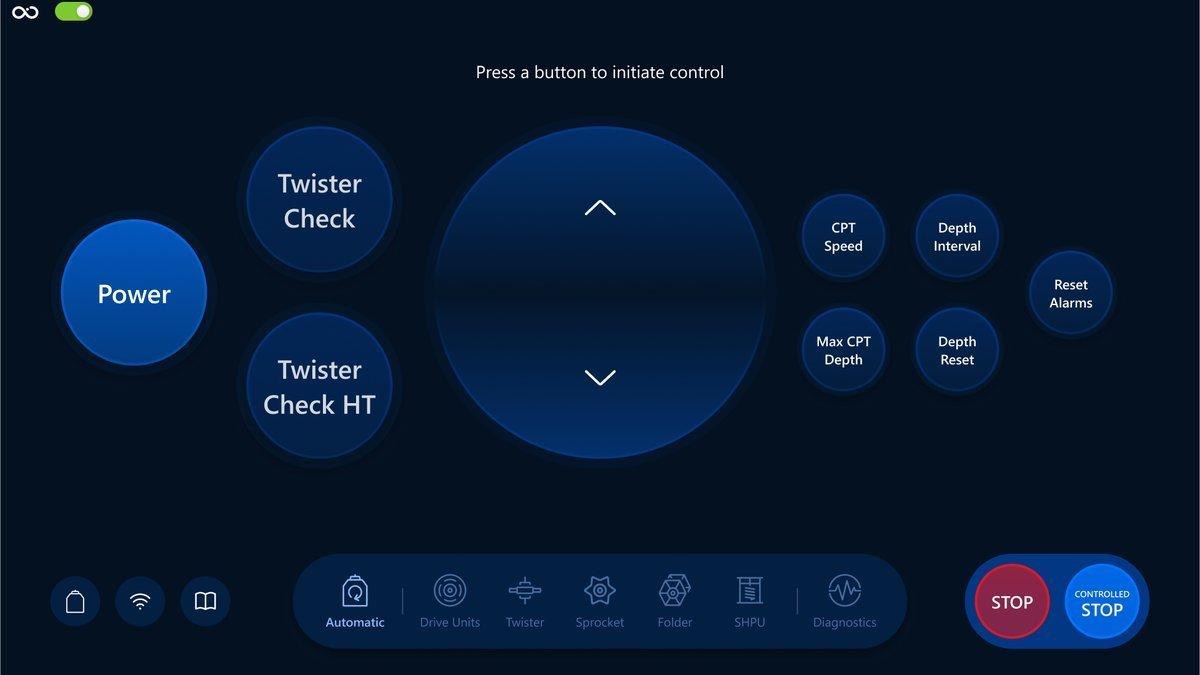
Also, you can see that the notification is cleared near the DPC button since the request was successfully accepted.
Request pending -> notification displayed:

Request accepted -> notification cleared:

If something goes wrong, you will see the Accept button colored yellow for 3 seconds. After that, it turns back to a normal state, and you can try to accept the request again:
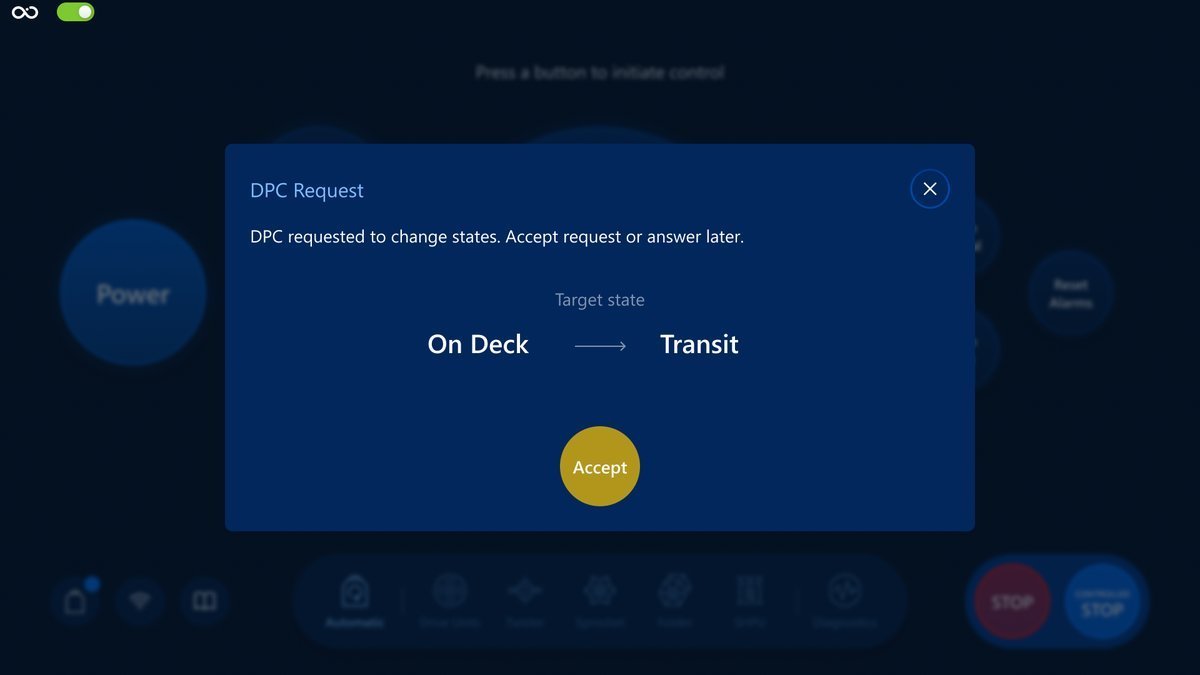
If you need to close the modal and answer later, just tap the close button. The request can be accepted through the DPC panel:
DPC panel usage
Besides accepting the request, the DPC panel provides other options, like Recover CPT or Cancel Recovery.
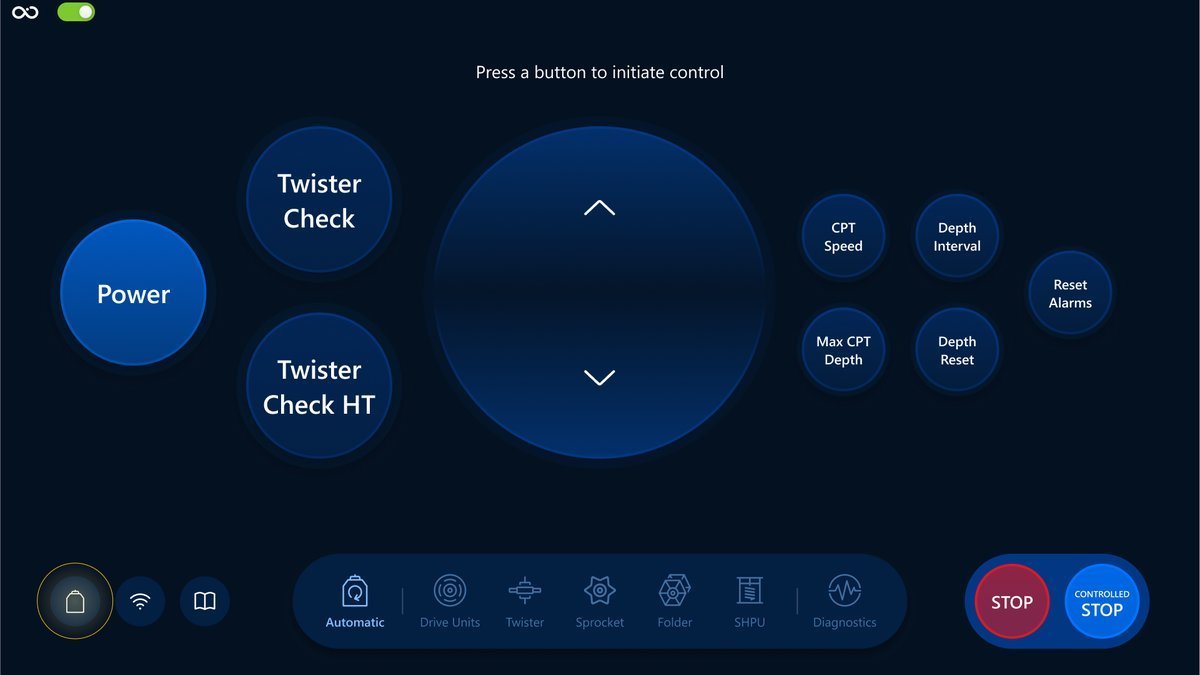
To open the panel tap the DPC button:
Accept
Accept button serves the same purpose as the button in the modal. Just tap to accept the request. After the request is accepted, the Accept button should disappear:
Visualization screen:
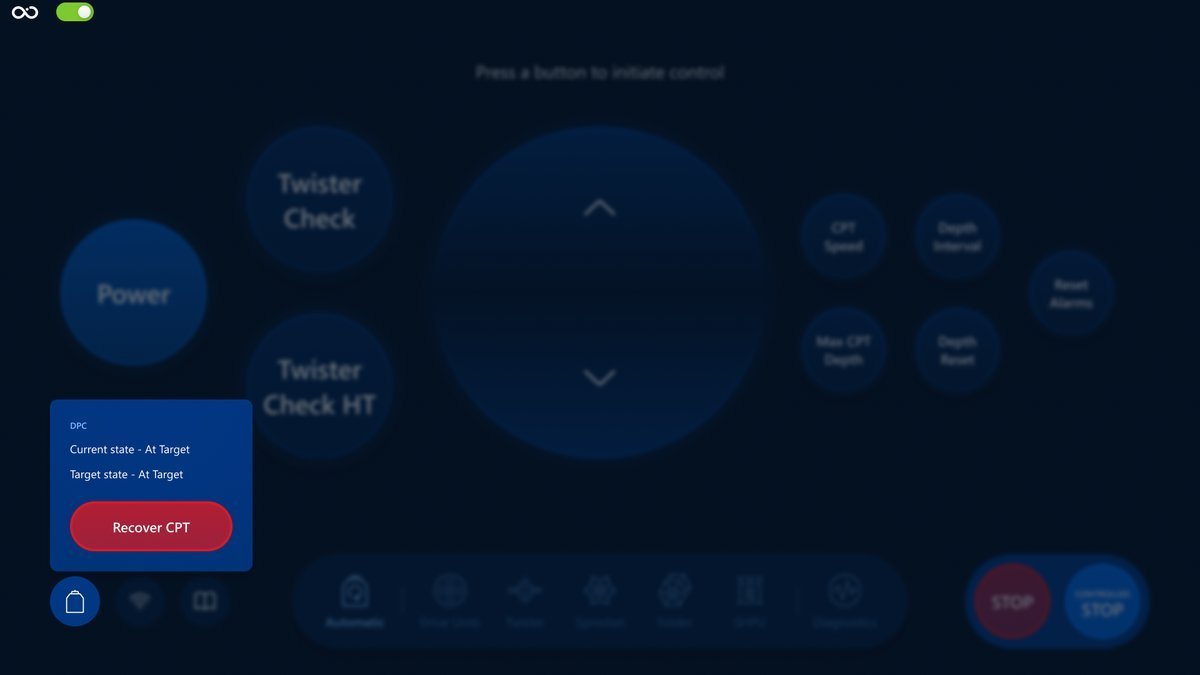
Recover CPT
Recover CPT should be used to inform DPC that an issue has arisen on the Roson that makes it unable to proceed with the operation and requires to be recovered back to deck.
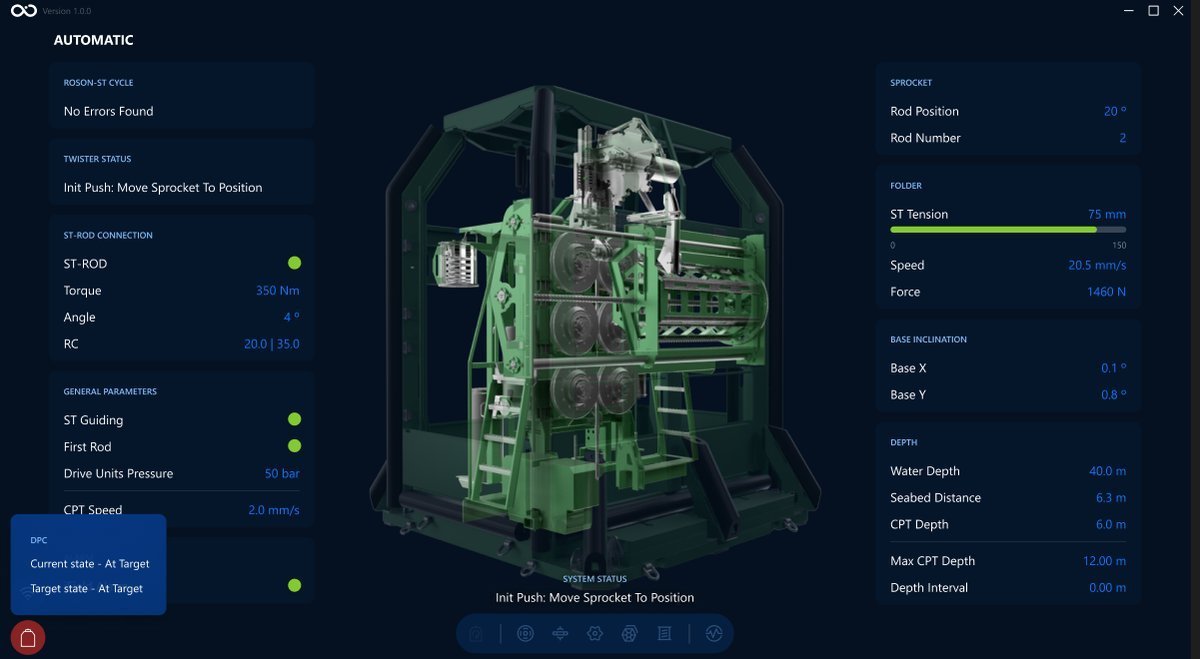
The DPC connection icon turns red when the Recover CPT is active.
Tap the Recover CPT button to start the recovery. If the recover command was sent with success, the Cancel Recovery should appear instead of Recover CPT:
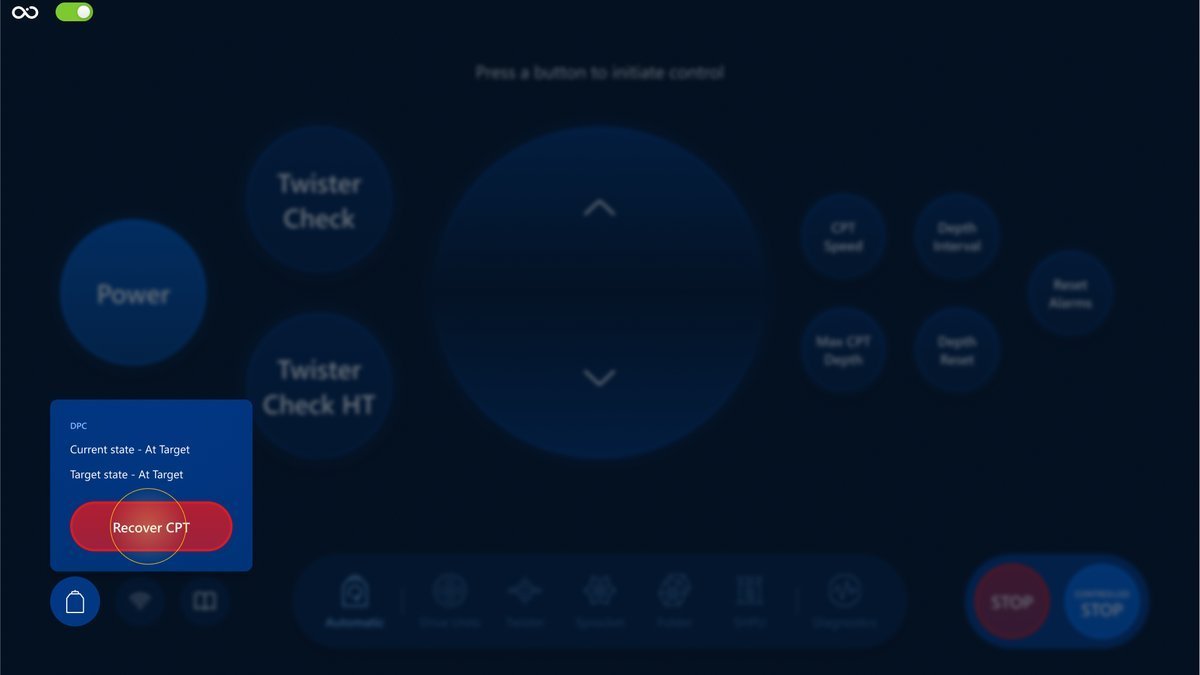
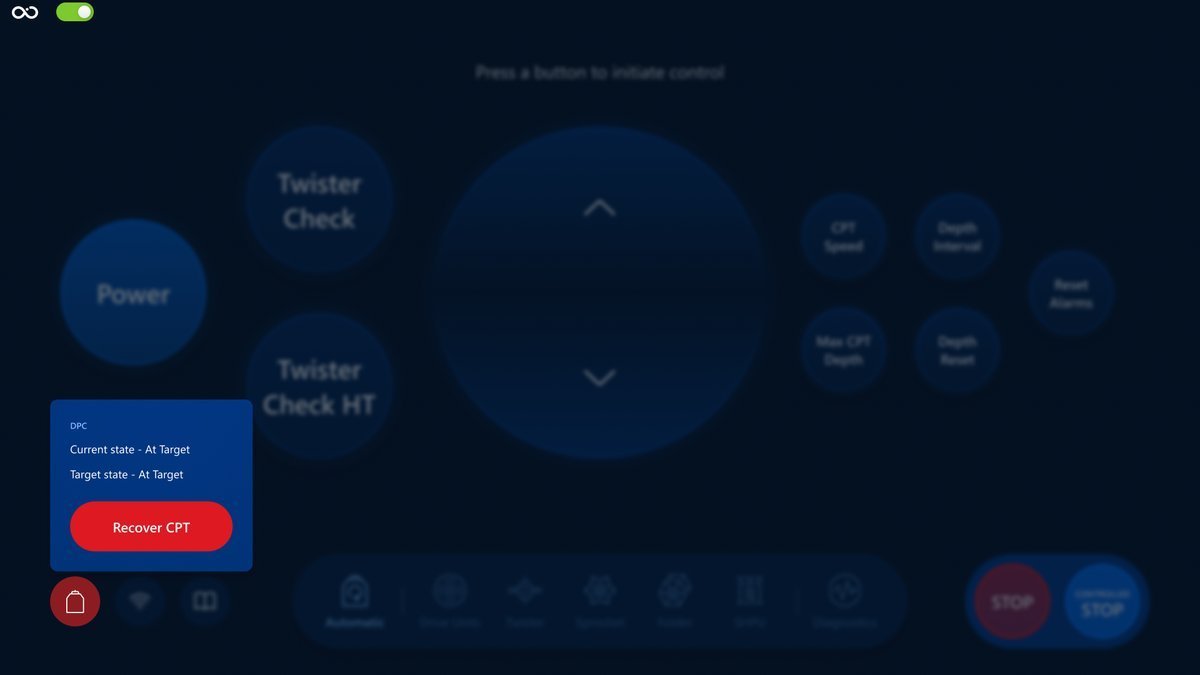
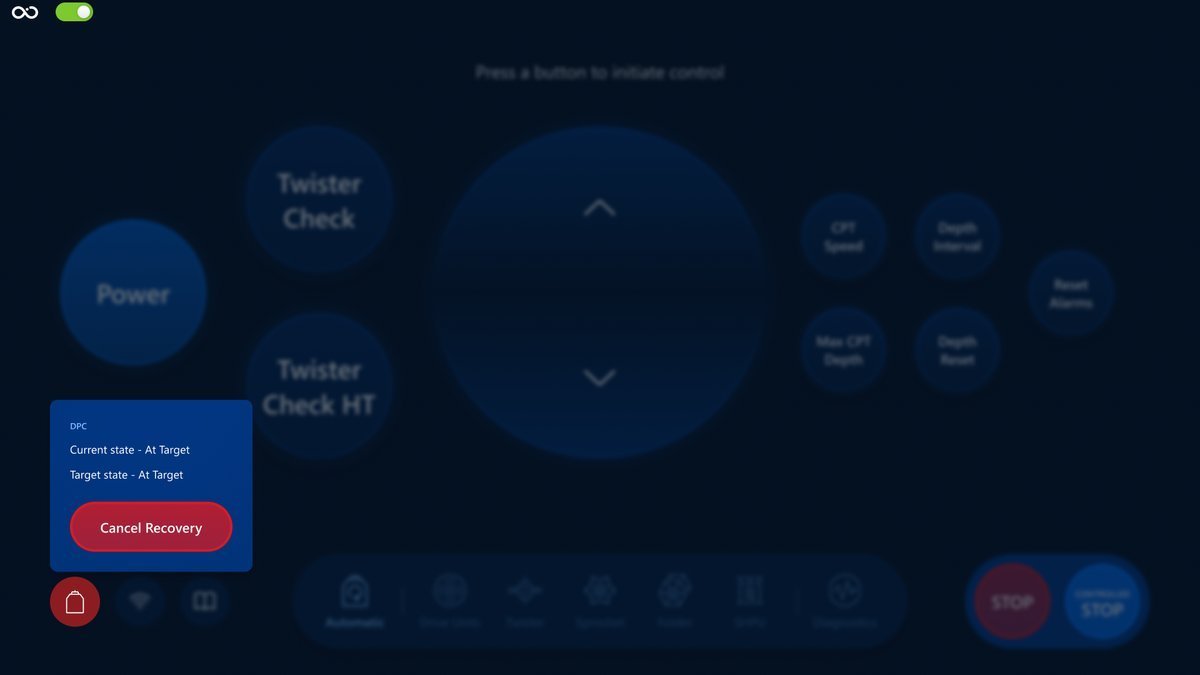
Visualization screen:
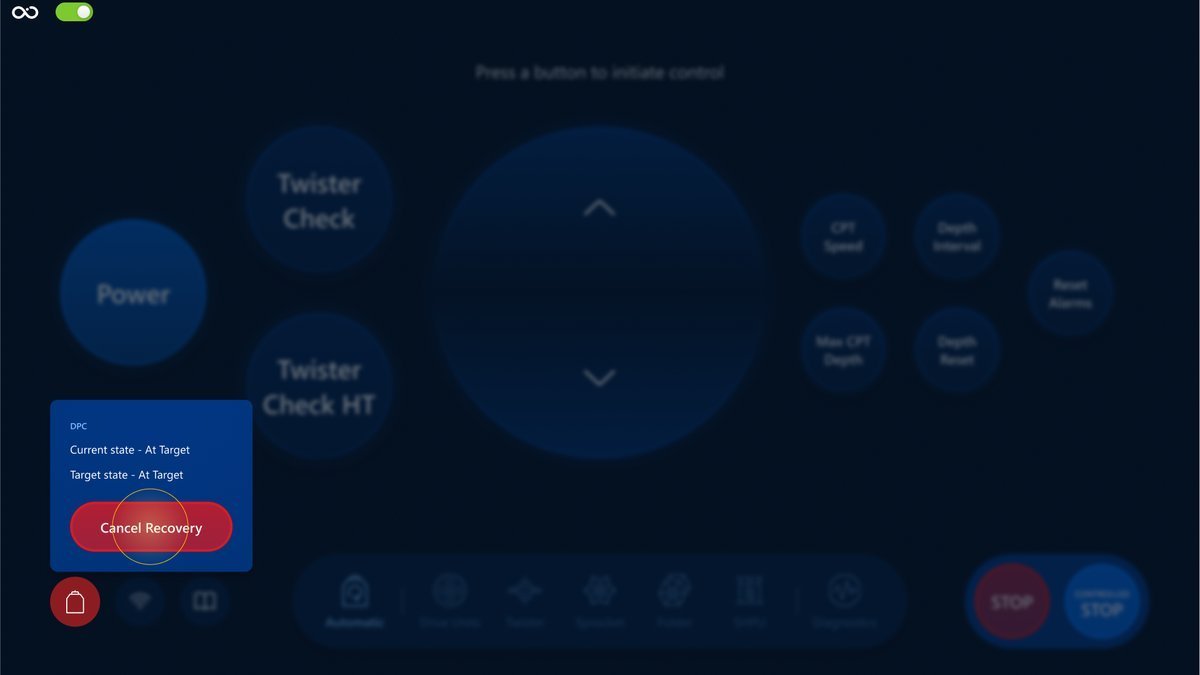
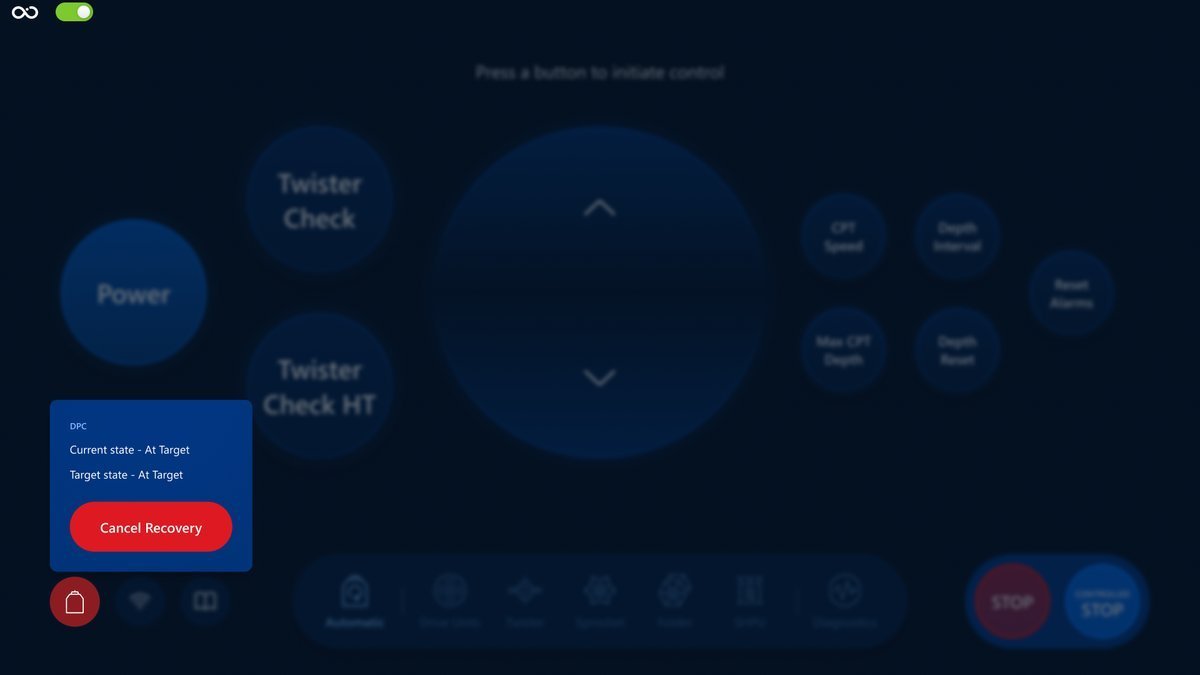
Cancel Recovery
Cancel Recovery is used to inform DPC that the issue is no longer present and we can continue the operation.
If the Cancel Recovery command was sent with success, the Recover CPT button should appear instead of Cancel Recovery:
Next section
In this section, you've learned about DPC Integration and how to use a panel with a modal. Feel free to continue the reading in the Troubleshoot section.
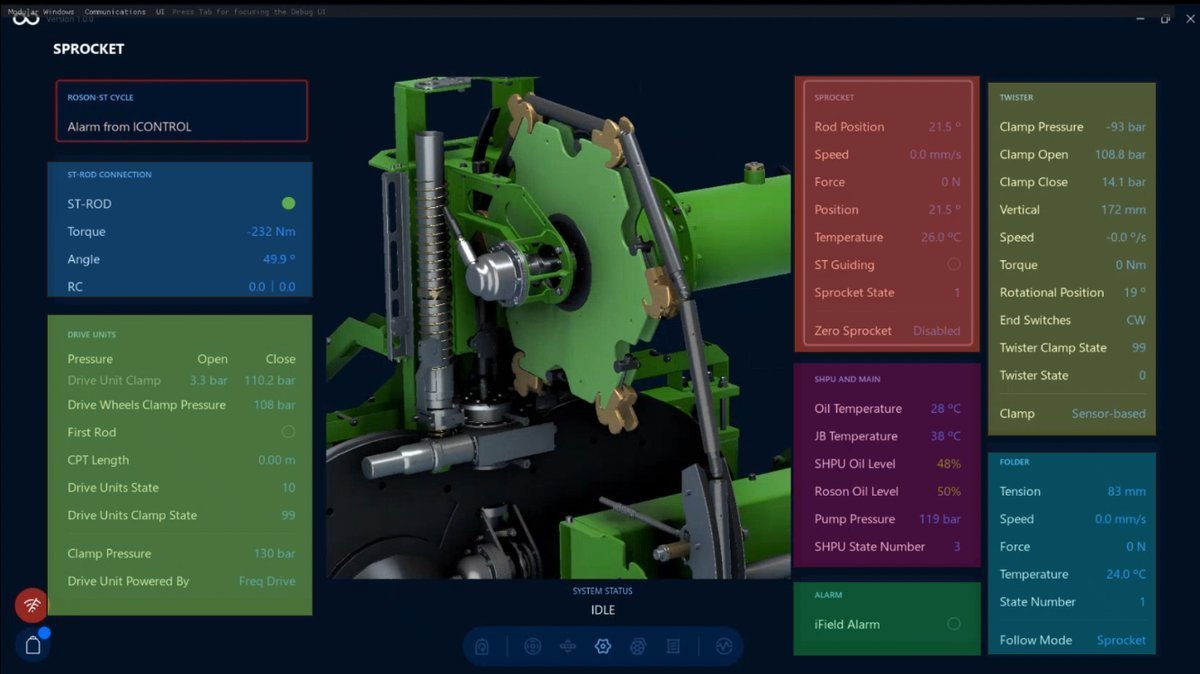
APvdB Screen Map
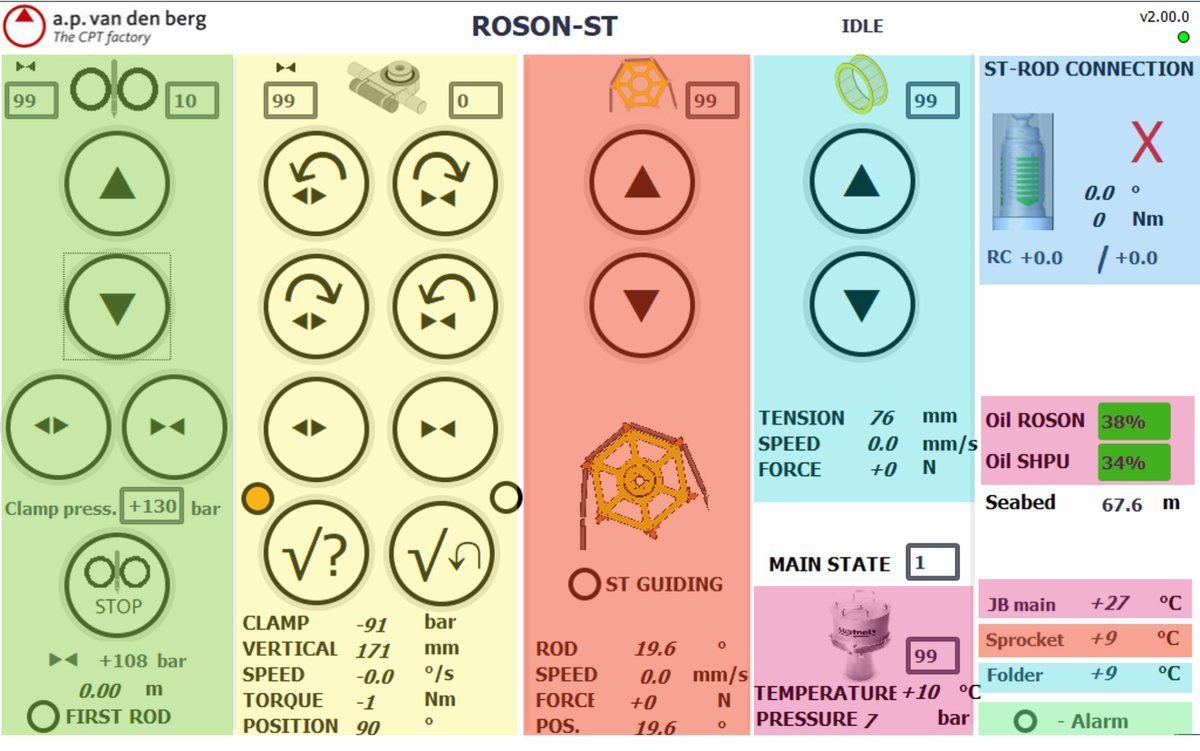
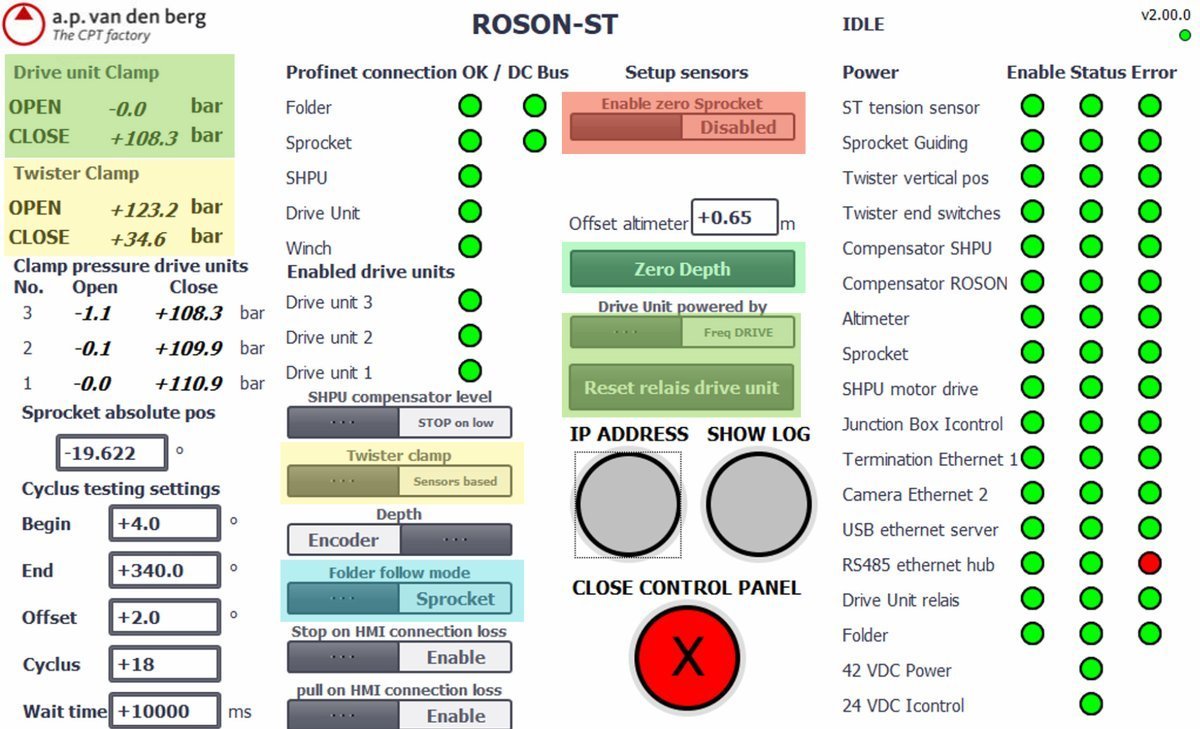
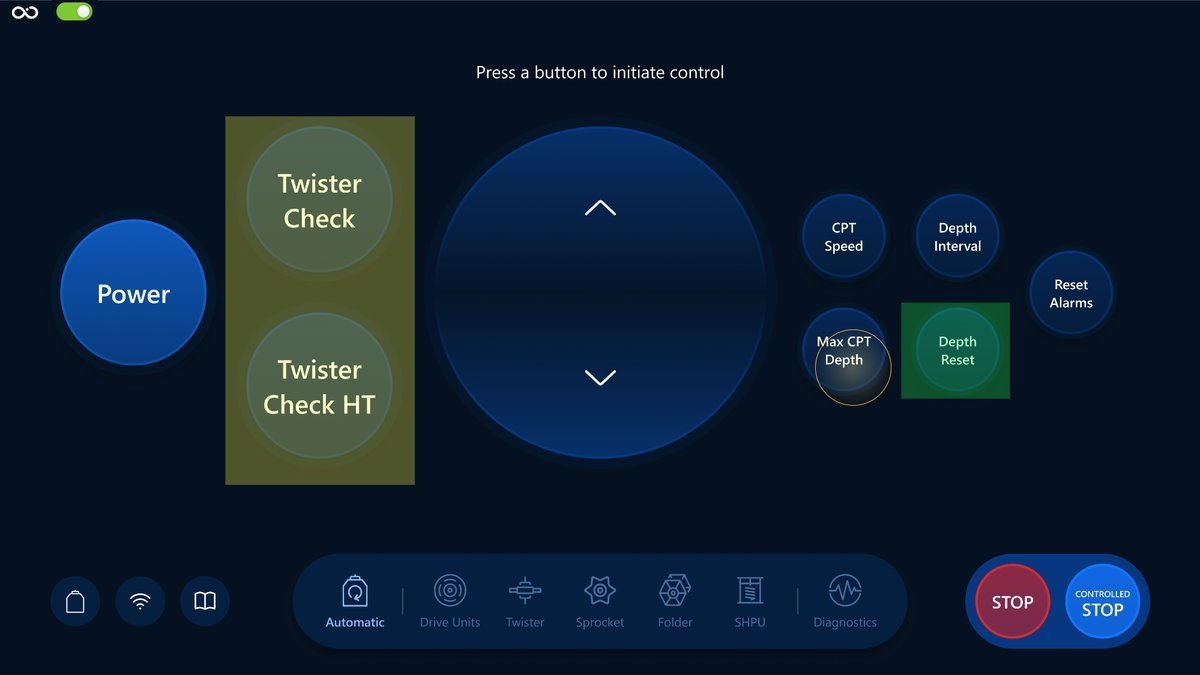
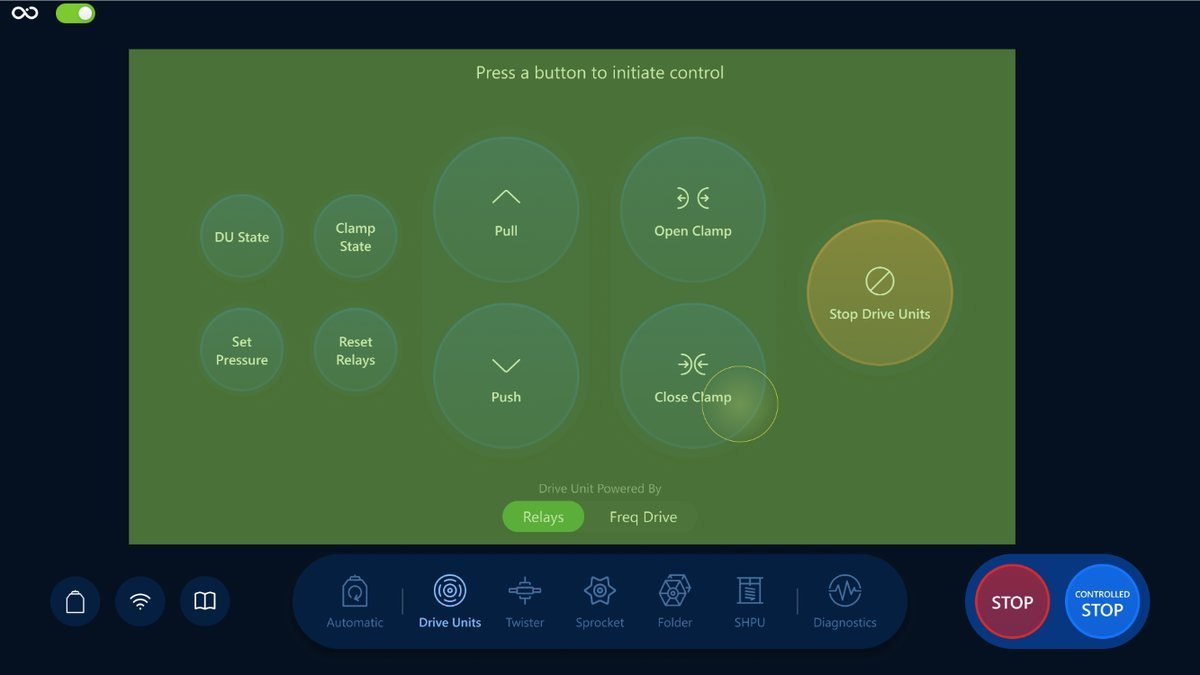
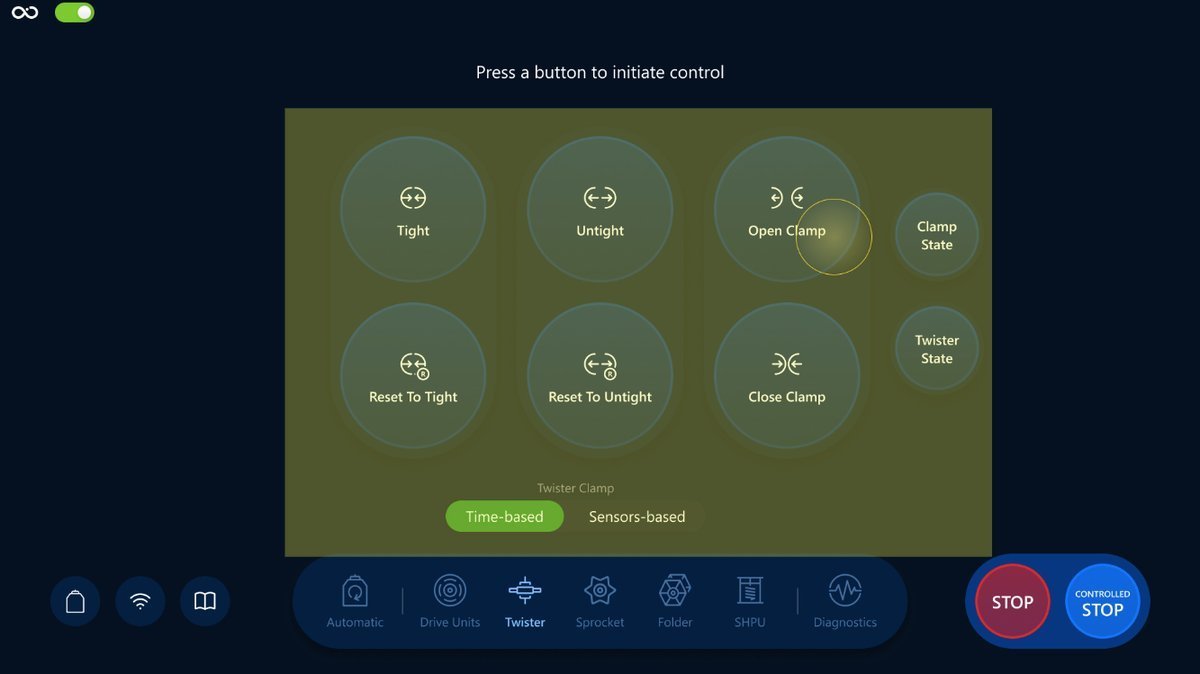
Mapping Between APvdB HMI Control and CPT Remote SW Control
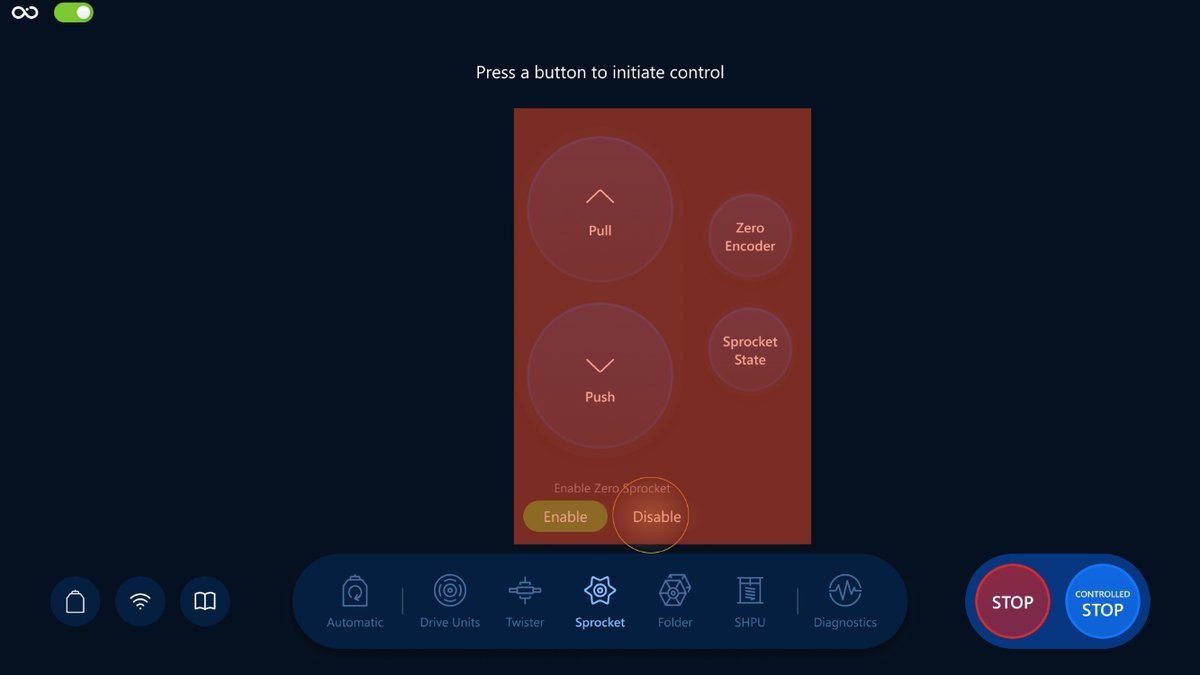
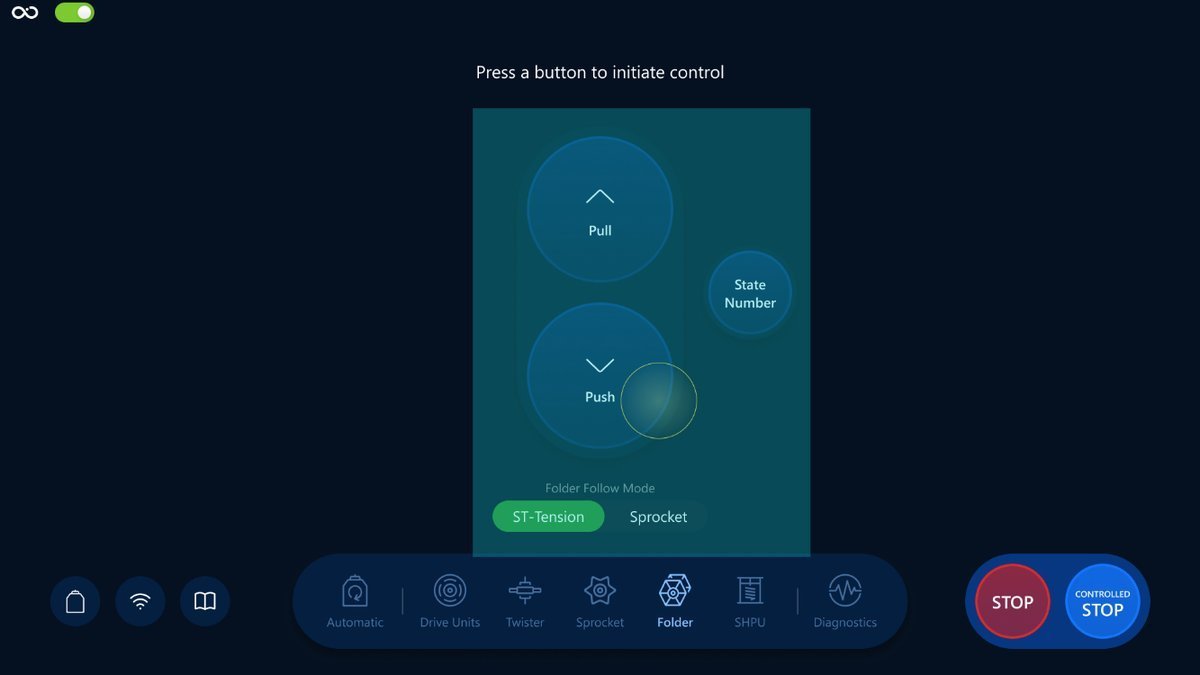
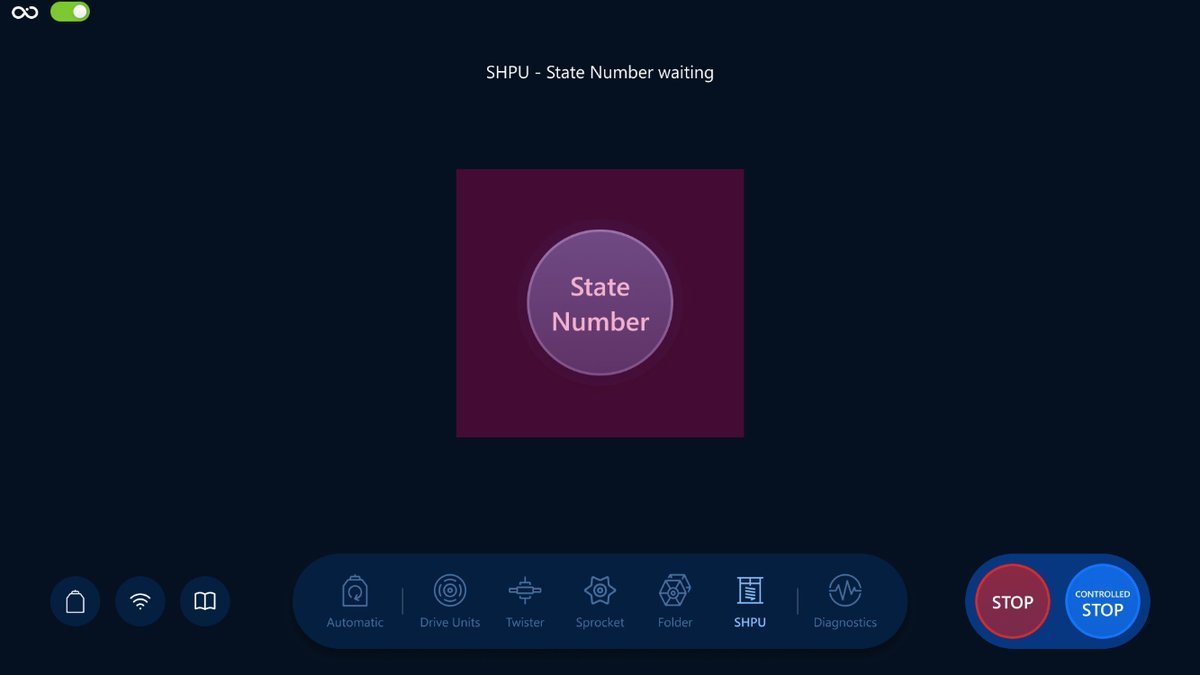
This section covers the mapping between the APvdB HMI Control software and the CPT Remote SW Control. The primary difference is in the control screen layout, where each CPT function has been split across multiple screens.
For clarity, we used the following color heuristic:
- Light Green: Drive Units
- Yellow: Twister
- Red: Sprocket
- Cyan: Folder
- Blue: Rod Connection
- Purple: SHPU & JB
- Green: Ifield Alarm & Zero Depth
The APvdB Automatic Screen will remain on the Automatic Screen, so it will be ommited from this screen
APvdB Screens
OI Screens
Ended: HMI
Ifield ↵
Getting Started
To start the app, double-click on the provided executable.
This software runs both in the RCC and in the Vessel.
Main Screens and Navigation
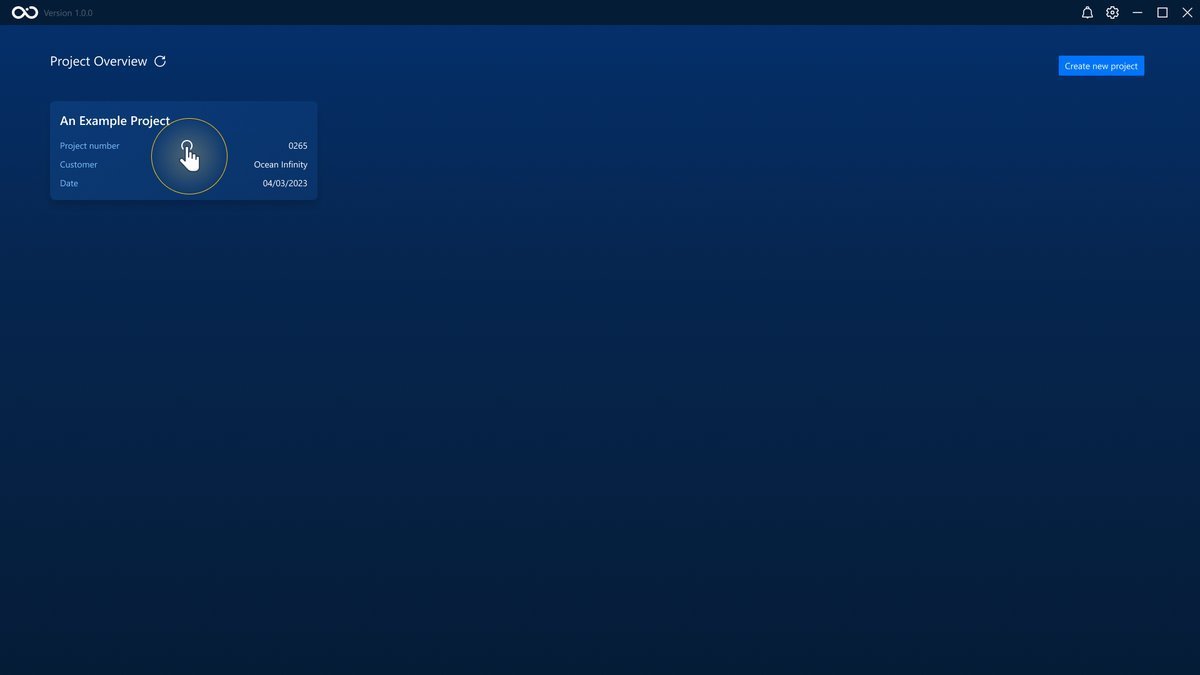
The iField starting screen is the Project Overview. It contains all the projects that were created.
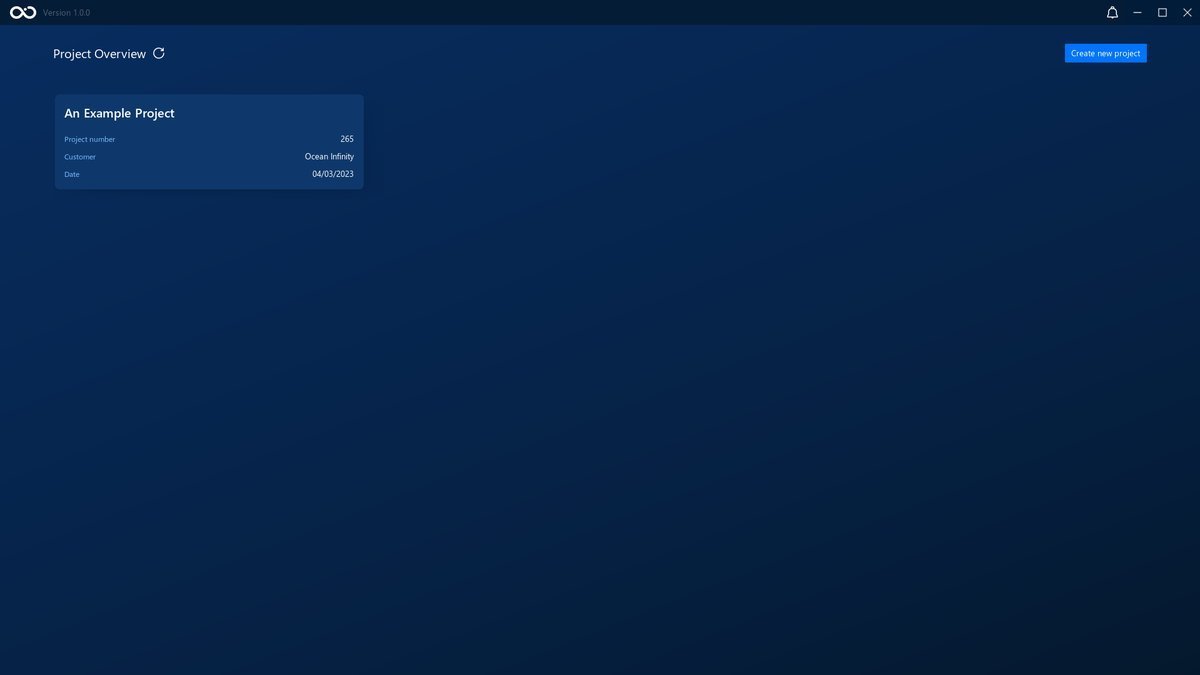
You can navigate to a project from this screen by clicking on one of the project cards.
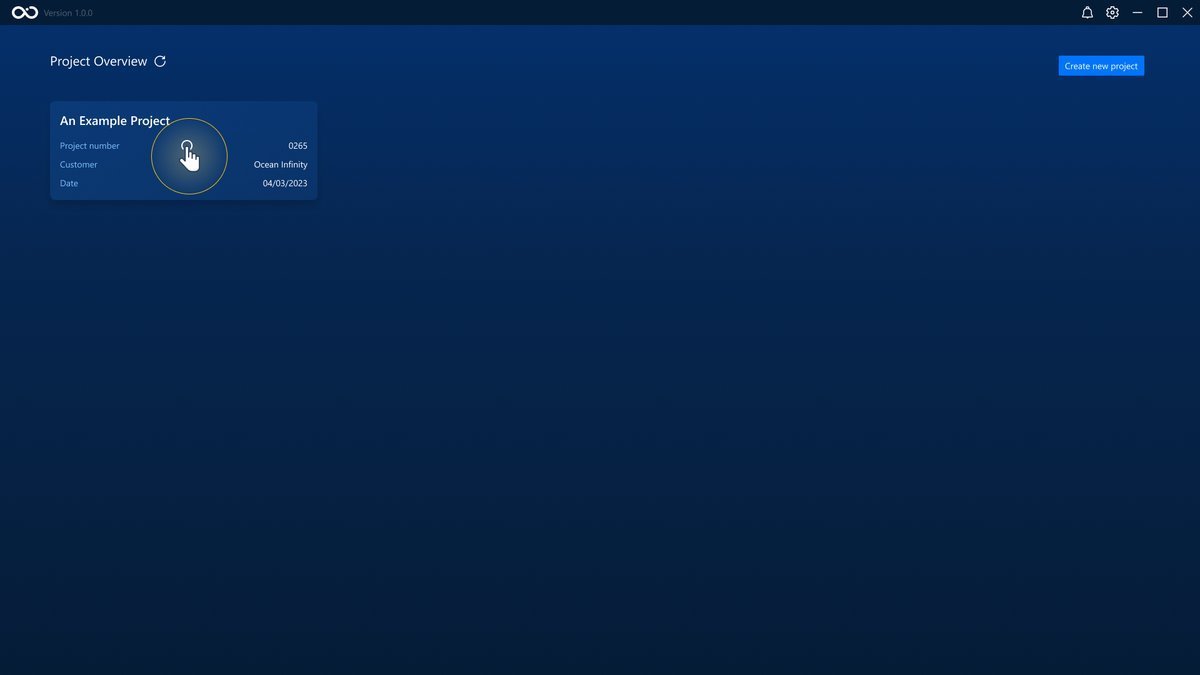
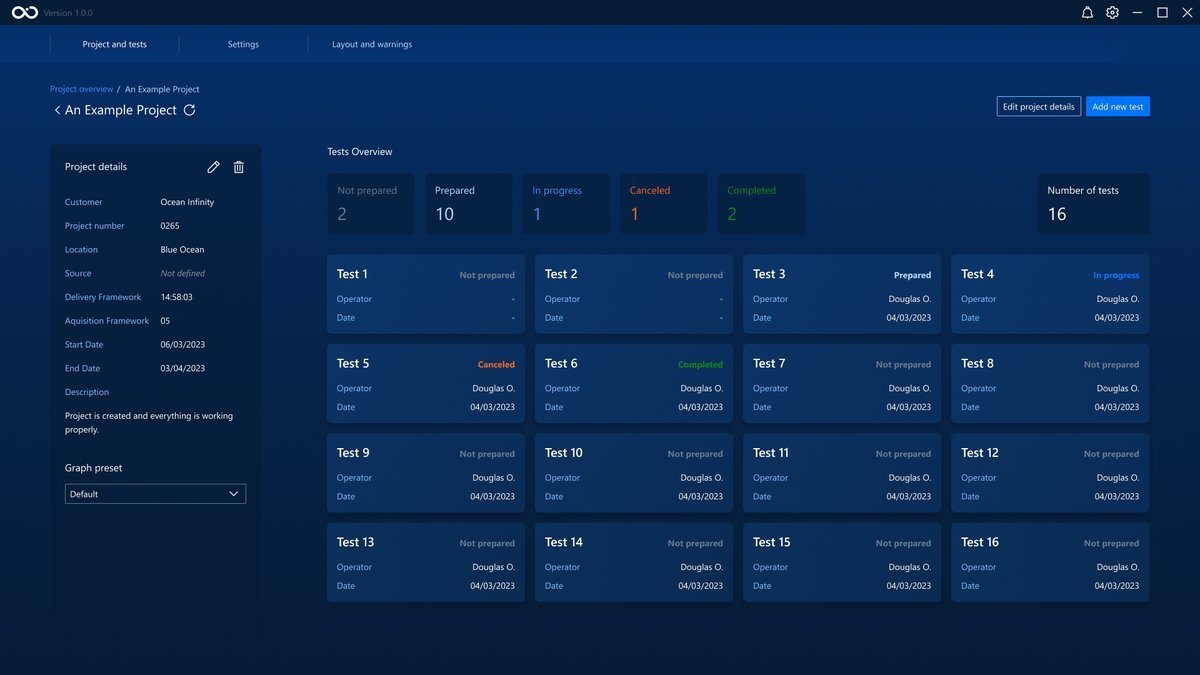
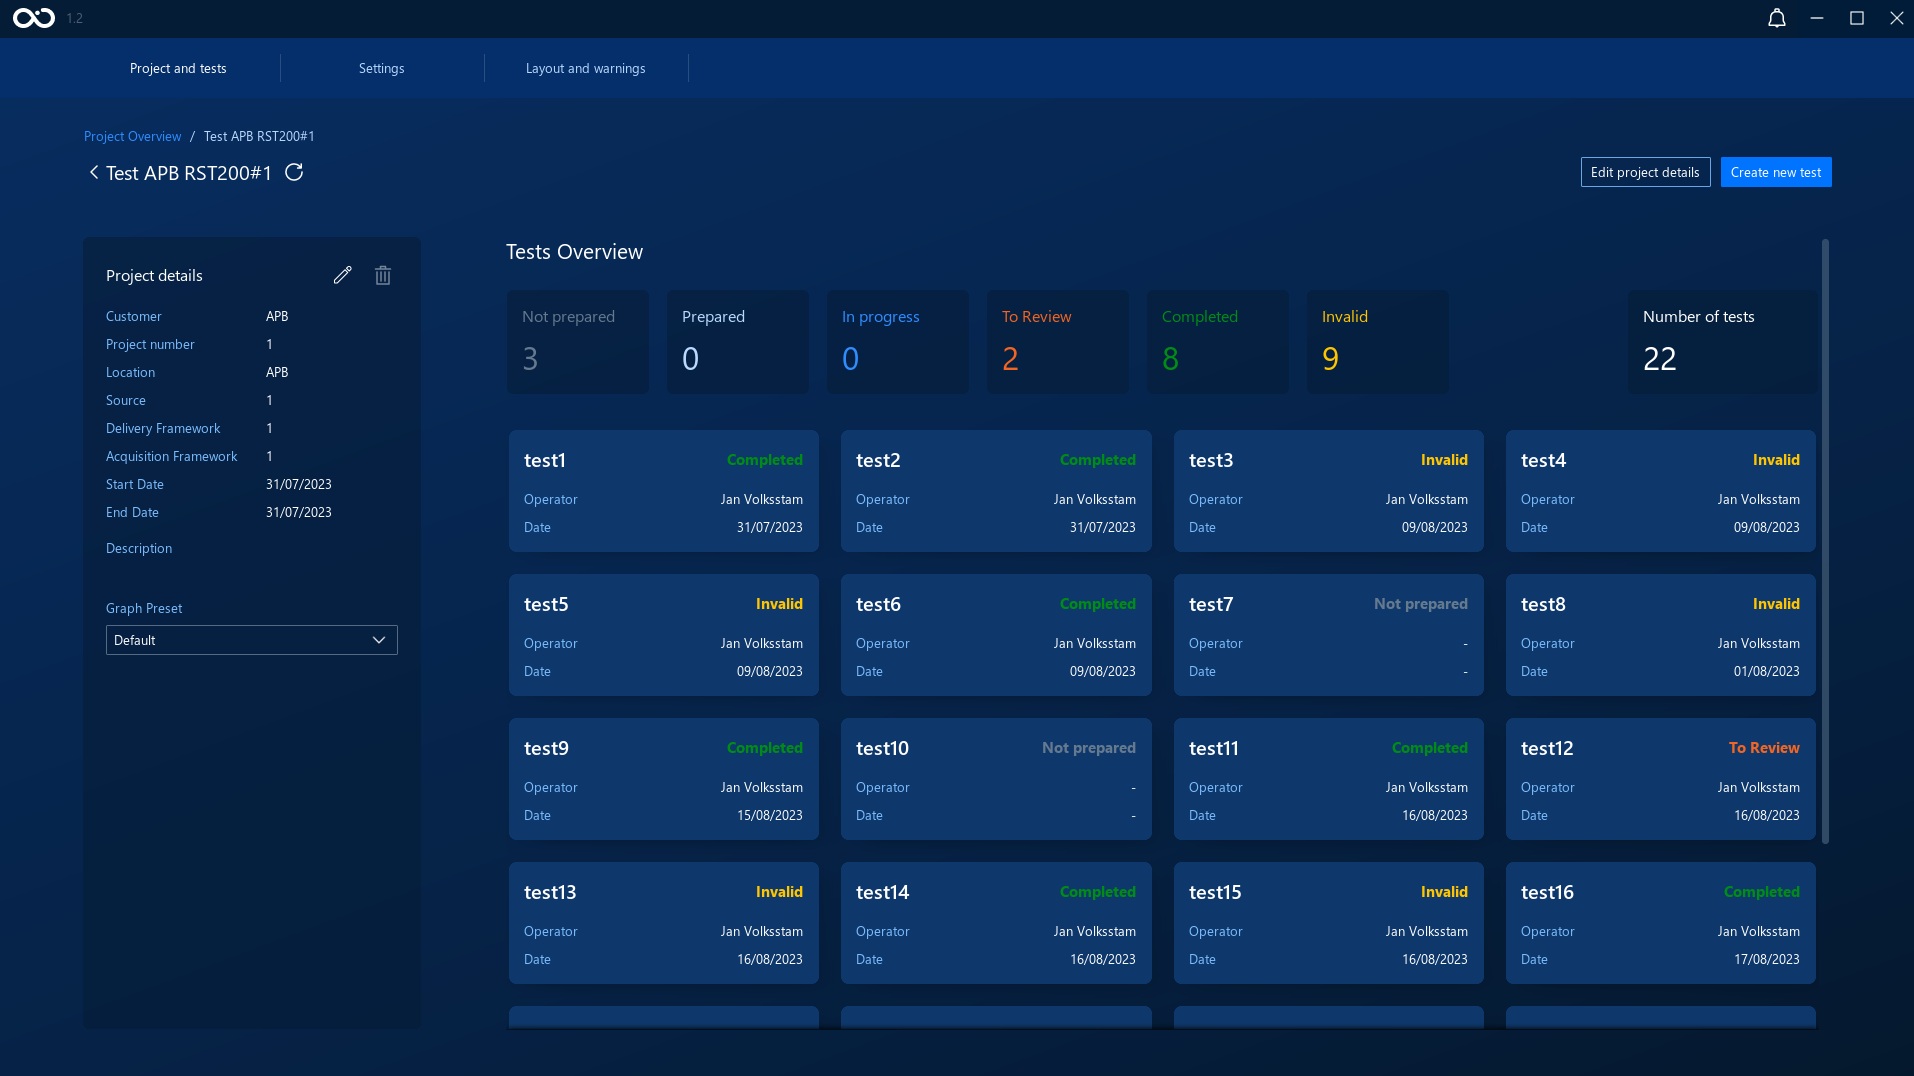
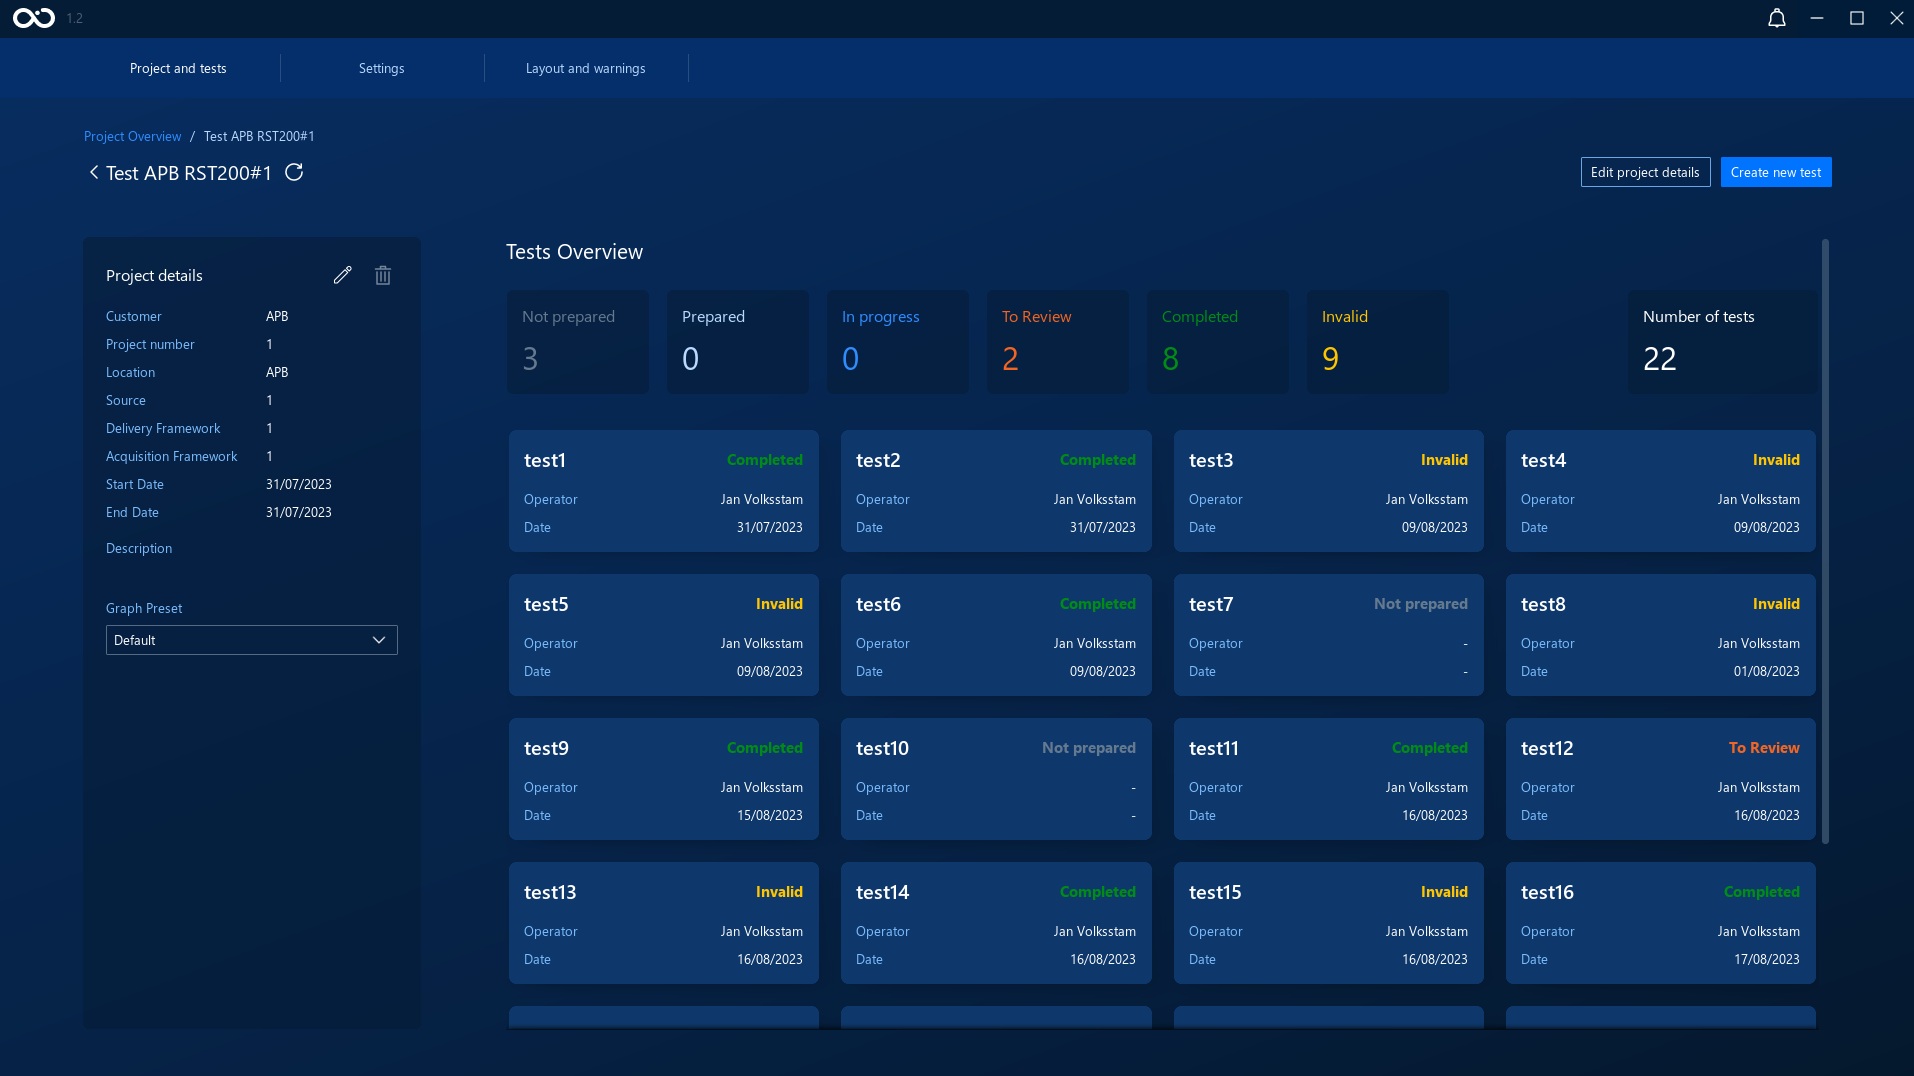
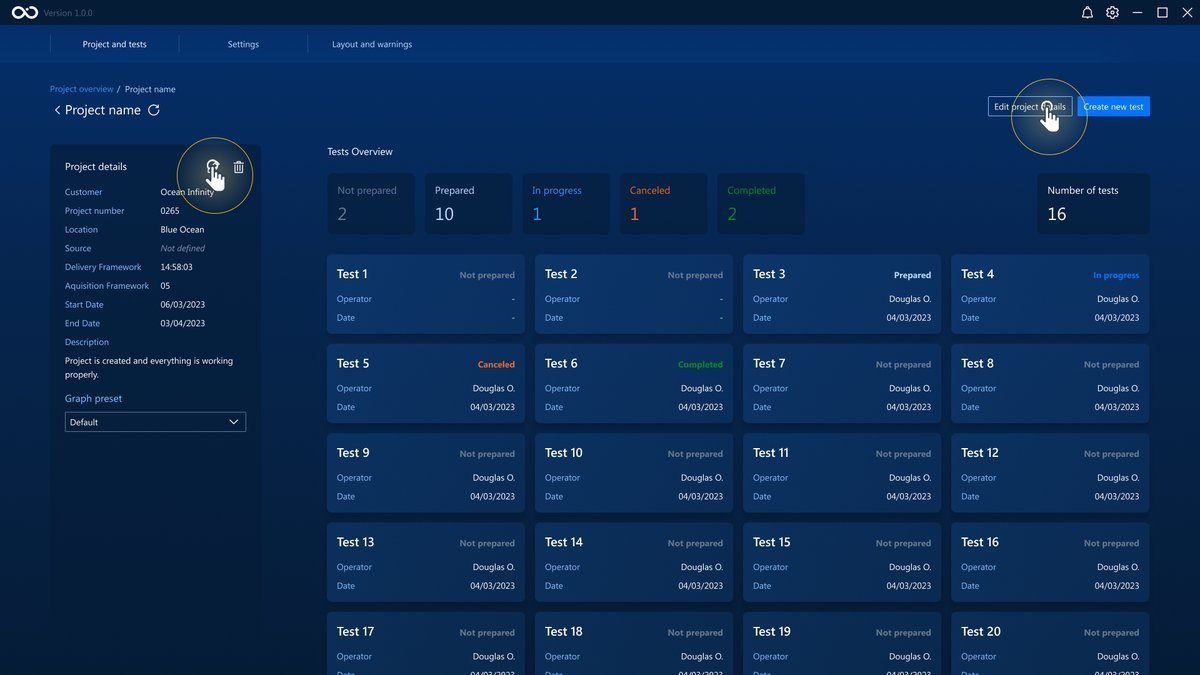
You are taken to the Project Dashboard. This contains all information about the project and the tests that belong to this project. (Projects)
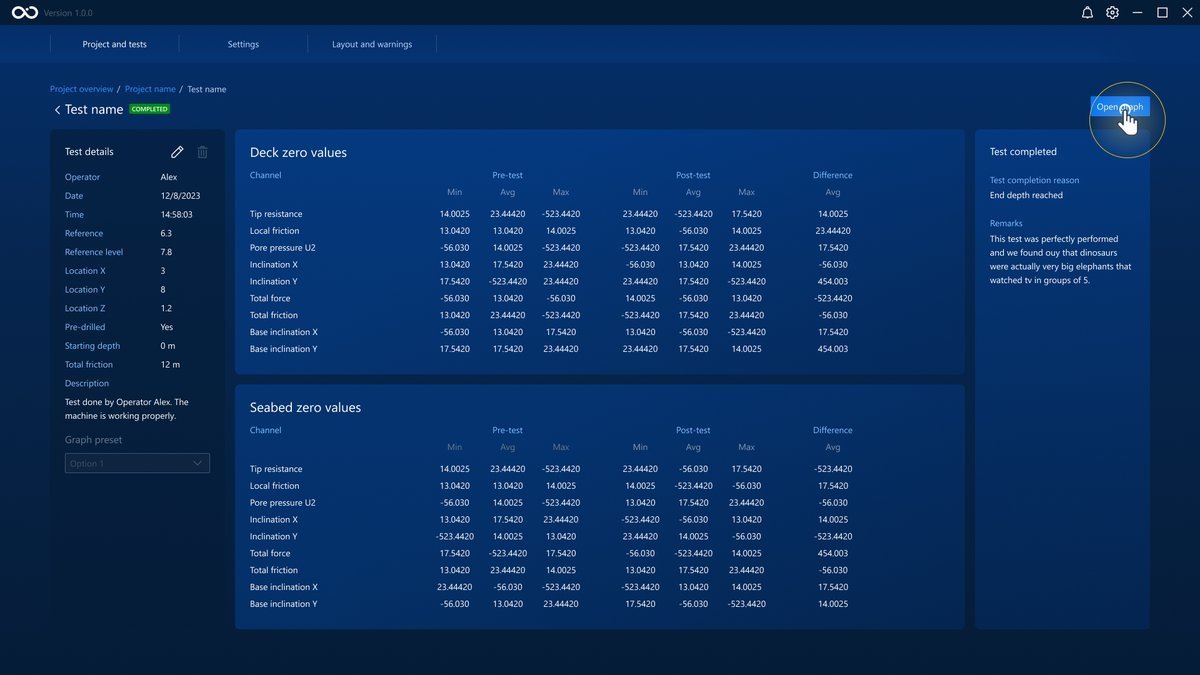
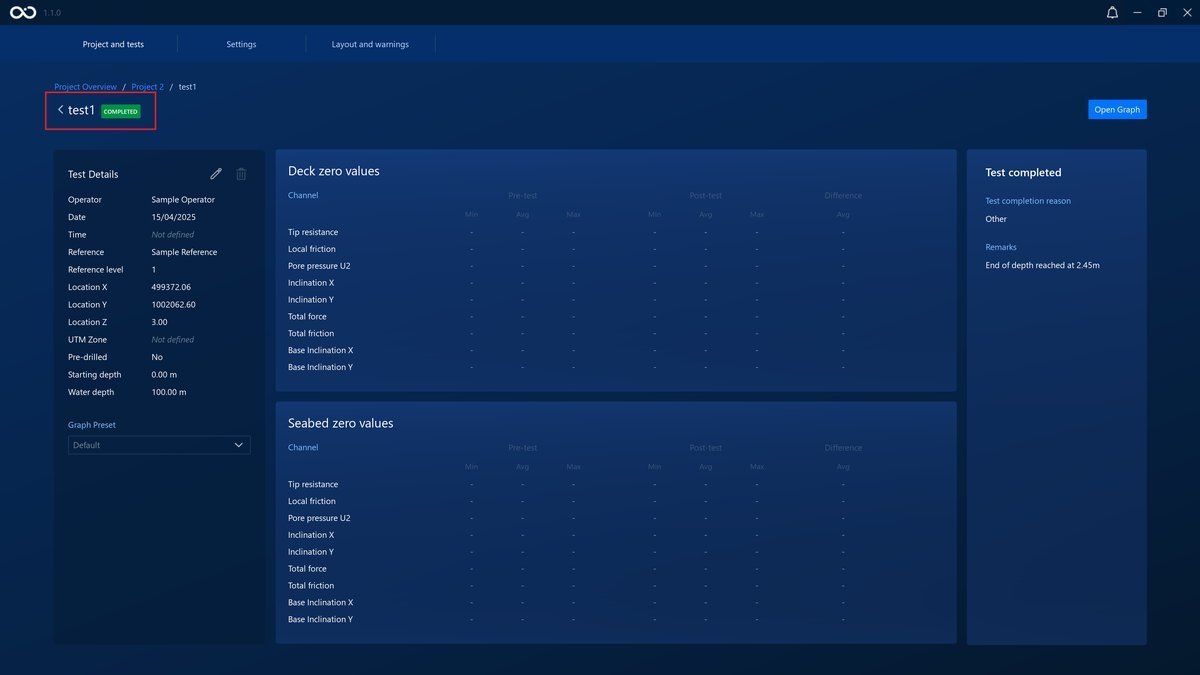
To see a Test, click on its card. You will be taken to the Test Dashboard. The following image shows a Test Dashboard of a test that's Completed. On this page, you can see the Zero Measurements that were done and the test's details. (Tests)
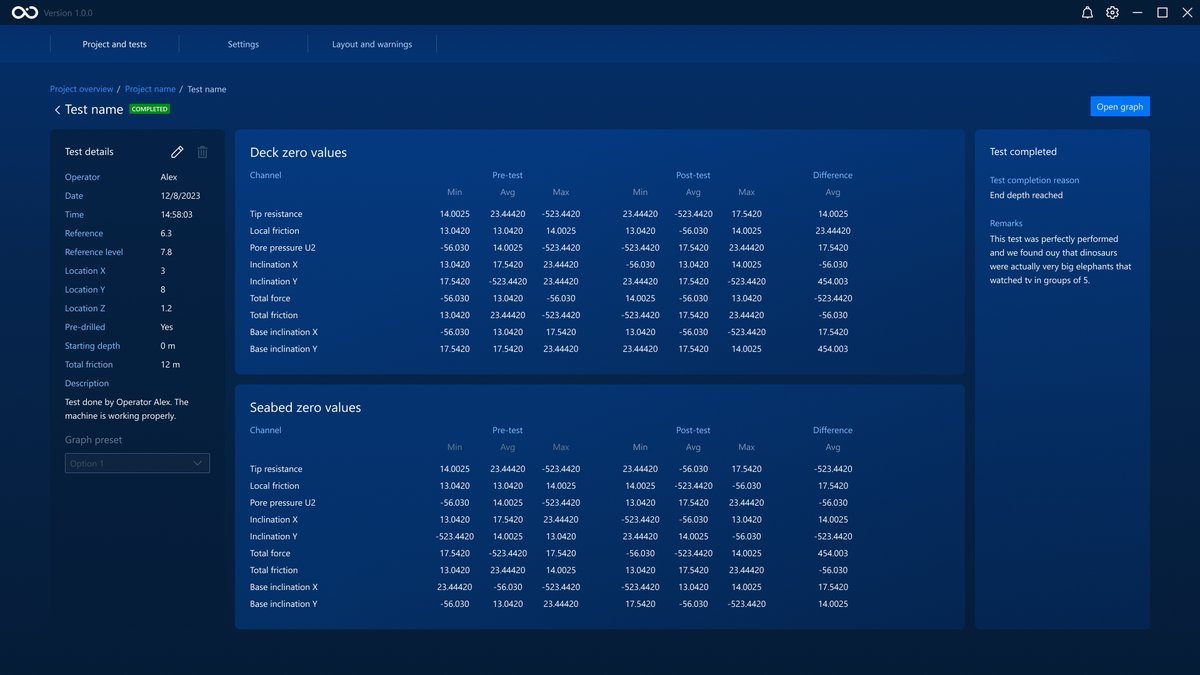
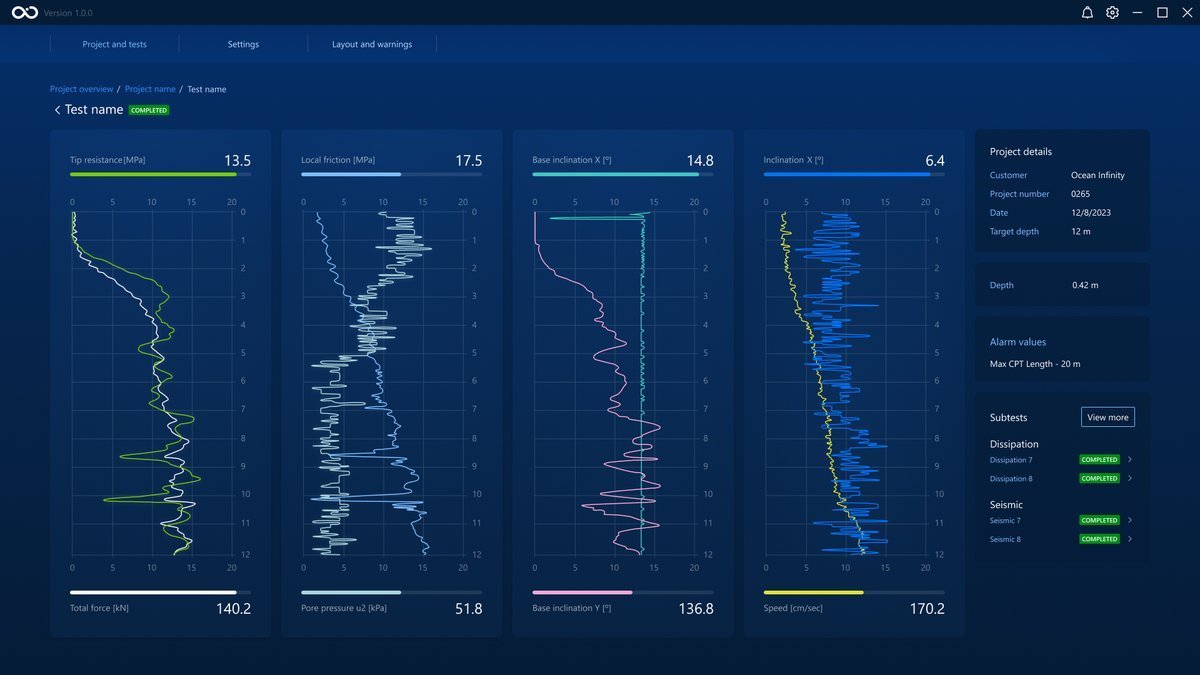
To access the data taken in the rest of the test, click on the Open graph . This will take you to the Test Graphs page.
On this page, you can see all the collected data plotted against depth. (Data Acquisiton)
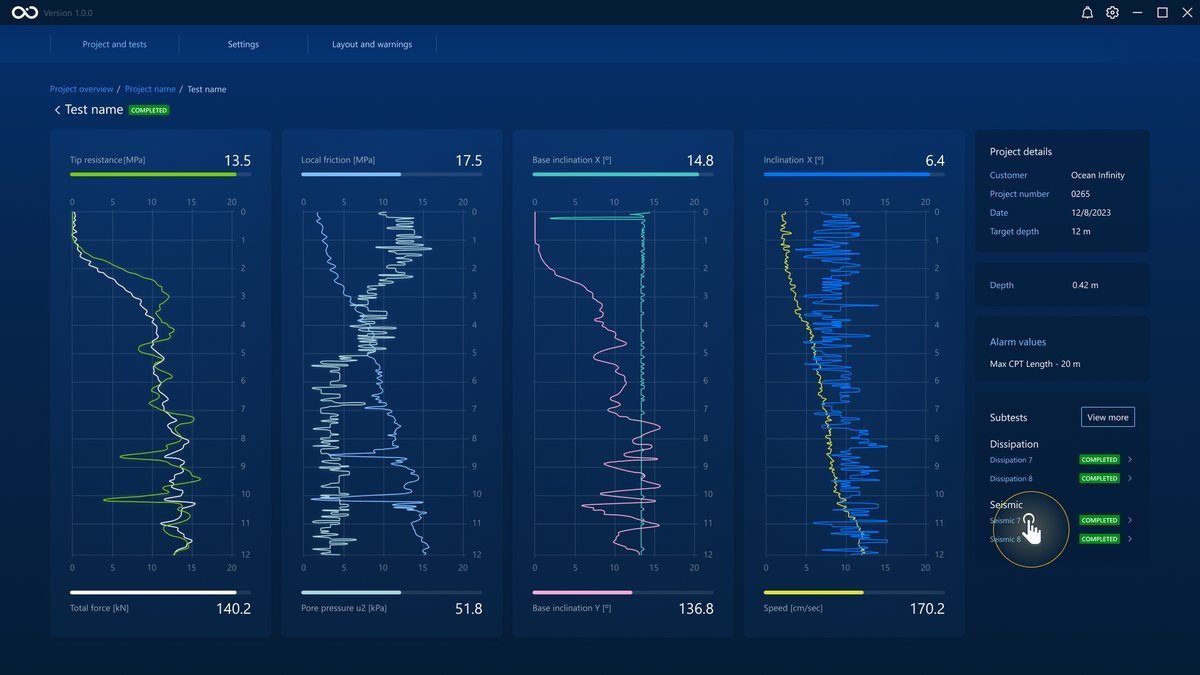
You can see the subtests made during the test in the Subtests panel at the bottom right. To see a subtest, click on its name.
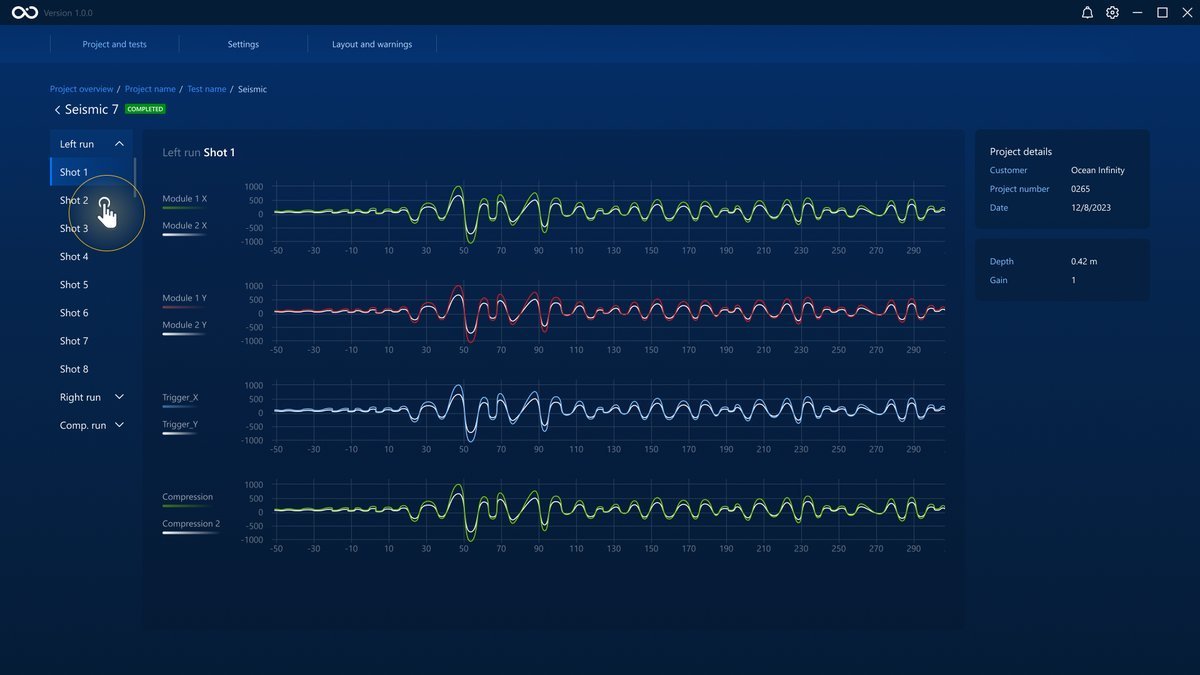
This will take you to the Subtest Graph page. On this page, you can see the data collected for the subtests, and in case of a seismic subtest, you can see the different shots that were done. (Subtests)
Prepare Operation ↵
Projects
When opening the application, we are greeted by the Project Overview page. All the projects that were created can be seen on this page. Each card contains a summary of the details of its project. We are taken to the project dashboard page by clicking a project card.
The project dashboard contains the project's details and gathers all the tests done in that project.
Create a New Project
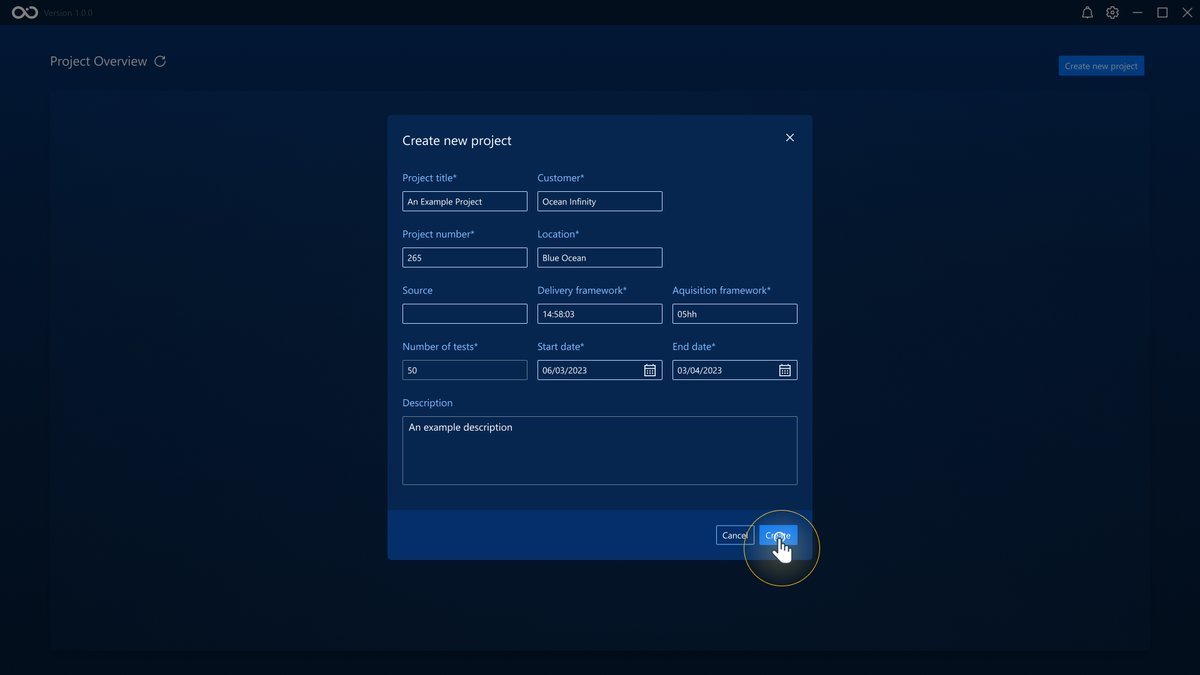
To create tests, a project that will represent all the tests on a given operation should be created beforehand. You can do so by clicking the Create new project button in the Project Overview screen.
Note
To automatically upload the data files to shore, please use the global project ID as the Project name, for example INTOI091085. This is paramount, otherwise we won't be able to match the folders between the ICC PC and the folders in the M:/ drive. In case of doubt, please align with the responsible to process the data in DATA environment.
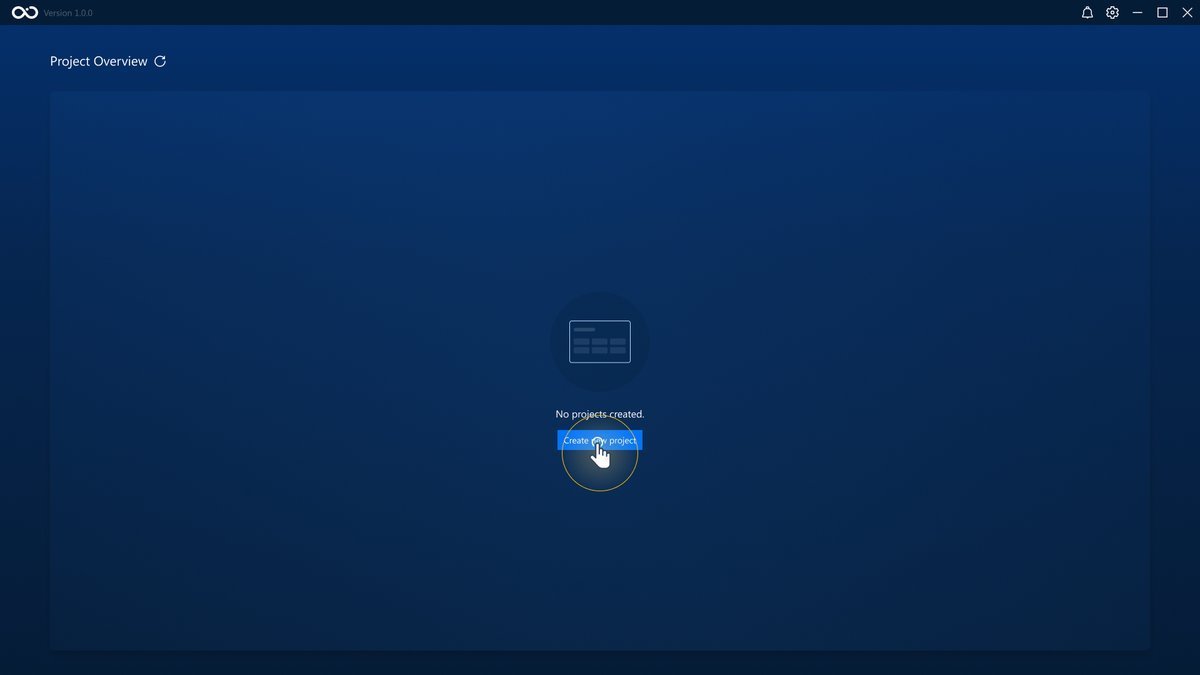
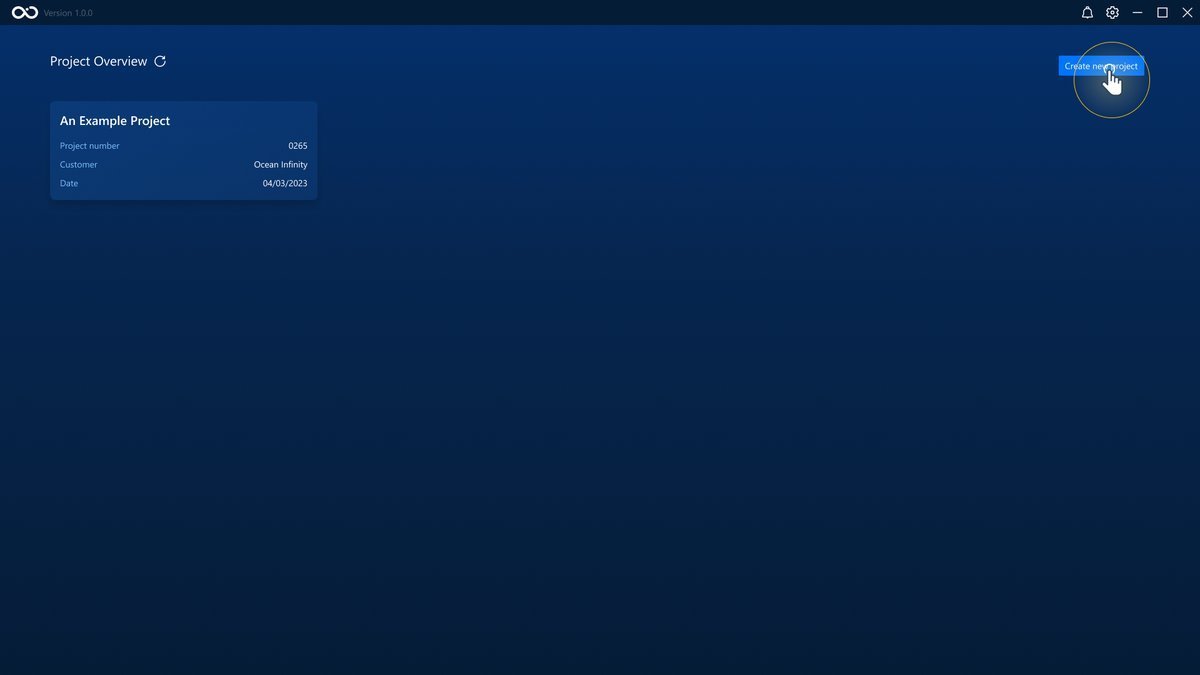
This will open a modal where you can write the new project details. Note that fields that have a * next to them are mandatory. To jump from one field to the next, press the Tab button on the keyboard, and Shift+Tab to move to the previous field.
In this modal, you can already set the number of tests for the project to be created with. These tests will start as Not prepared (see Tests for instructions on how to set the tests details).
When all the mandatory fields are filled in, the Create button will be available. Click on it to create a new project. Click on Cancel to cancel the project creation and return to the Project Overview.
Once a project has been successfully created, you will be taken to the dashboard of the newly created project.
Delete a Project
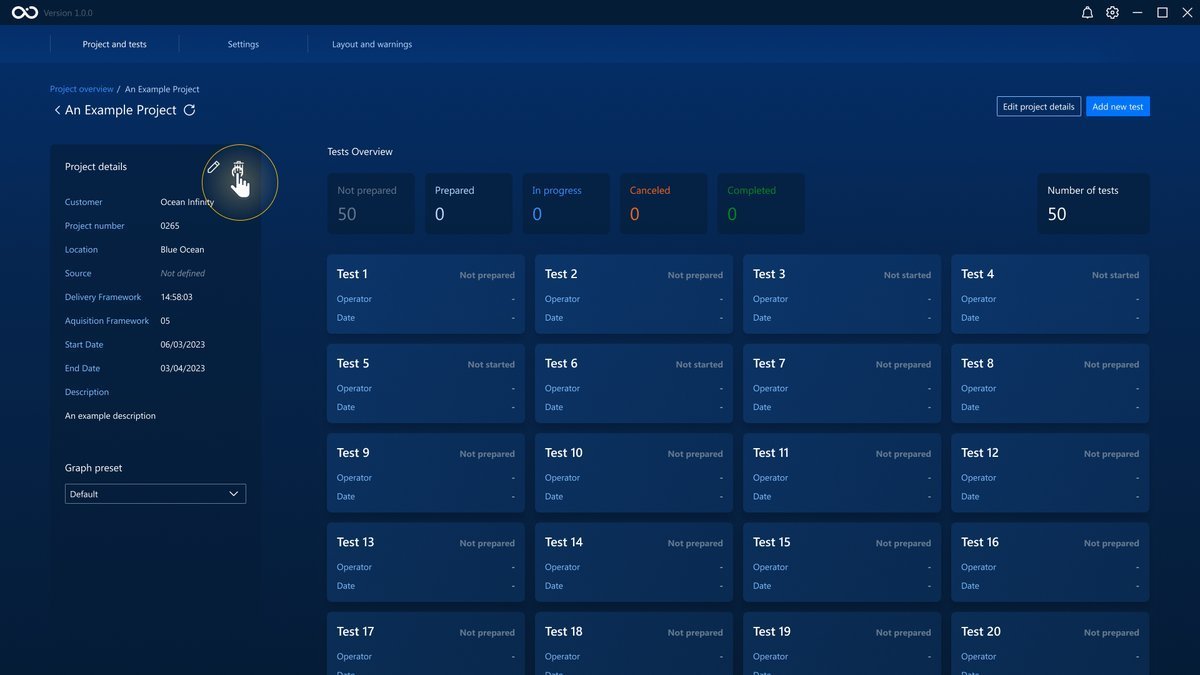
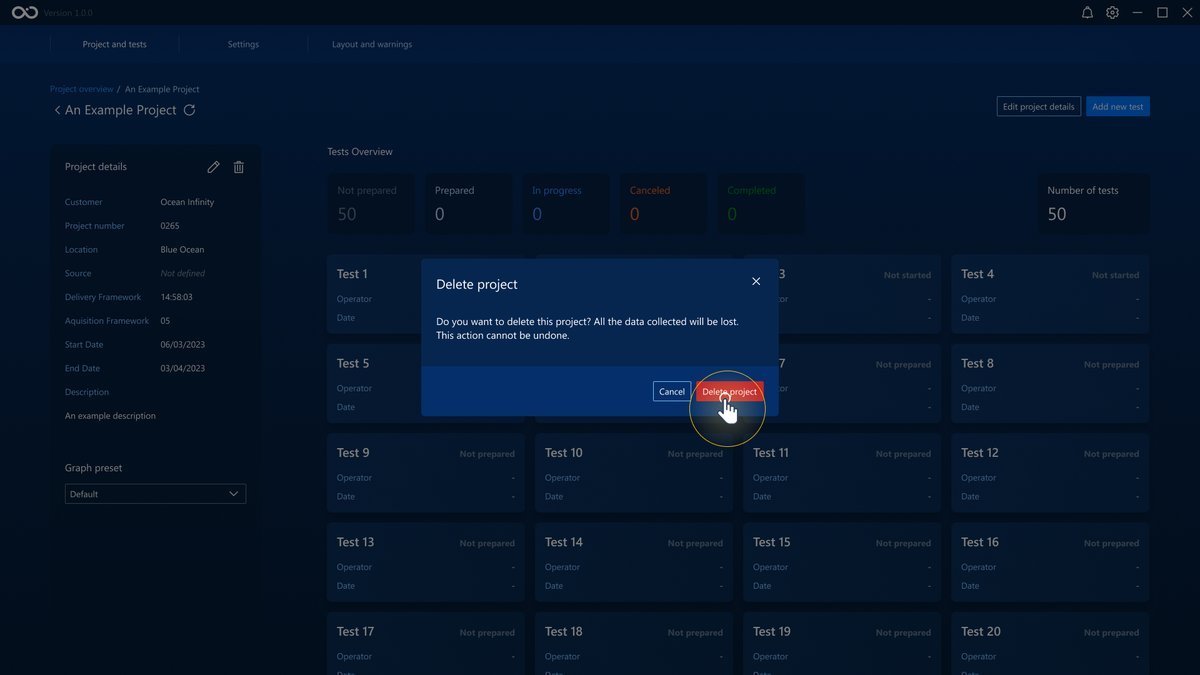
Click the Trash button in the Project Dashboard to delete a project. This button will be disabled if the Project already contains any Completed or To Review tests (see Tests for an explanation of tests states).
Edit a Project
The project details can be edited after creation by clicking either the Edit Project button or the button in the Project Dashboard.
Tests
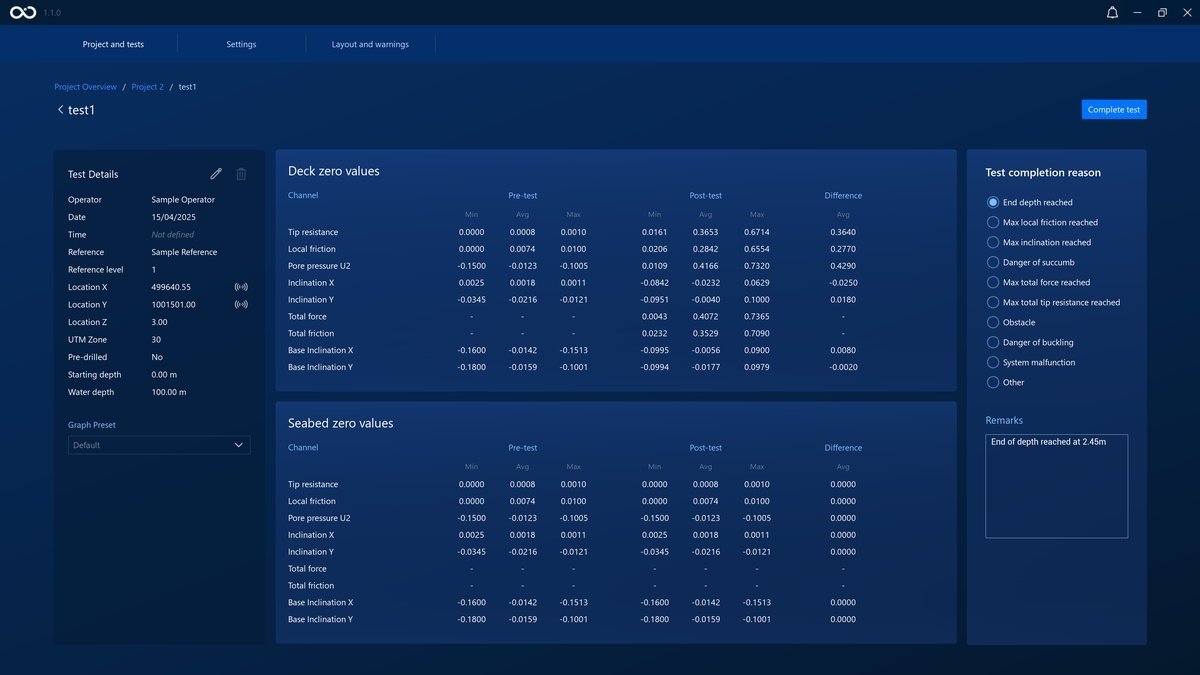
The Test dashboard is the main entry point for the data acquisition process. It also lets you view and update test details and review past test data acquisition if a test has been Completed or To Review.
Test states
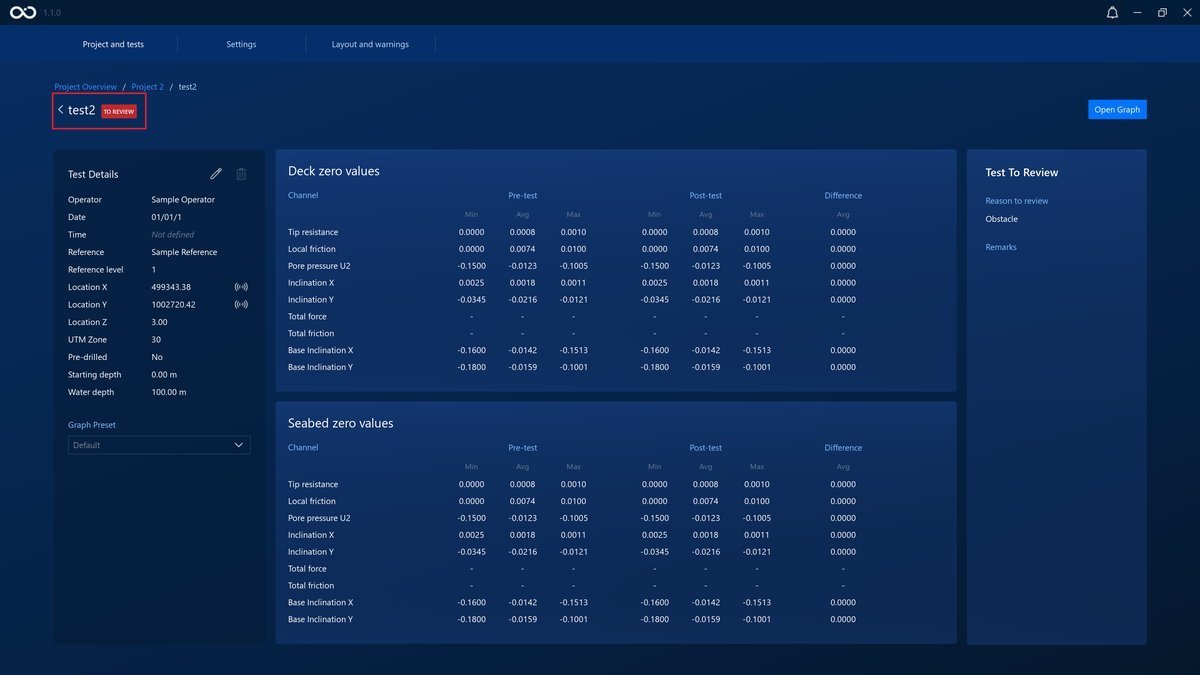
A Test can have one of six states:
| State | Description |
|---|---|
| Not prepared | A newly created test, missing the test details that it needs to start |
| Prepared | A newly created test with the test details filled out |
| In progress | A test that has started data acquisition |
| To Review | A test where all measurements were finished but it was completed with a To Review reason |
| Invalid | A test where there was an error that caused a disconnection in the middle of measurements and the test could not complete |
| Completed | A test where all measurements were finished and completed with a Completed reason |
When a test becomes Invalid
A test becomes Invalid if it finishes or hits an error, but the connection to the API is lost before the Complete test button is pressed. When this happens, you'll be returned to the Project Overview page automatically.
This is expected behavior, not a bug. If you see it happen:
- Wait a short while for the API to come back online.
- Once it's back up, reopen the project as normal and start a new test.
Test completion reasons
The possible completion reasons are as follows:
| State | Completion Reason |
|---|---|
| Completed | End Depth reached |
| Completed | Maximum local friction reached |
| Completed | Maximum inclination reached |
| Completed | Maximum total force reached |
| Completed | Maximum total tip resistance reached |
| To Review | Danger of succumbing |
| To Review | Obstacle |
| To Review | Danger of buckling |
| To Review | System malfunction |
| To Review | Other |
Create a New Test
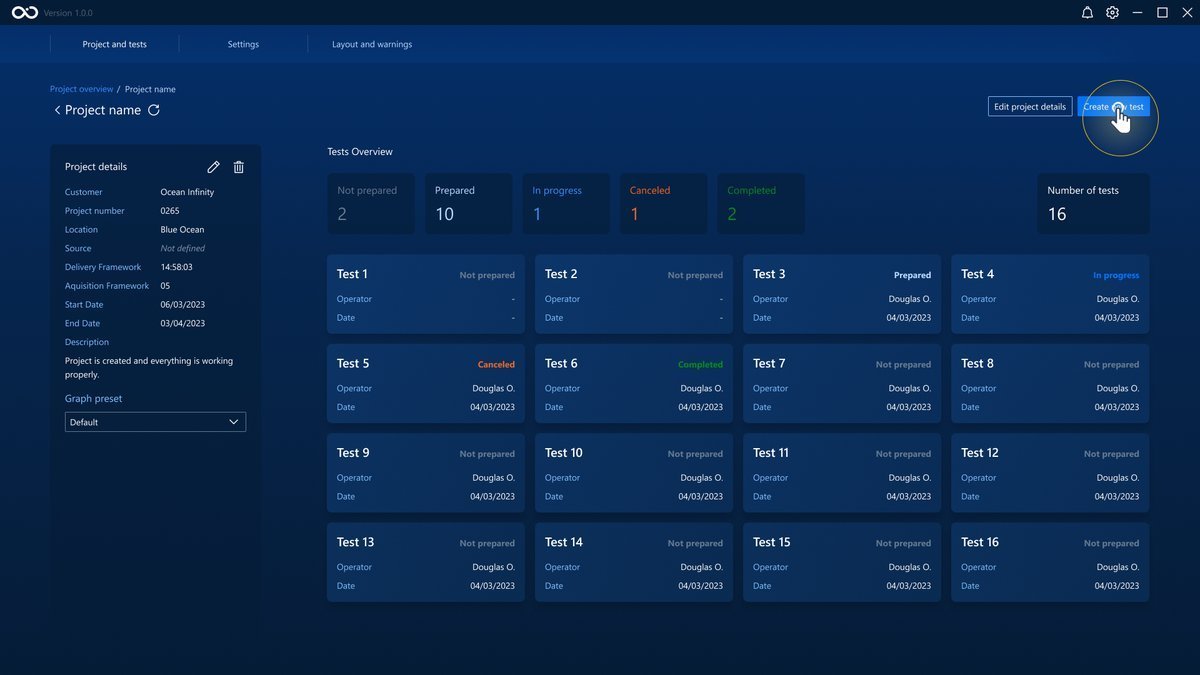
When creating a new project, you can set the number of tests that the project will start with (see Create a New Project). However, more tests can be added by clicking the Create New Test button in the Project Dashboard. The newly created test will start as Not prepared.
Prepare a Test (Edit Test Details)
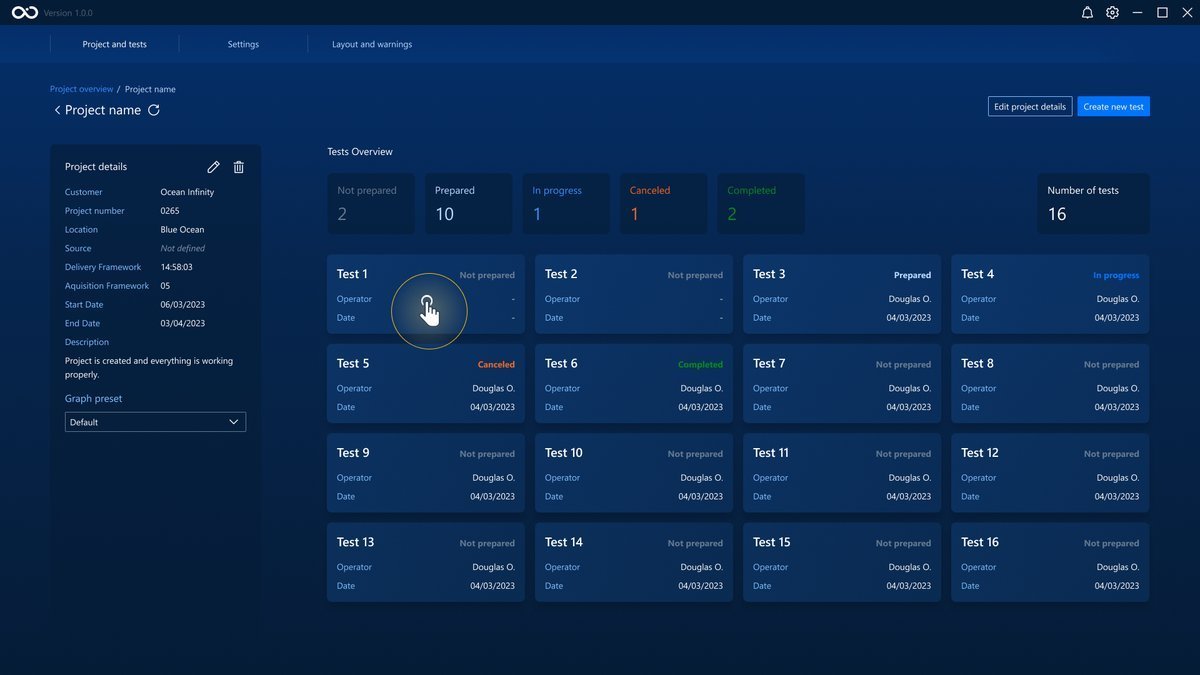
To prepare a test, you need to fill in the test's details. First, navigate to the test dashboard by clicking on its card.
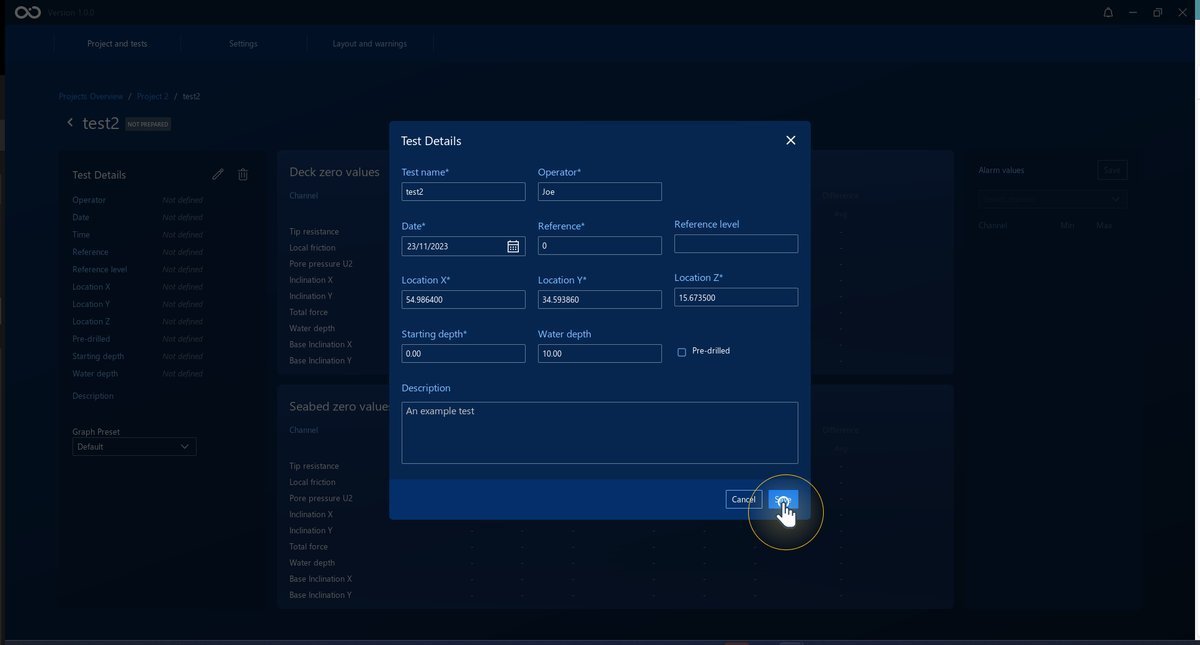
If the test is Not prepared, the panel to edit the test details will show immediately.
The image below shows the panel where you can fill in the test details. The fields with * are mandatory. After the mandatory fields are filled, you can save the changes, and the test will now be Prepared.
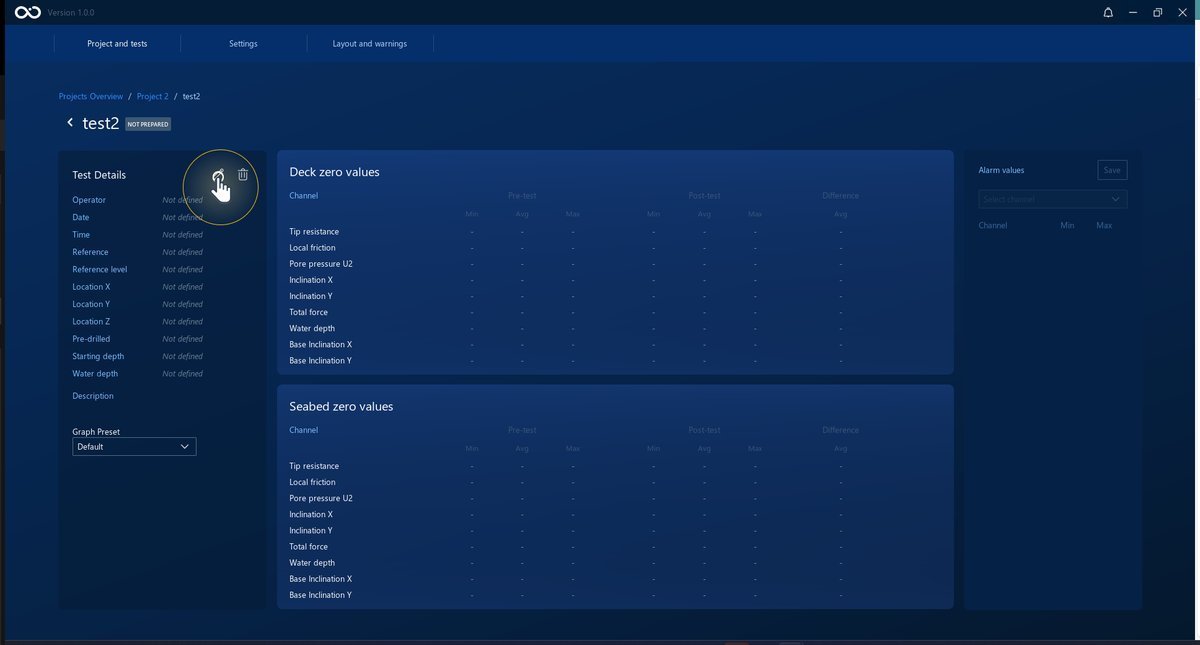
If the test was already prepared, you need to click on the button to edit the details. The test's details can be edited any time after test is Prepared.
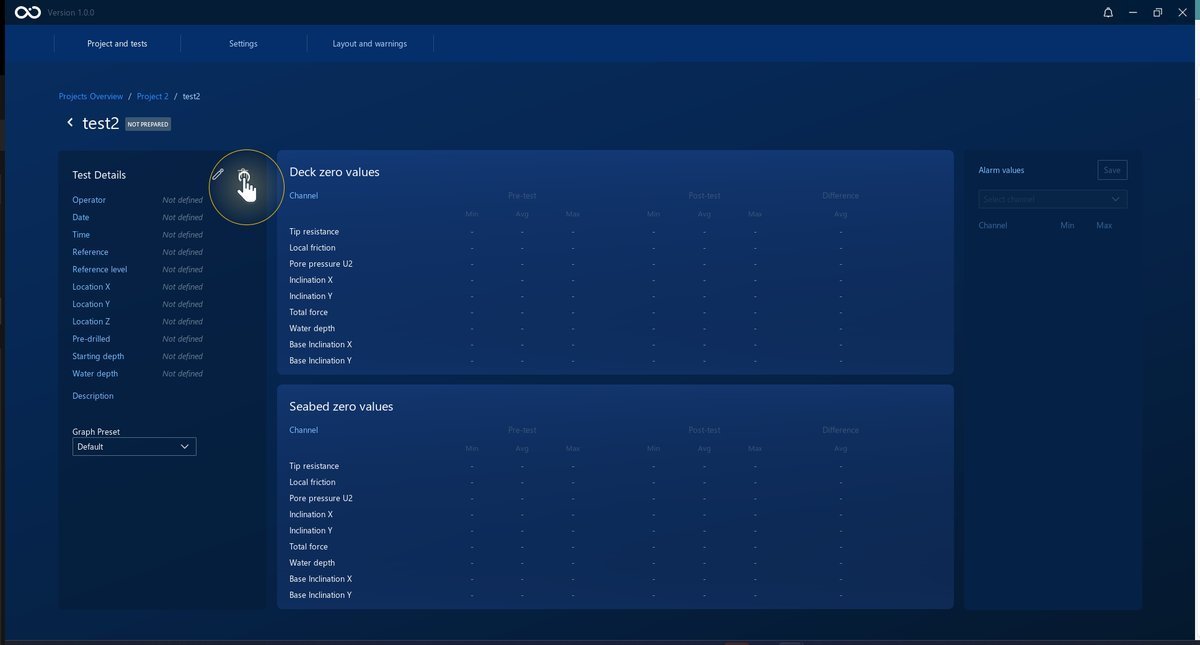
Delete a Test
You can only delete a test that is Not prepared or Prepared. To do so, click the Trash button on the Test Details panel.
Graph Presets
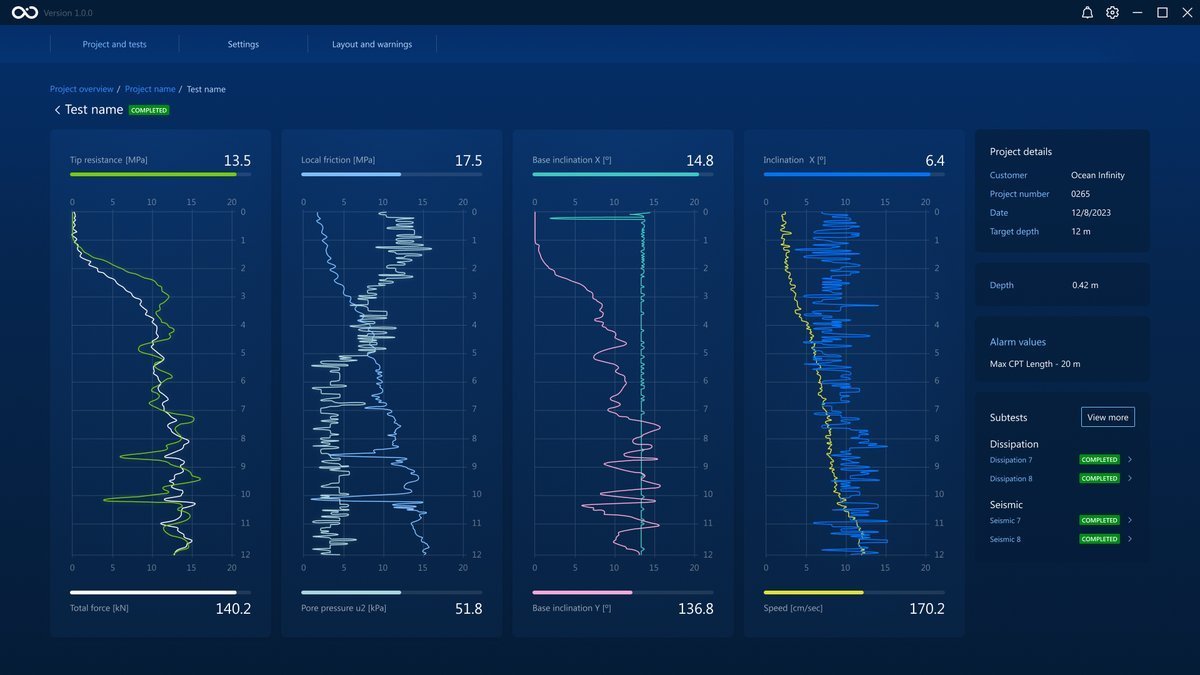
You can configure graph presets to customize the Data Acquisition phase of the CPTs.
Graph presets let you choose which type of data (channels) you can see being plotted in the four available graphs and customize the colors of the graphs for better visualization. The image below shows a test with a custom preset in which eight different channels can be seen being plotted, two per graph, each in a different colored line.
Configure Graph Presets
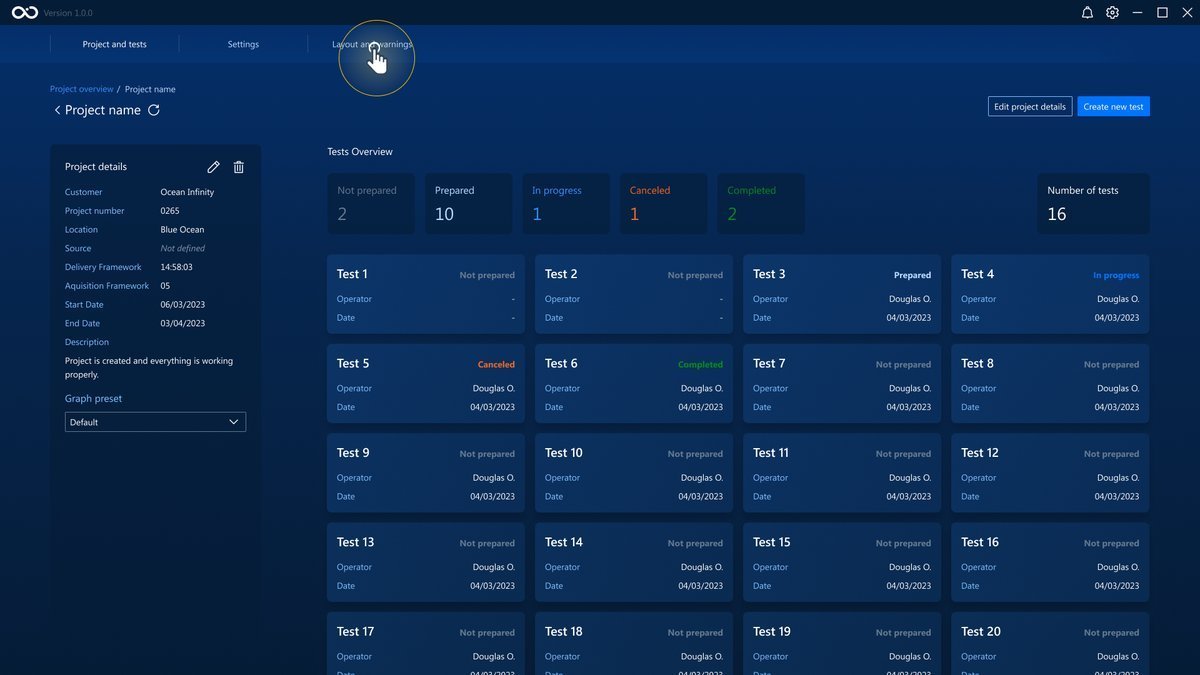
The page to configure graph presets is accessed by clicking on the Layout and warnings button on the top bar.
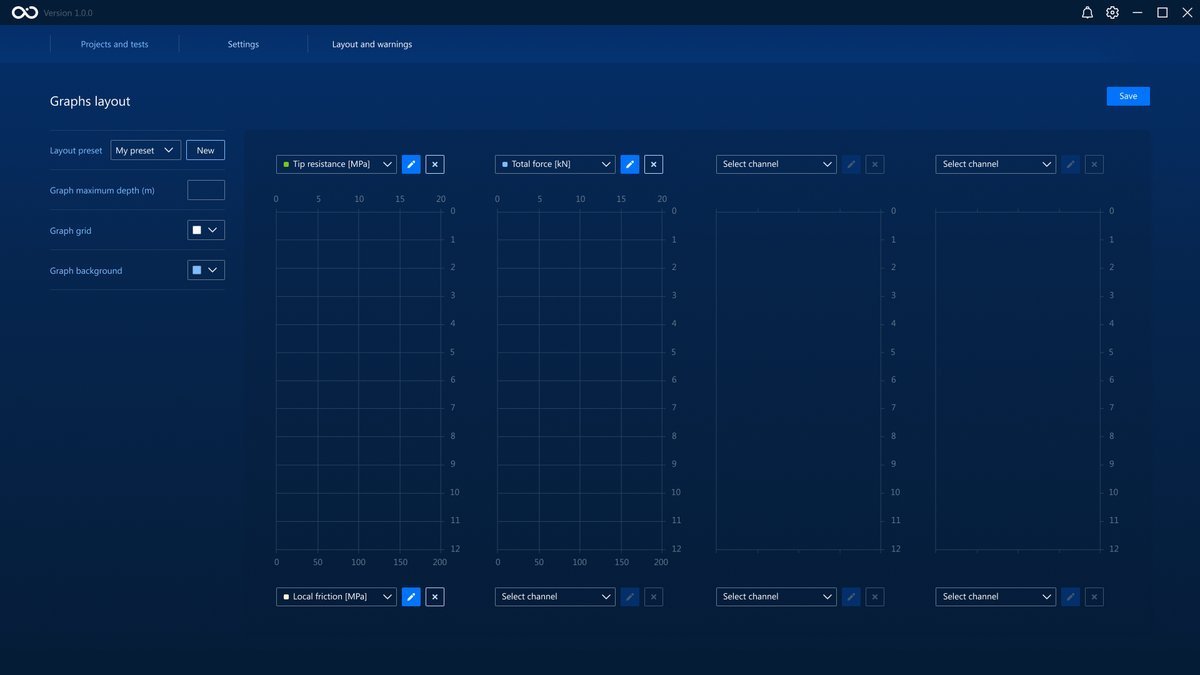
On this page you can:
- Create a new preset
- Define general graphic properties for a preset
- Define properties of a channel belonging to a preset
Create a new preset
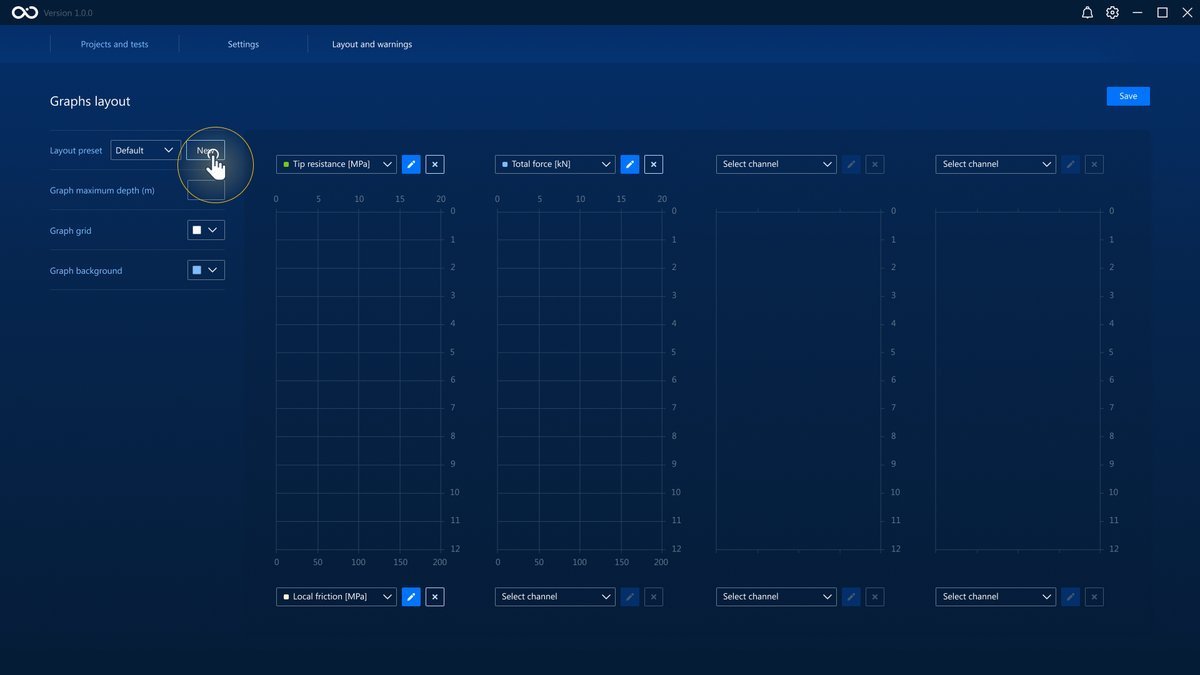
To create a new preset, click the New button next to the dropdown menu Layout preset to the left of the screen.
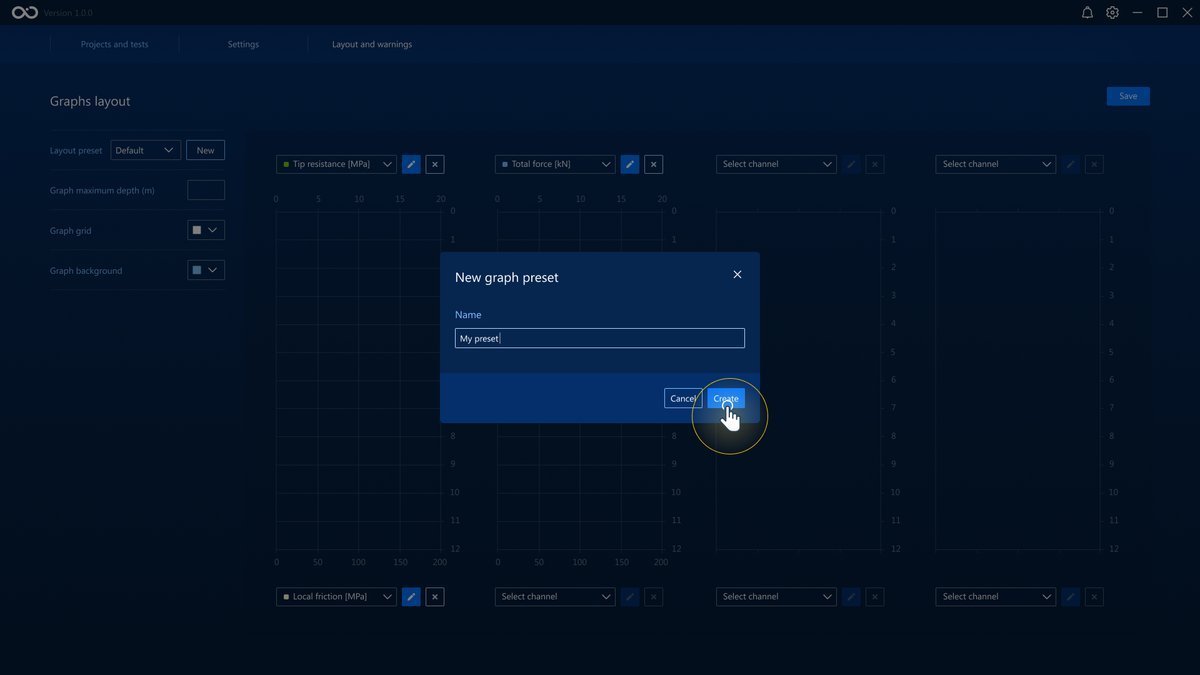
A new window will show where you can input a name for the new preset.
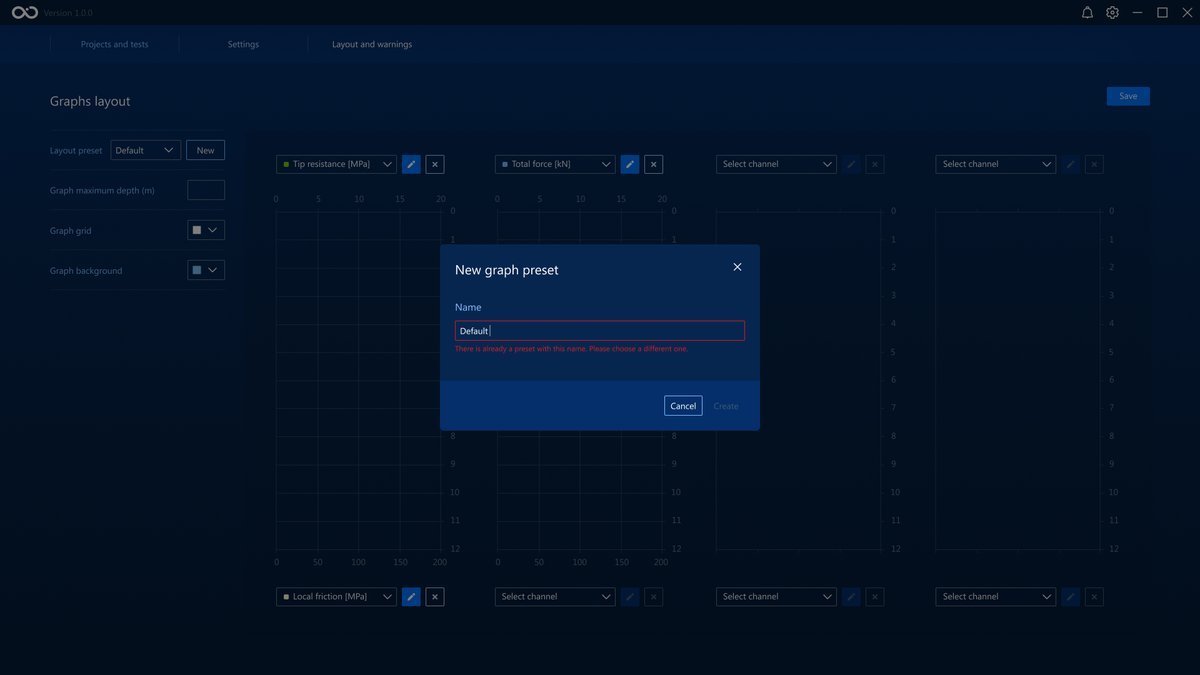
There cannot be two presets with the same name. If you try to write an existing name, an error will show under the text box.
Click on the Create button, and the new preset will be created and automatically selected.
Define preset properties
Select the preset you want to edit on the Layout Preset dropdown button.
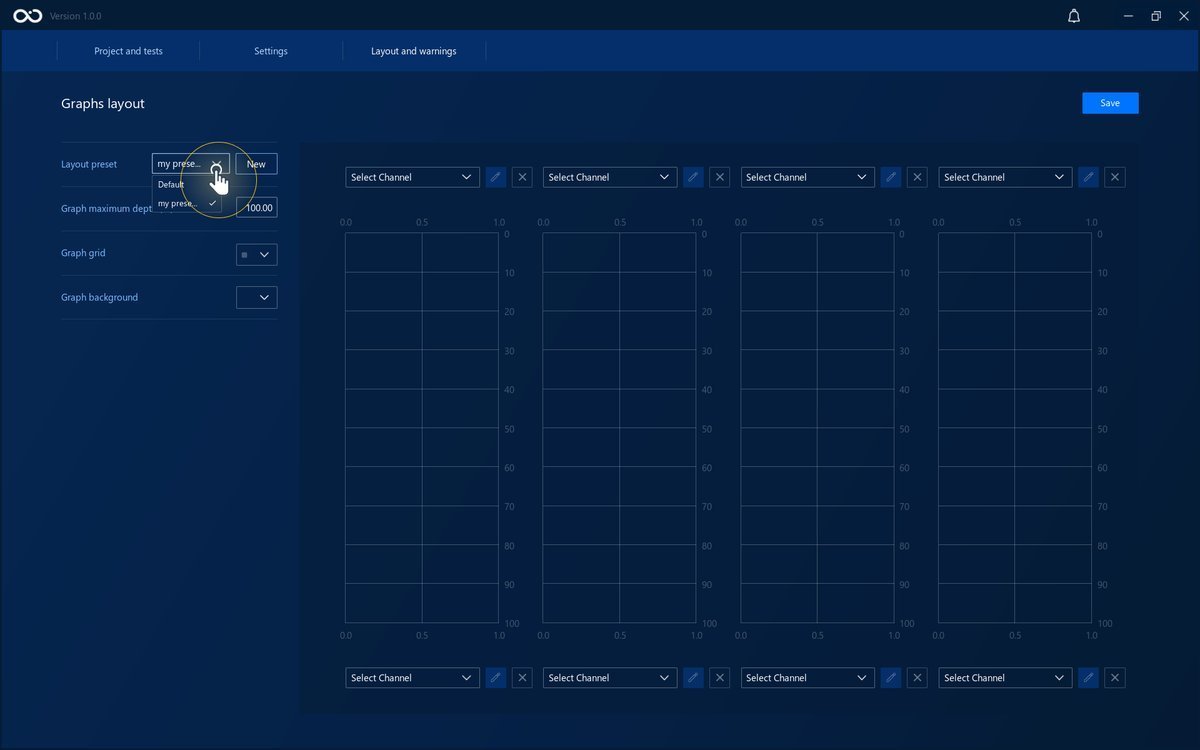
You can change three properties for each preset: Graph maximum depth, Graph grid color and Graph background color.
| Property | Explanation | Example |
|---|---|---|
| Graph maximum depth (m) | Every graph in this preset will show data between 1 and the defined maximum depth (in meters). | 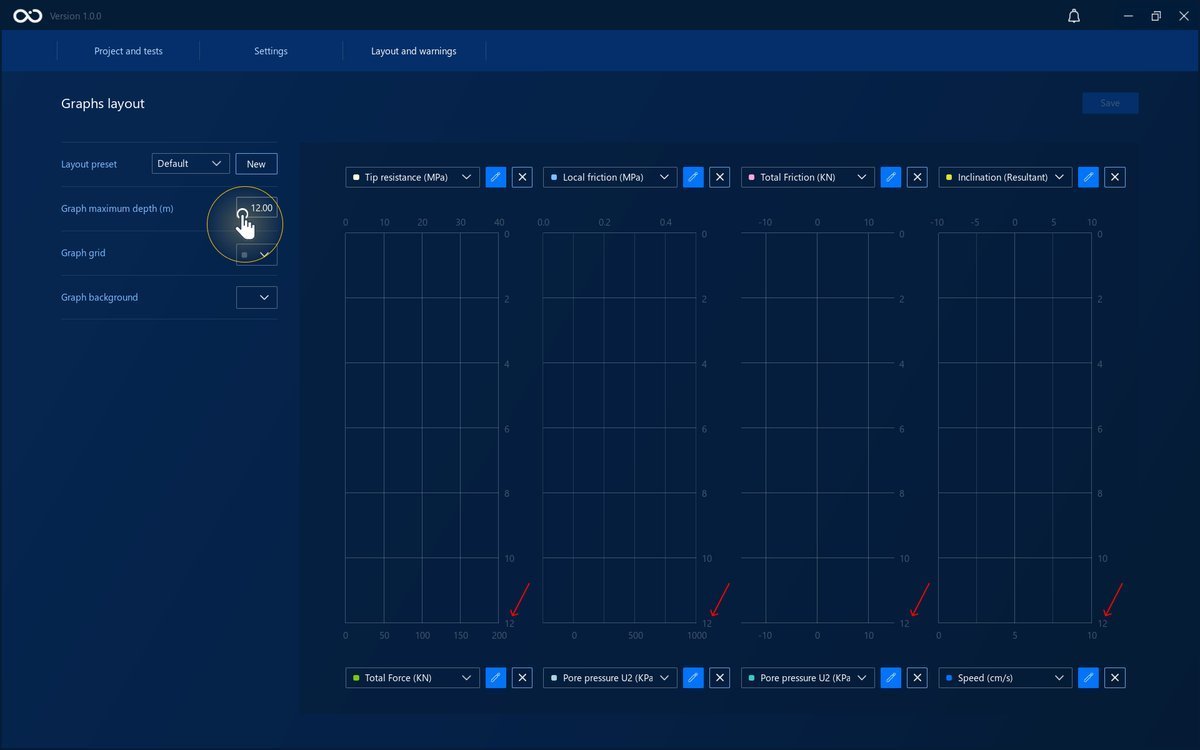 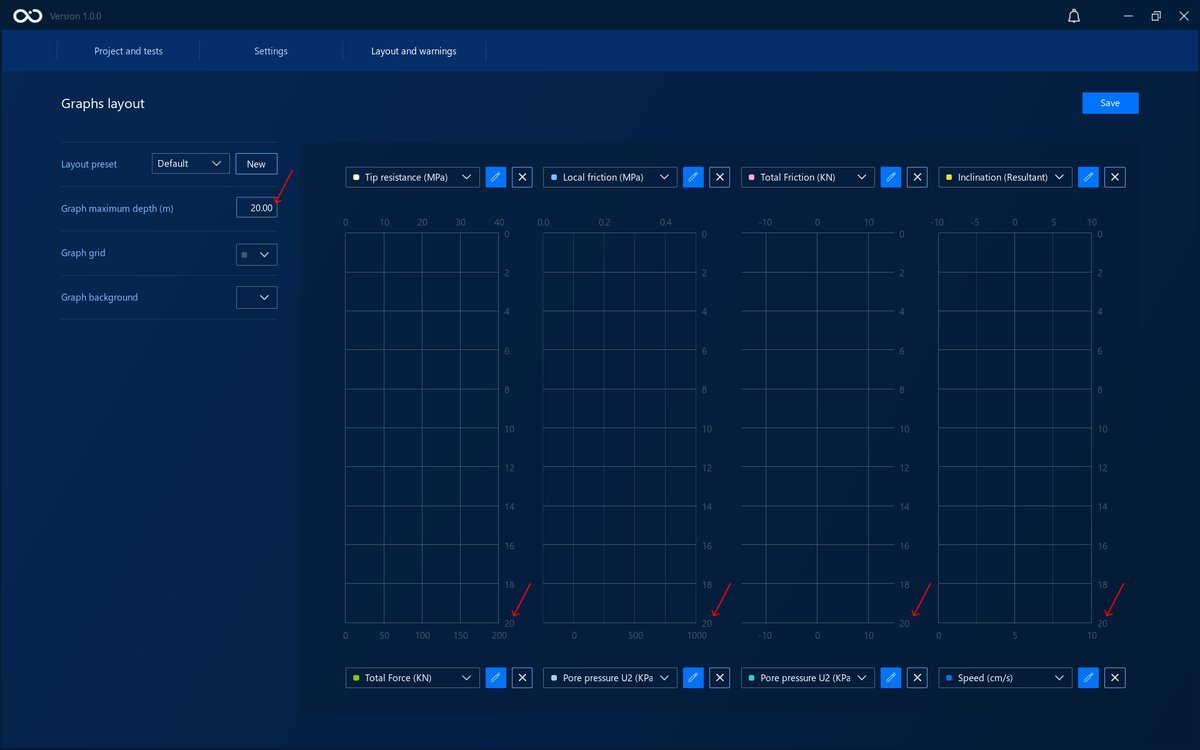 |
| Graph grid | The grid's color of every graph | 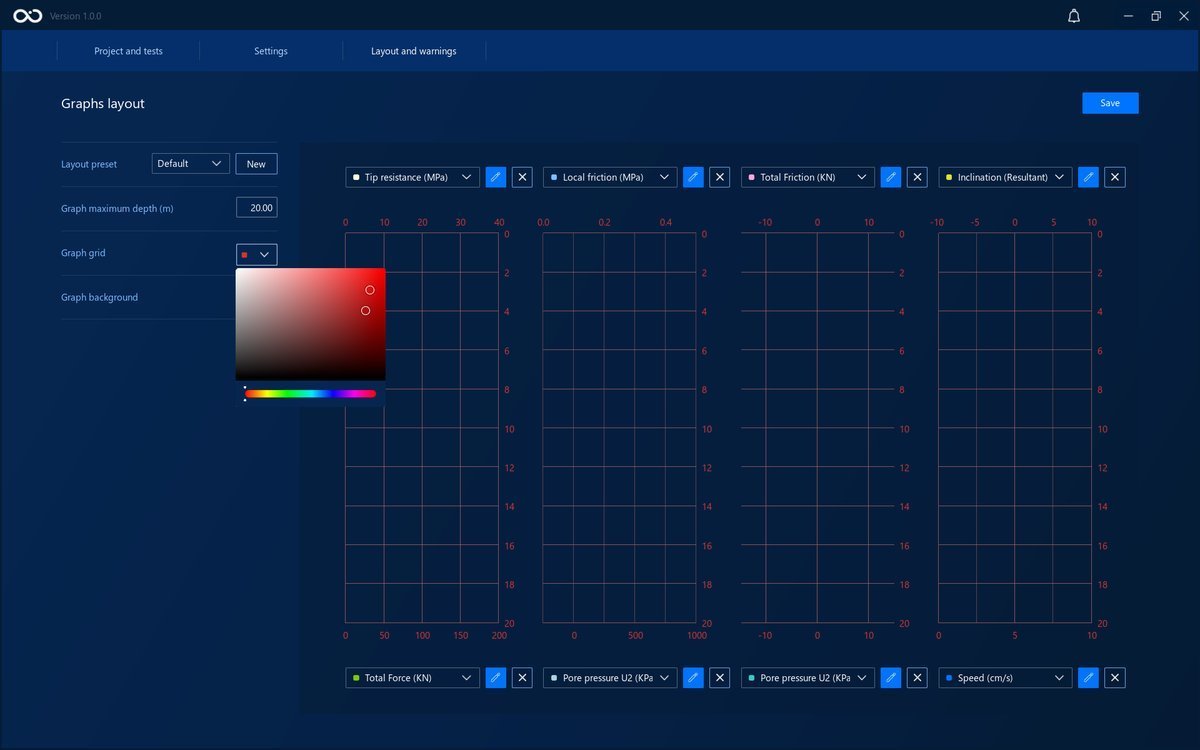 |
| Graph background | The background's color of every graph | 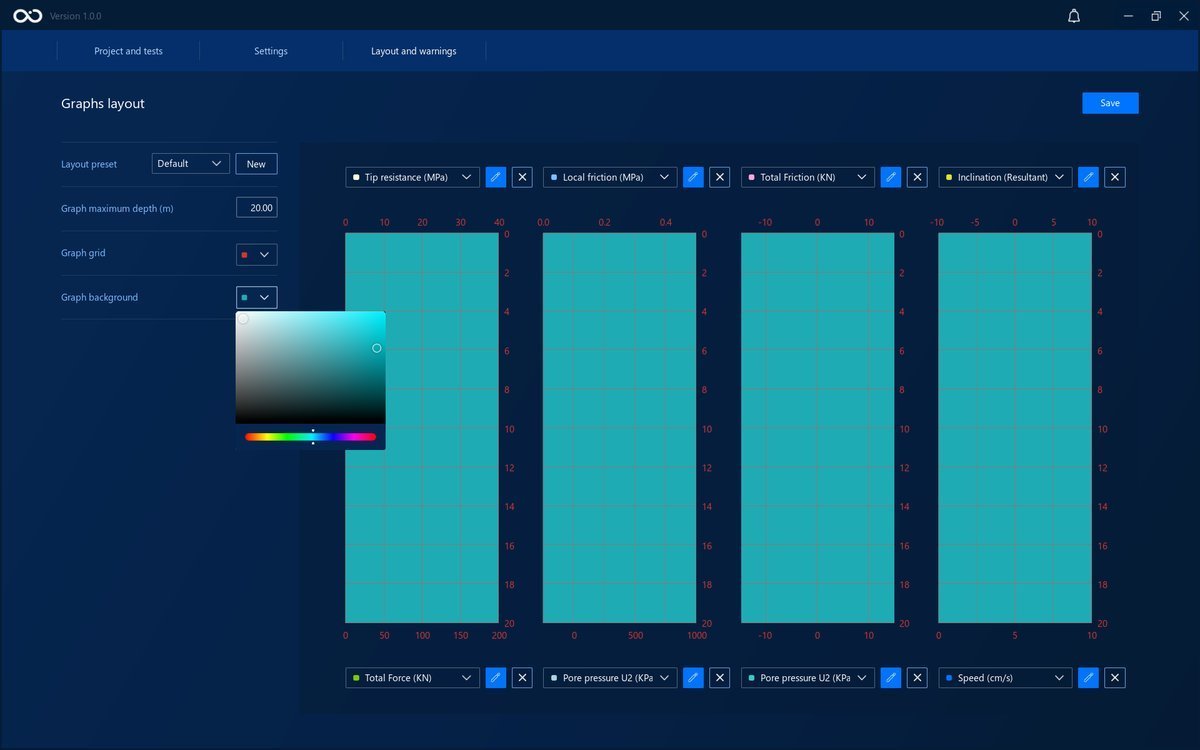 |
Define channel properties
A preset can hold up to eight channels, with a maximum of two per graph. You can add, switch, or remove channels from the presets. You can also edit the graph's line colors and the graph's range for that channel.
| Property | Explanation | Example |
|---|---|---|
| Add/Switch a channel | Add or switch a channel to a specific graph using the dropboxes above or below the graphs | 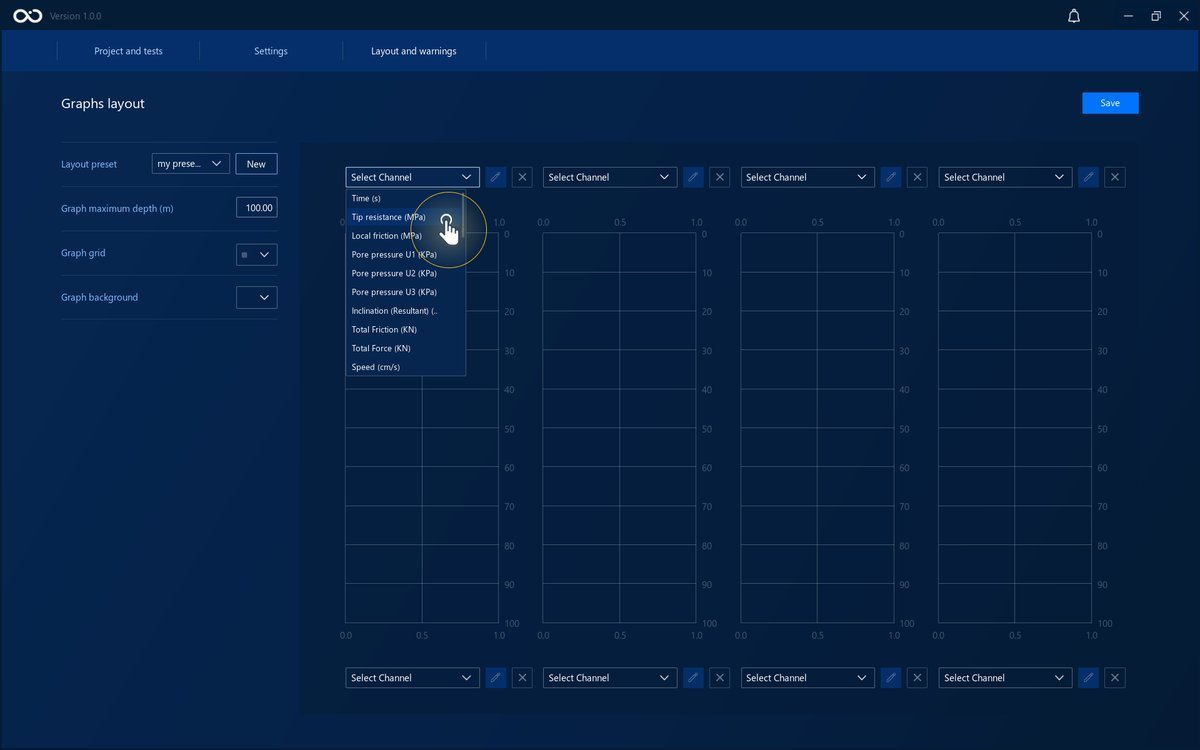 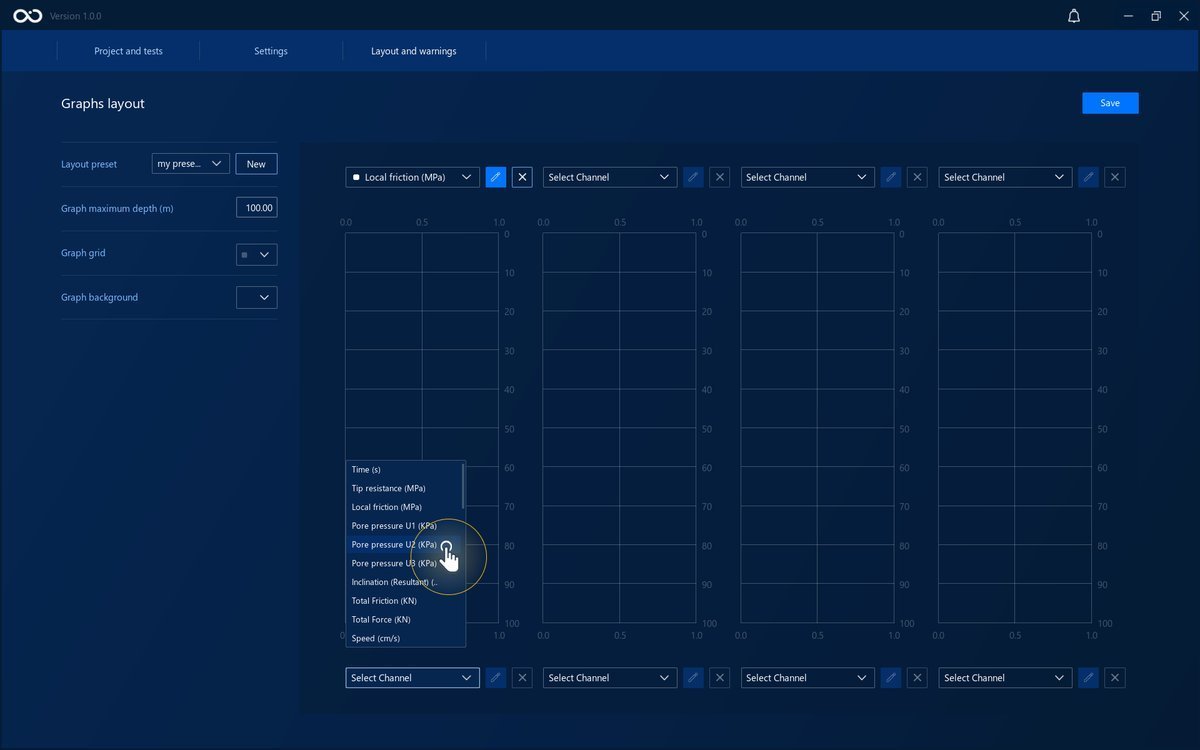 |
| Remove a channel | Remove a channel from the preset. If a graph has no channels, nothing will be plotted in it | 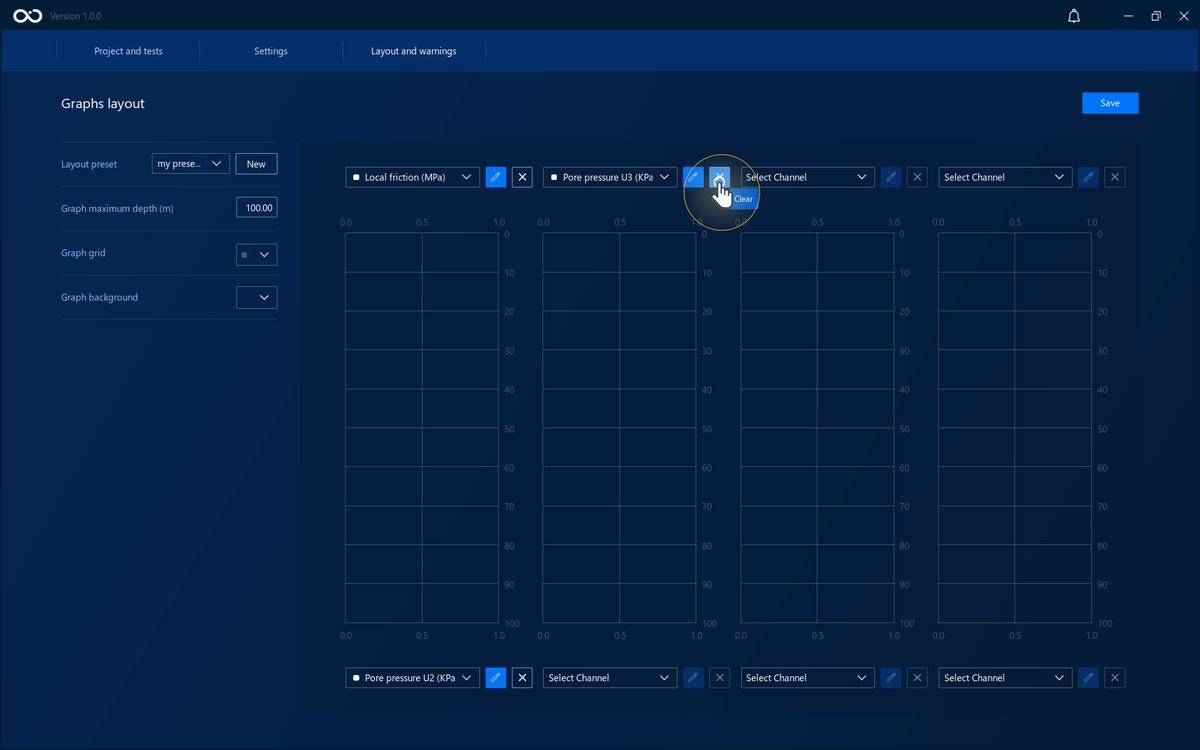 |
| Set range | Set minimum and maximum values for the graph to plot for that specific channel | 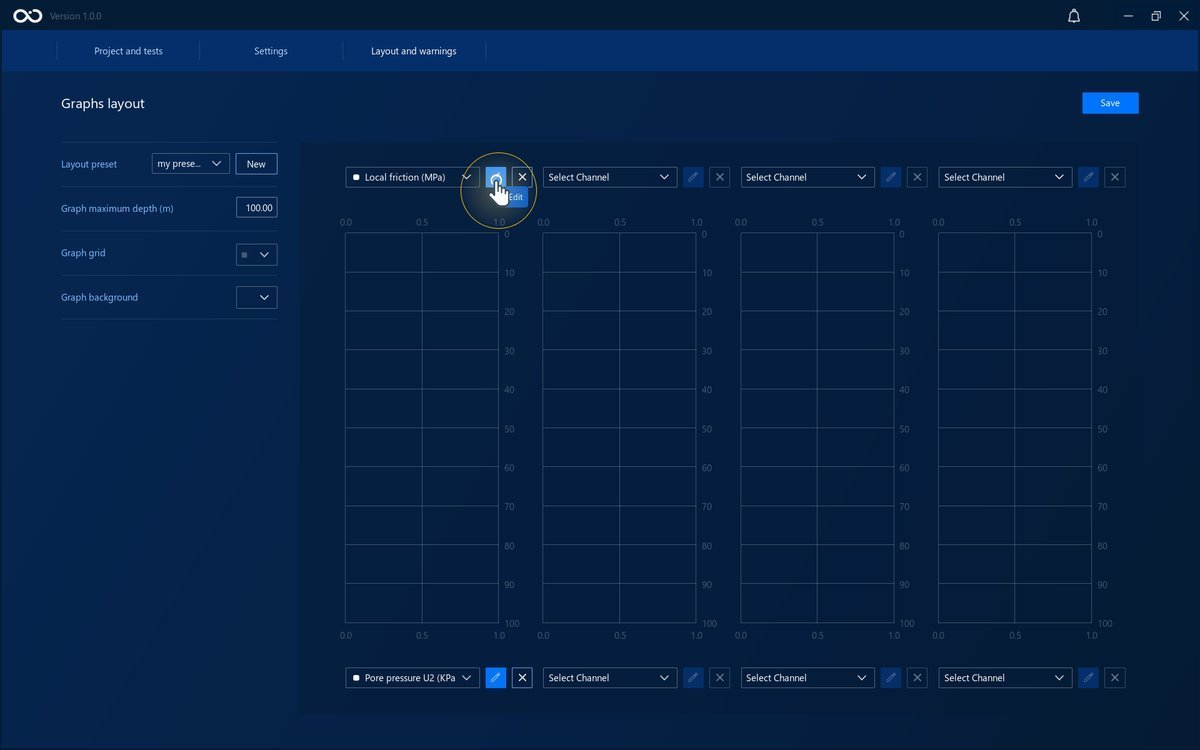 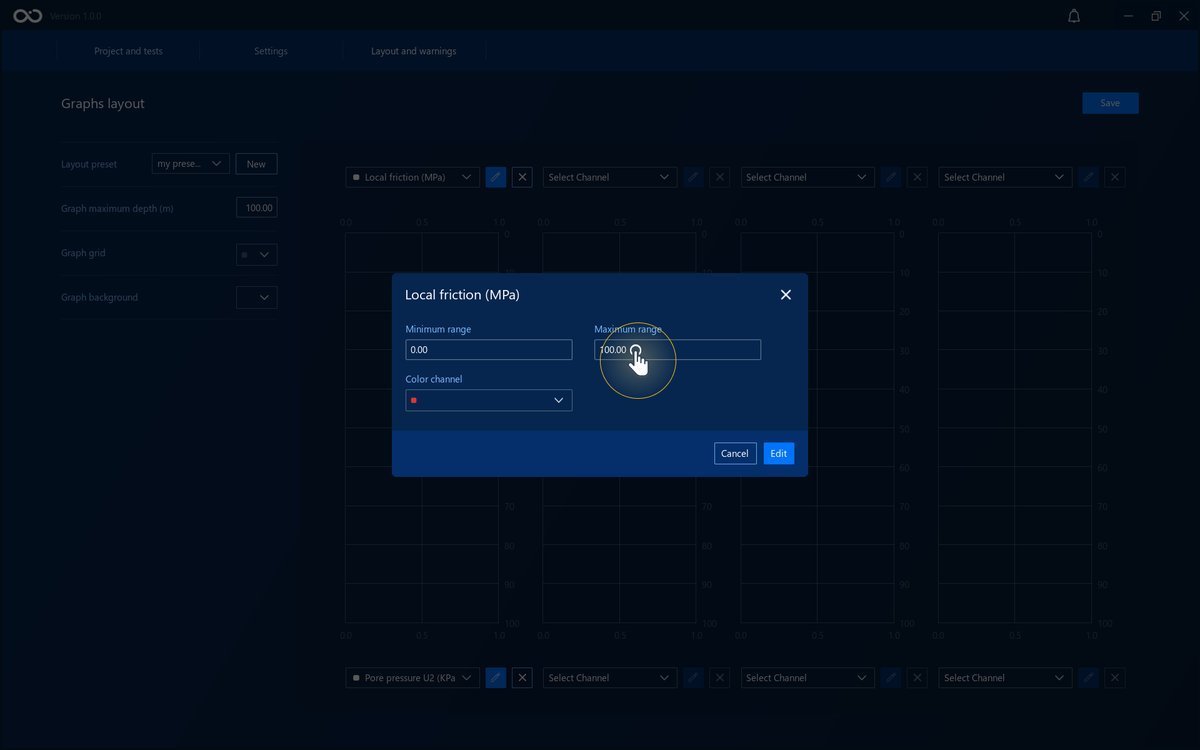 |
| Set line color | Set the line color that will be plotted for that channel | 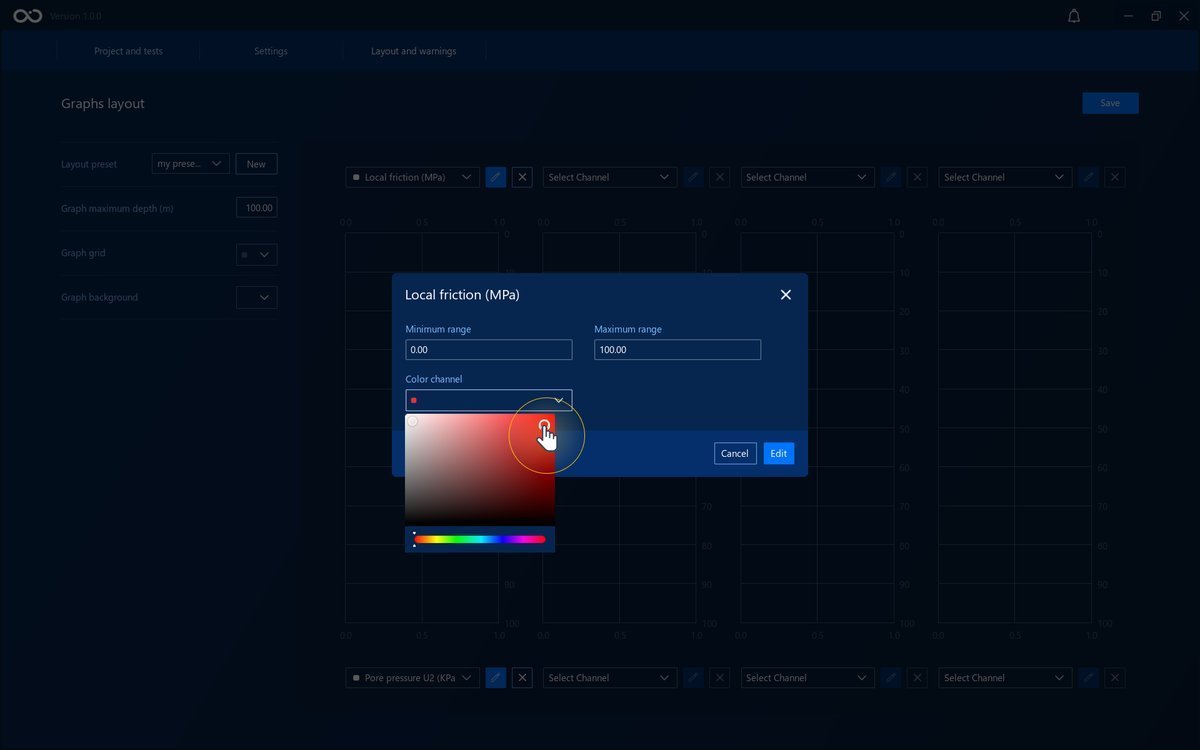 |
Save preset or Discard Changes
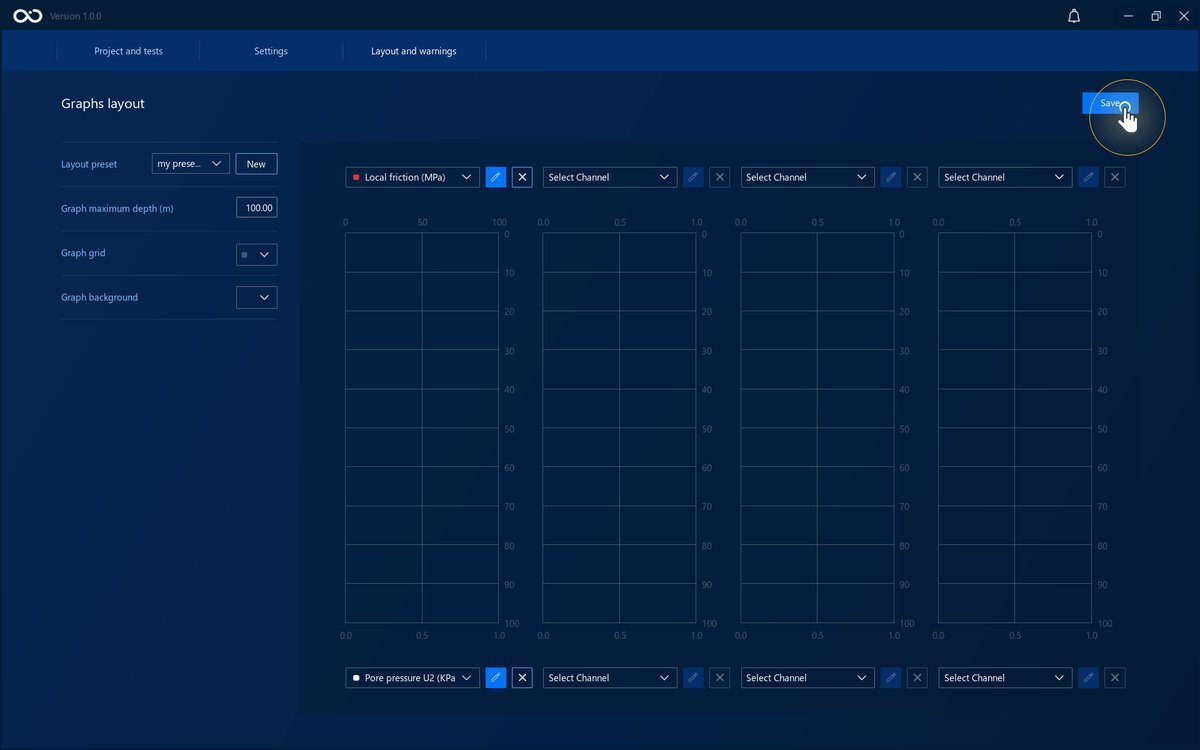
To save your changes to the preset, click the Save button.
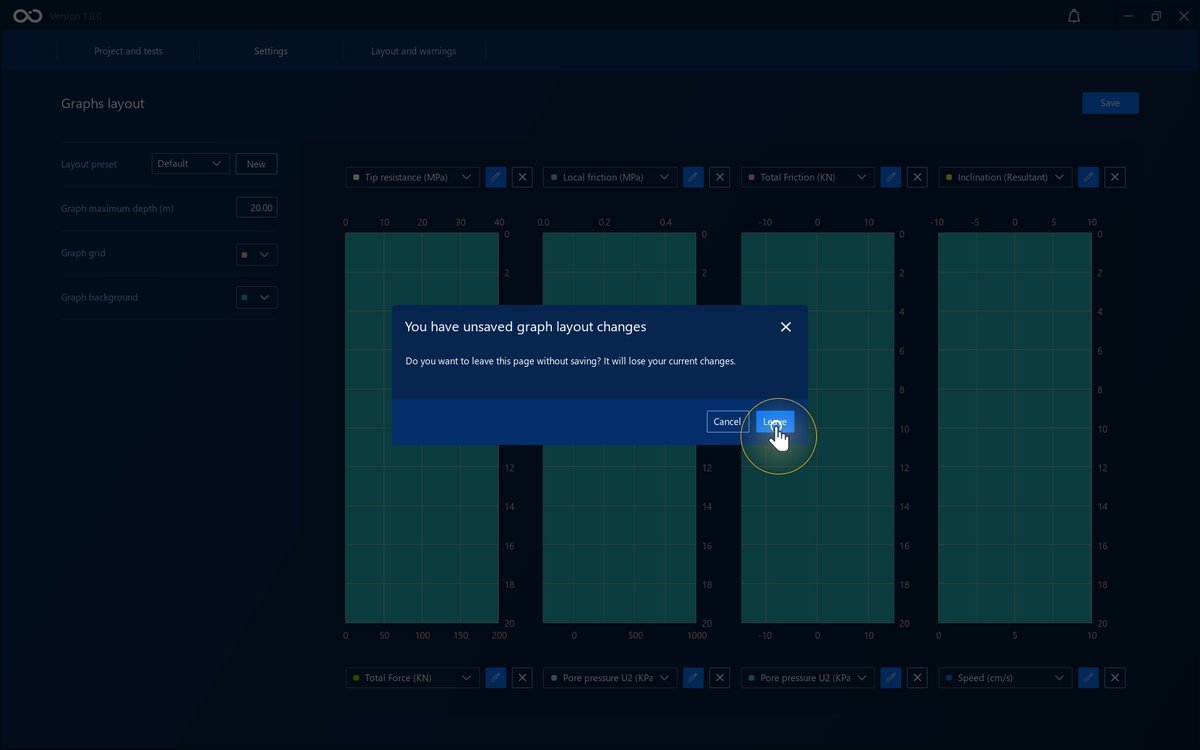
To discard any changes that were made, leave the page.
Select a Preset
You can select a preset for all the tests in a project or for a specific test. This is only possible for tests that were not Completed or To Review.
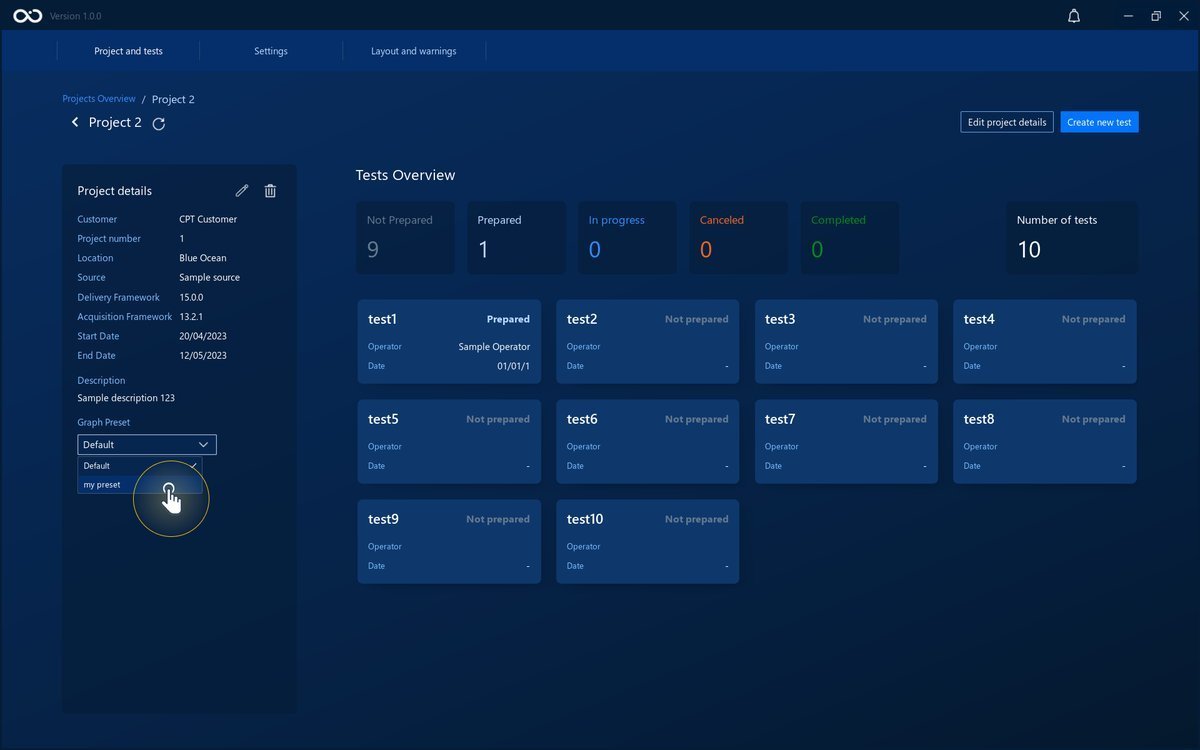
To select the same preset for all tests, use the dropdown button in the Project Dashboard.
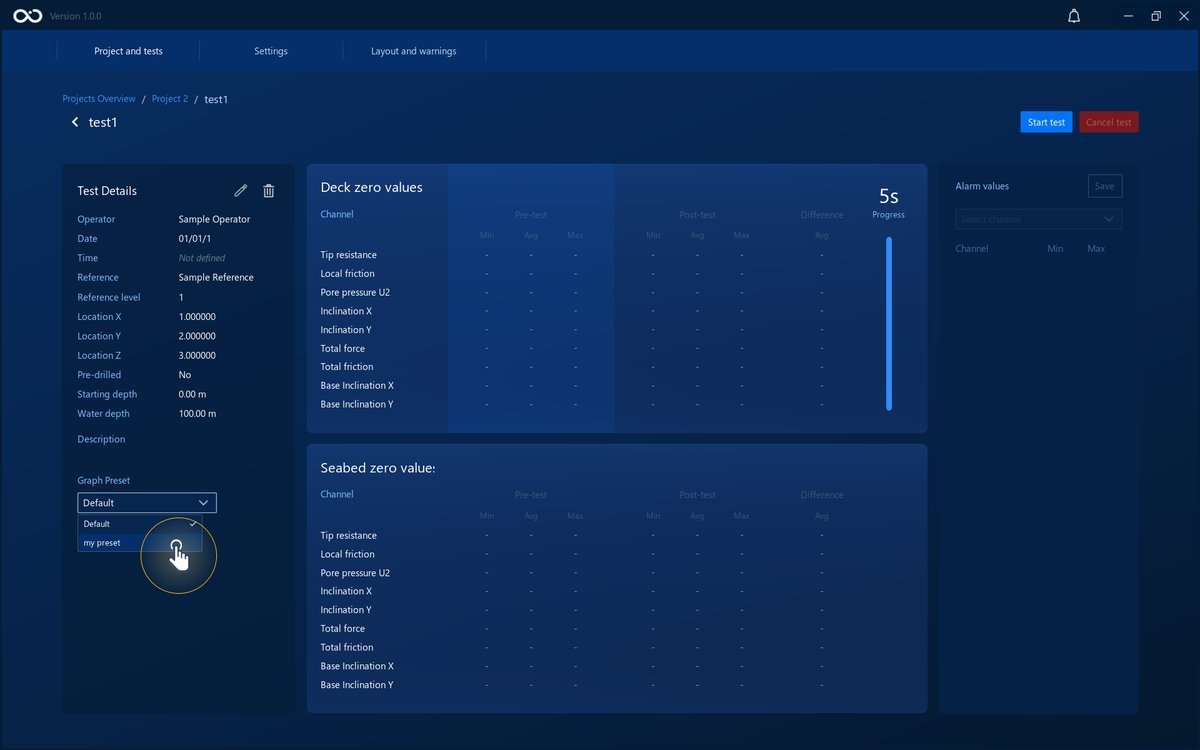
Use the dropdown button in the Test Dashboard to select a specific preset for one test.
Alarms
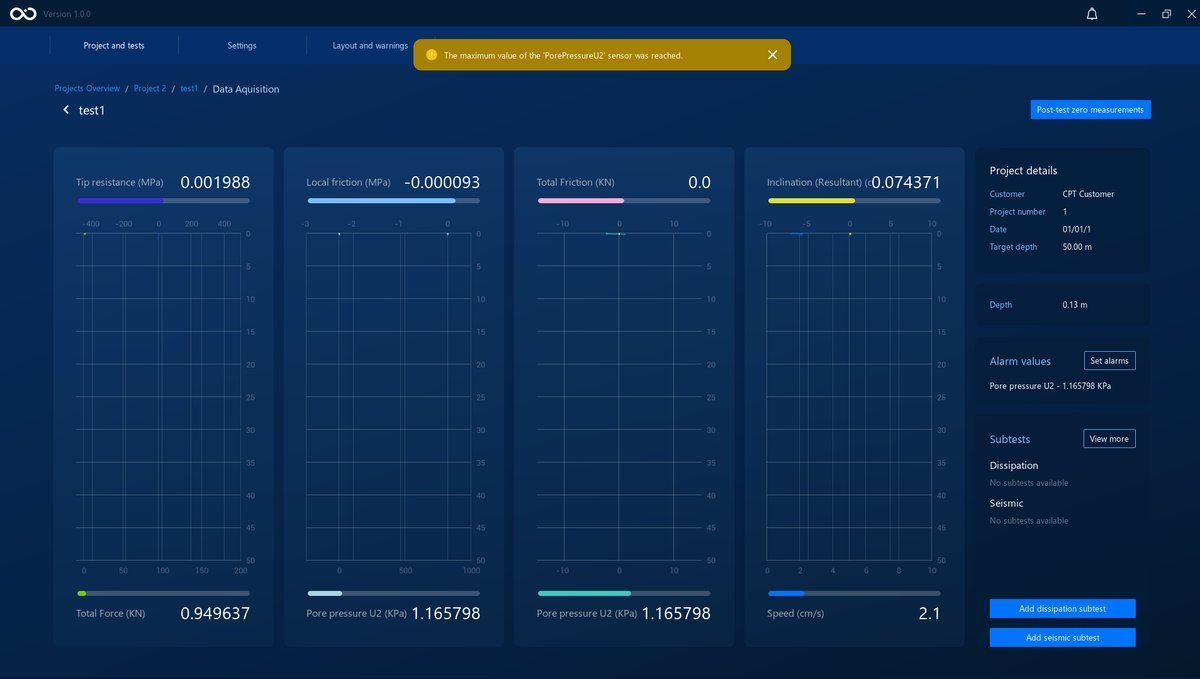
By setting Termination Alarms, you can set minimum and maximum values for any channel. You'll get a notification when that channel goes under or over those values, and the Data Acquisition process is paused. This will also trigger a Controlled STOP on the Roson. The image below shows when the Data Acquisition is paused and the responsible alarm's notification.
Set an Alarm
The action to set an alarm can be done in the Data Acquisition phase of the test. To do that, click the Set alarms button on the Test Graphs page.
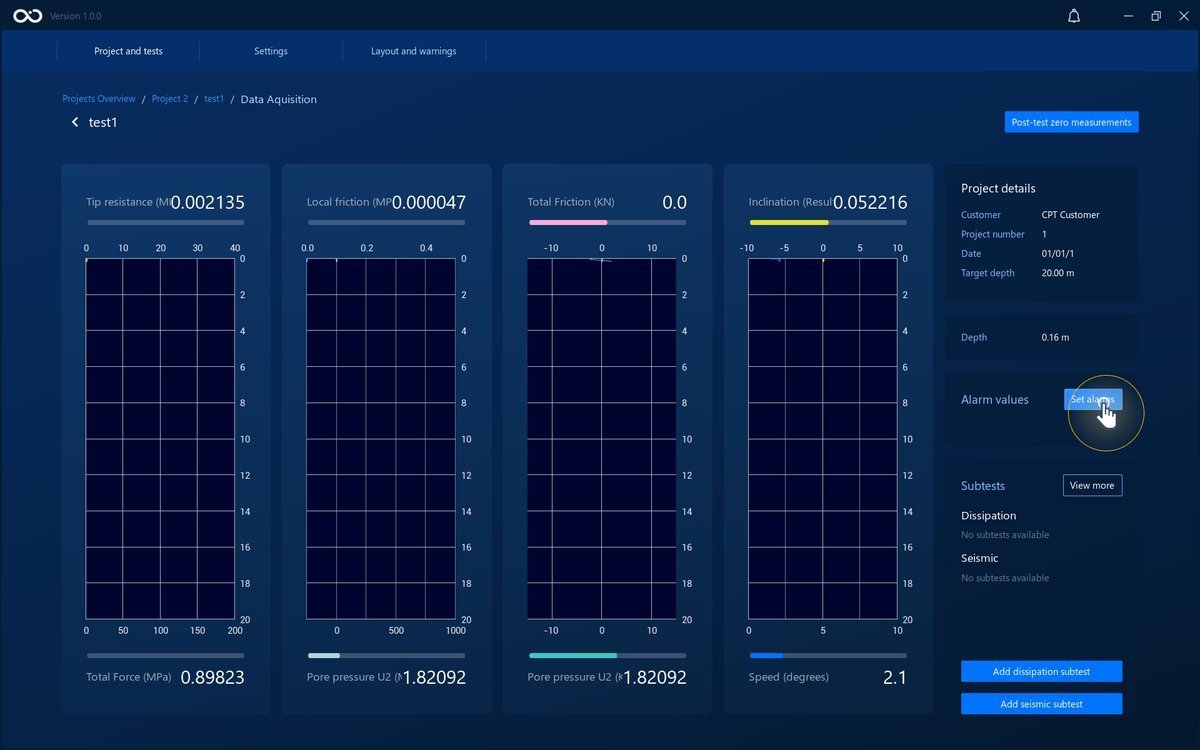
You can pick the channels to add alarms to in the dropdown button. The alarms available in the dropdown are given by the modules installed on the Roson.
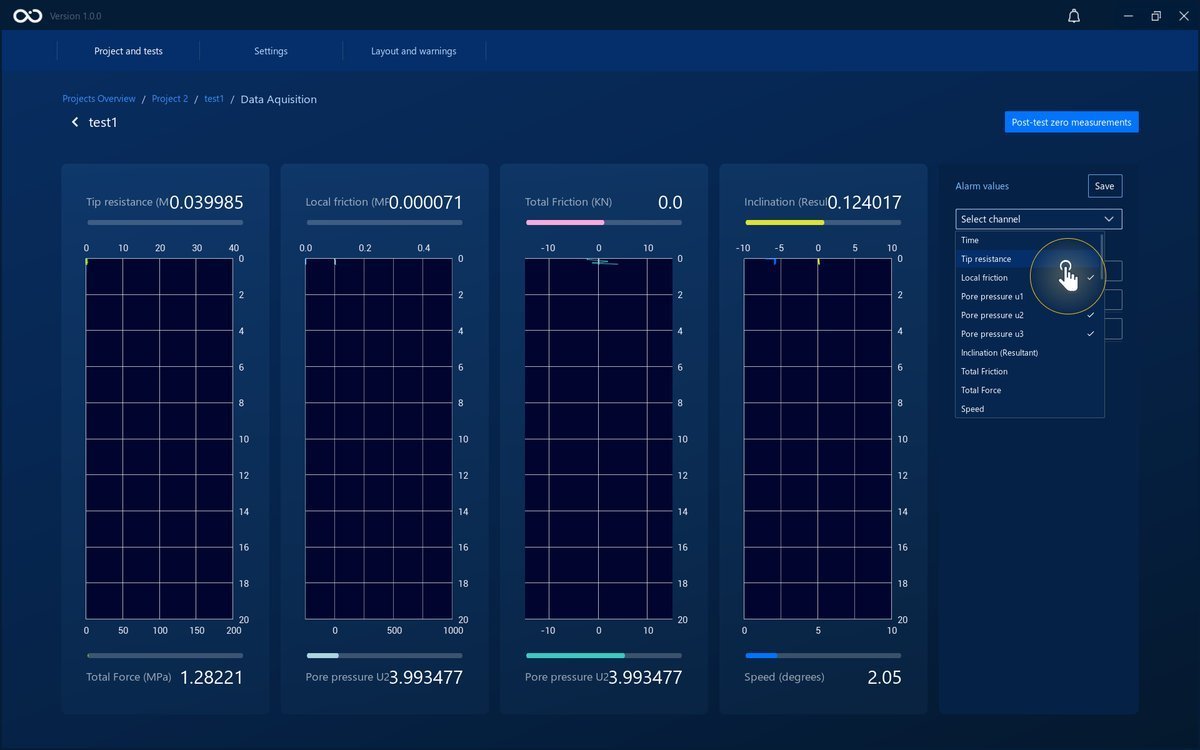
With the chosen channels, you can now write the minimum and maximum values to which the alarms react.
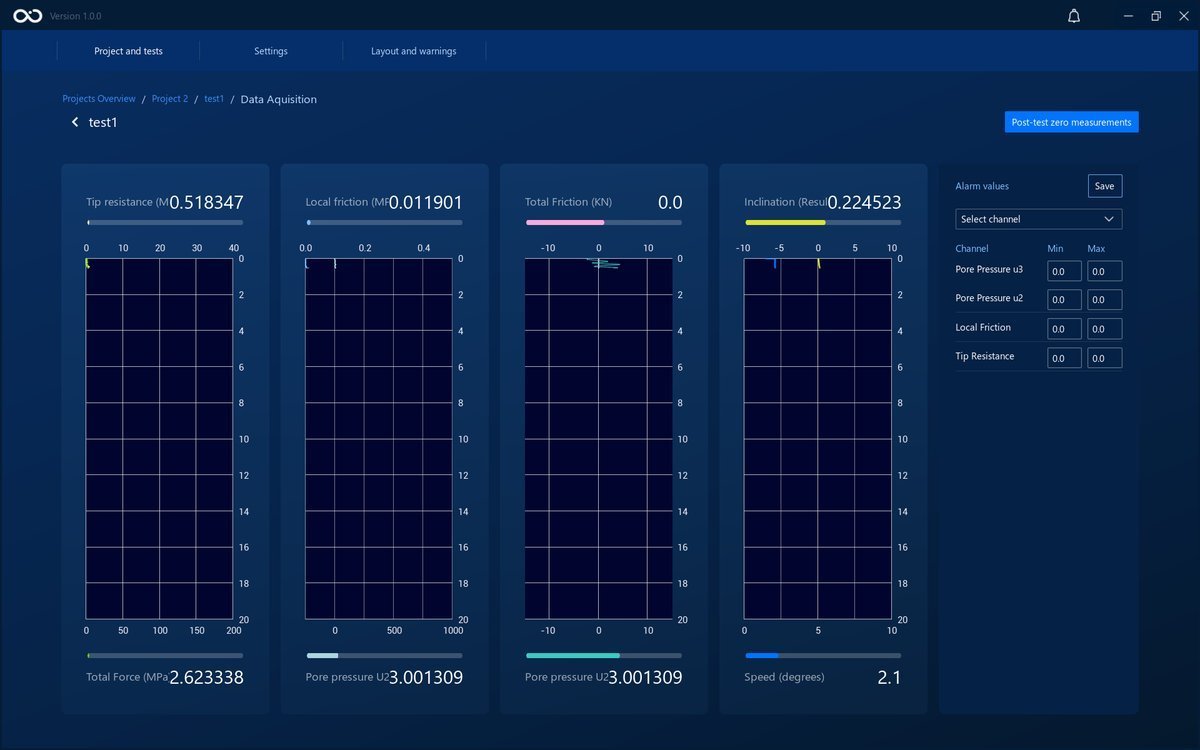
To save the alarms, click the Save button.
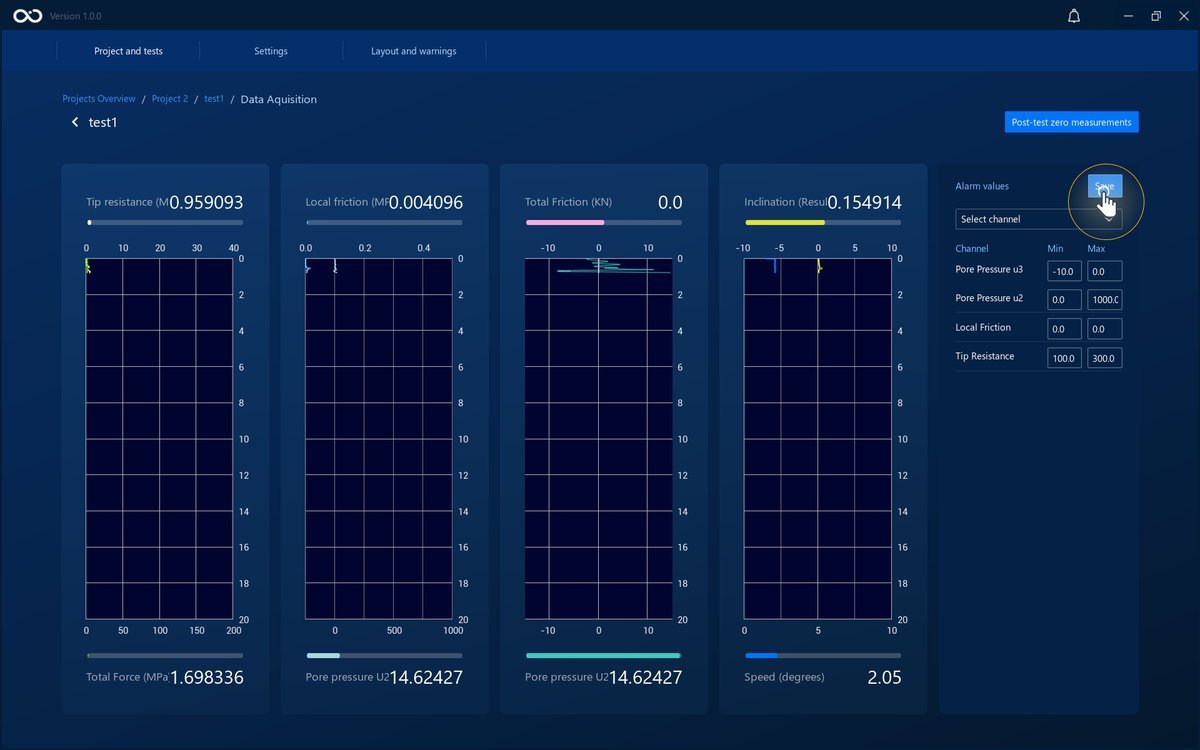
The alarms will now be set. You can see them in the panel to the right of the graphs.
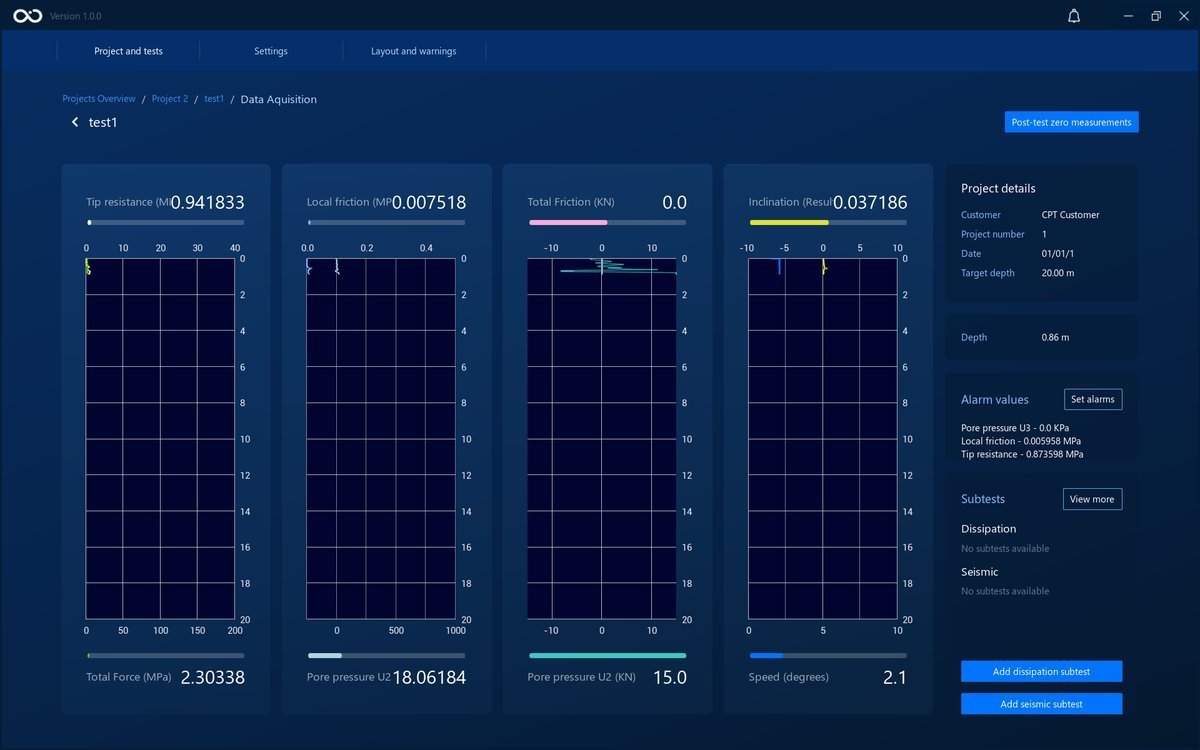
Ended: Prepare Operation
Execute a CPT
The following section is a guide on how to execute a CPT.
Before starting a test, it must be in the Prepared state (see Prepare Operation section). Upon starting a test, it will change its state to In progress. Only one test can be In progress at the same time.
When the Start button is pressed, as long as there is a stablished QINSy connection, Location X, Y and UTM zone fields will stream data received from QINSy, and Location X and Y will also display an icon confirming such connection. If the connection failed, those icons will disappear, the data stream will stop and the user will have to fill the Location X and Y manually.
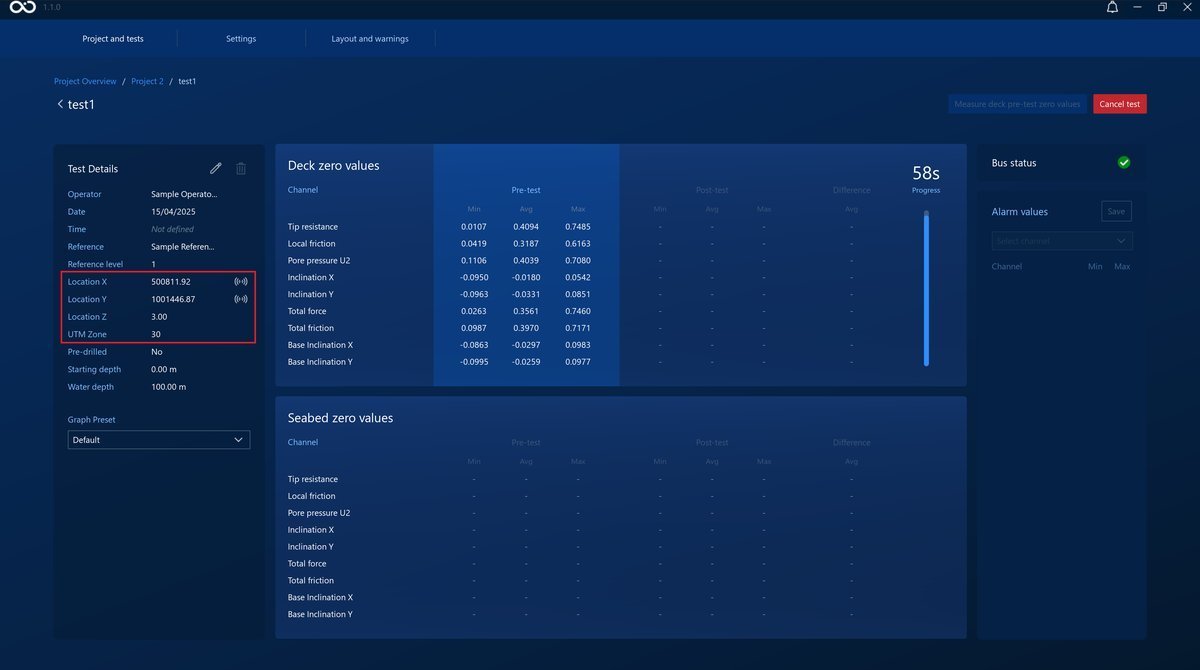
Before the Data Acquisition phase, you can click the Cancel test button. This will restart the test to Prepared. Once the data acquisition starts, you need to complete the test with a completion reason.
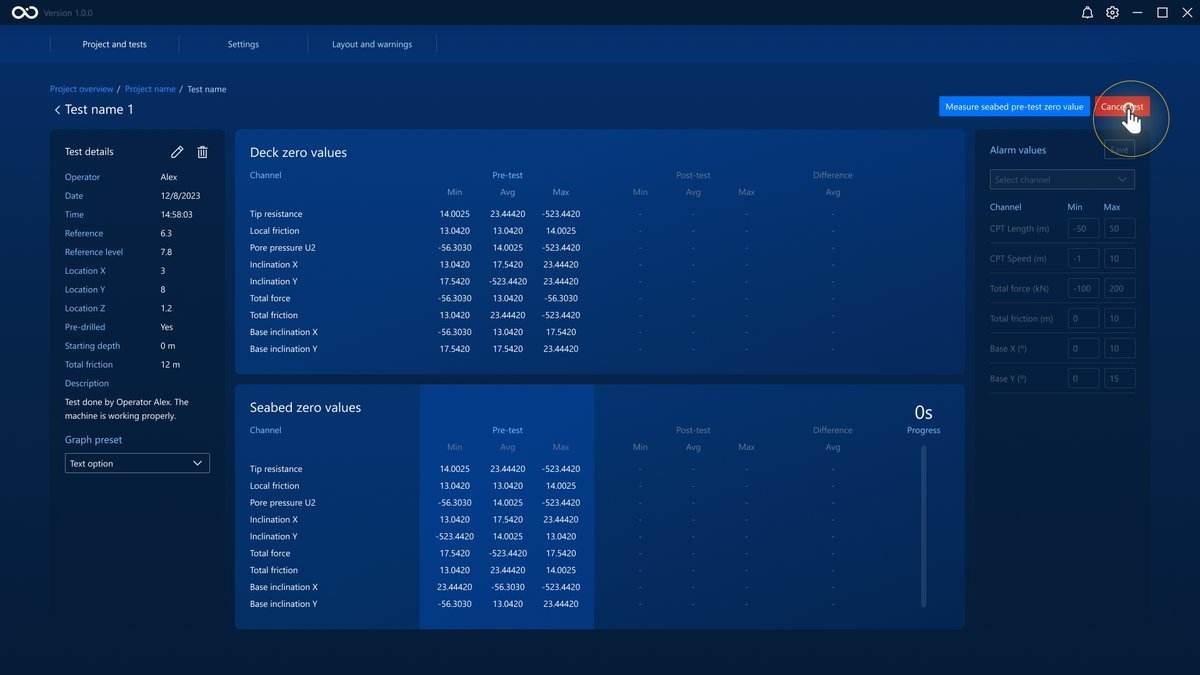
Pre-Test Zero Readings
The Pre-Test Zero Readings are the starting step of a CPT test.
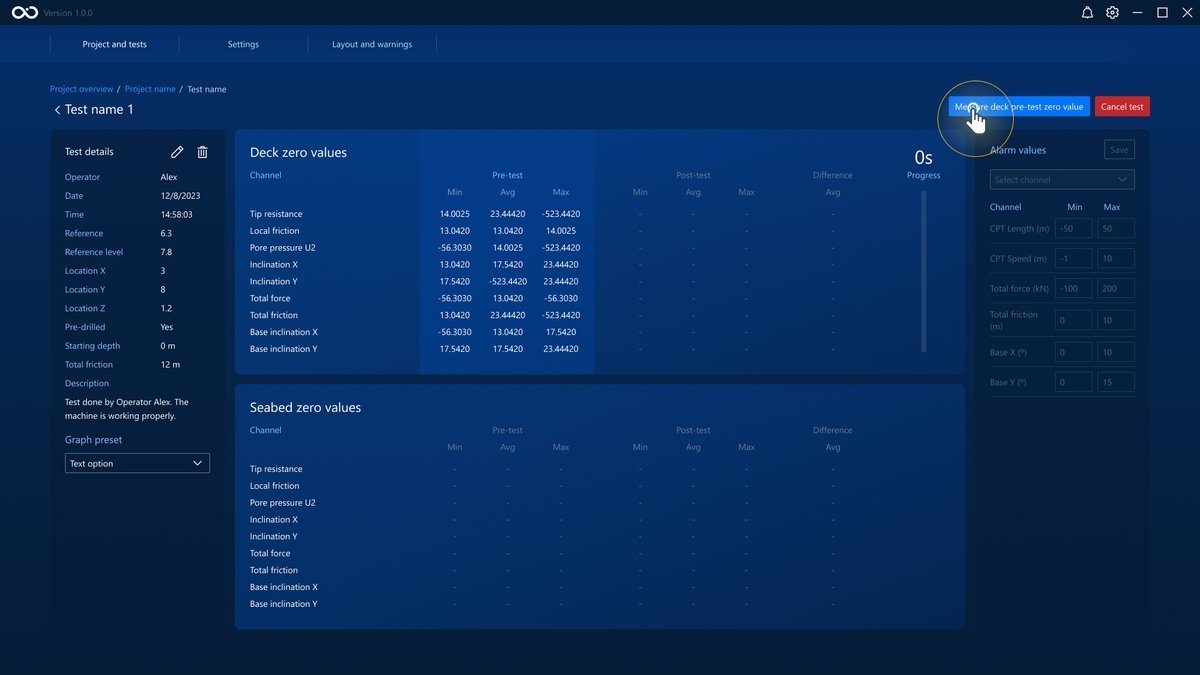
Click the button Start test to begin receiving Pre-test Deck Zero values.
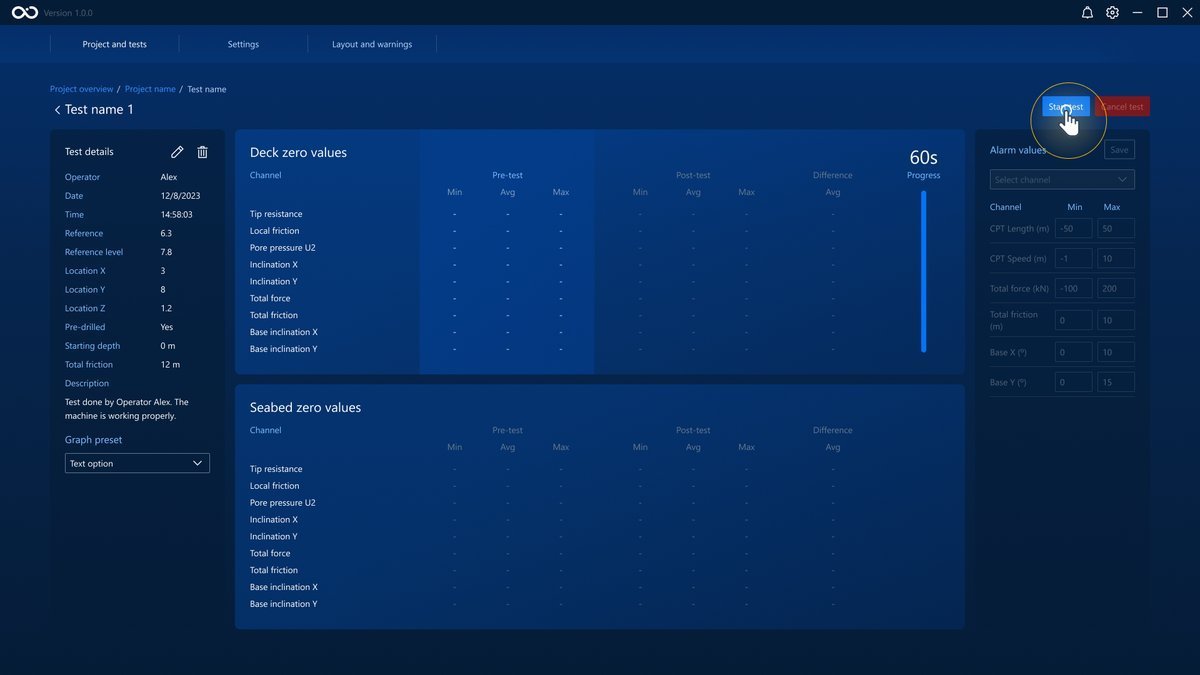
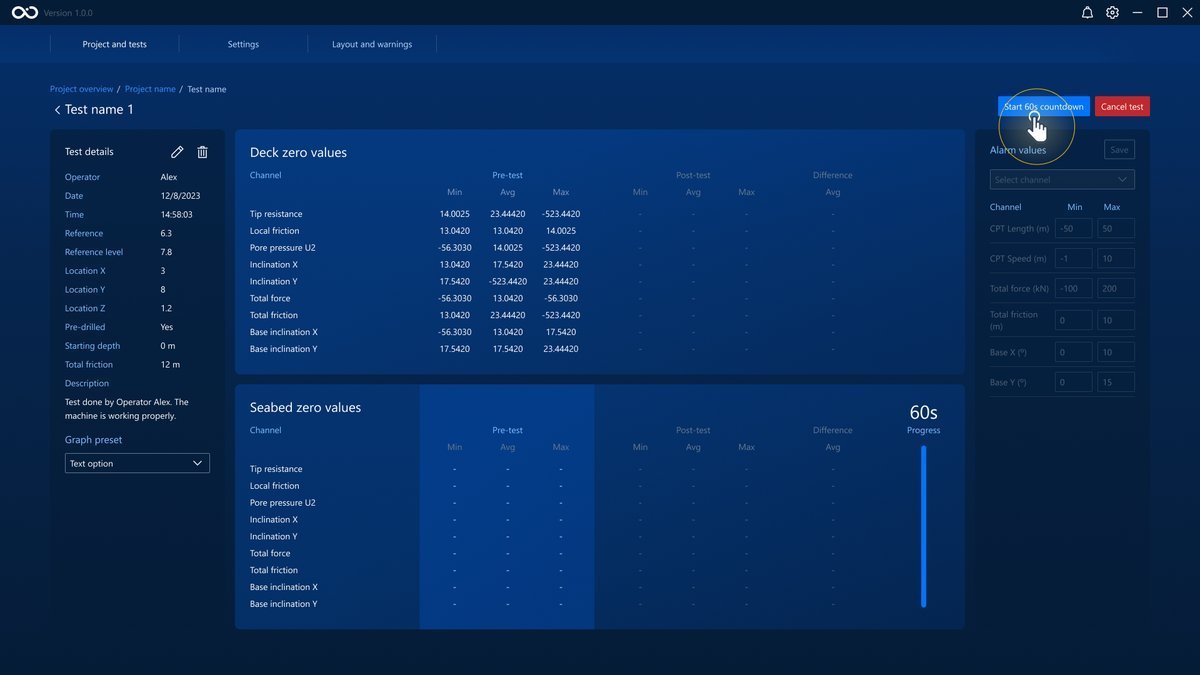
Each set of measurements needs to last at least 60 seconds. You can see how much time is left in the progress bar in the right of each measurement panel.
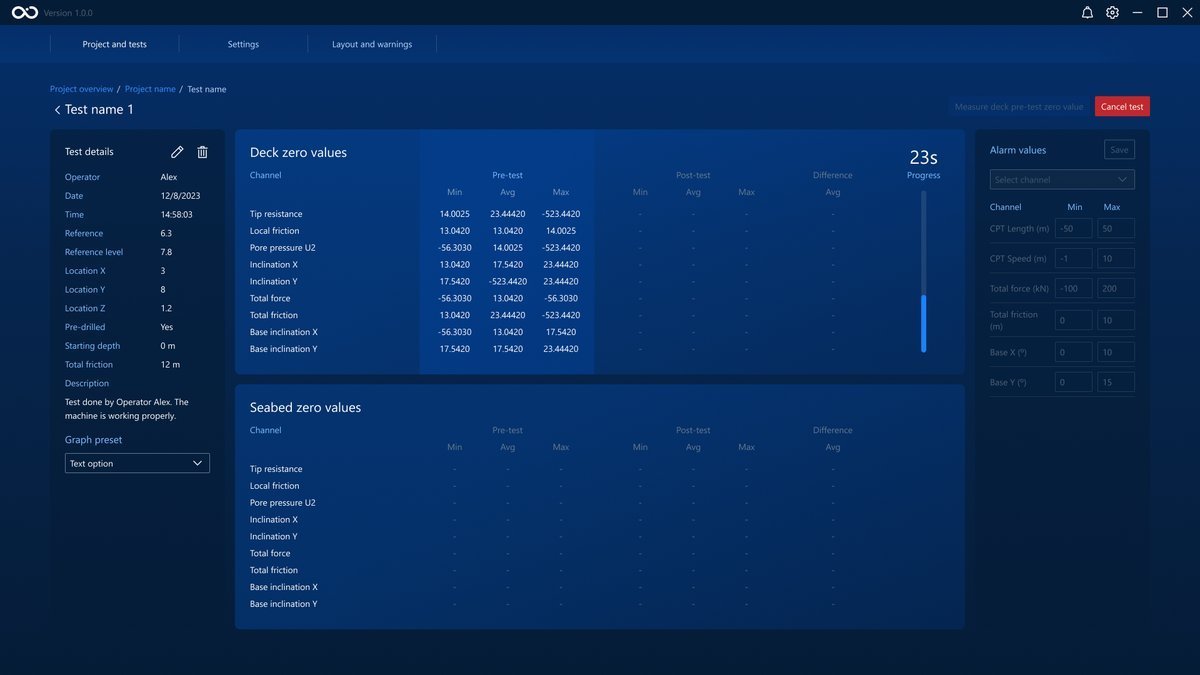
After at least 60 seconds have elapsed, you can register the measurements by clicking the button Measure deck pre-test zero value . The registered measurements are those received 60 seconds directly before clicking the button. This is true for every Zero Reading.
To start receiving Pre-test Seabed Zero values, click the button Start 60s countdown .
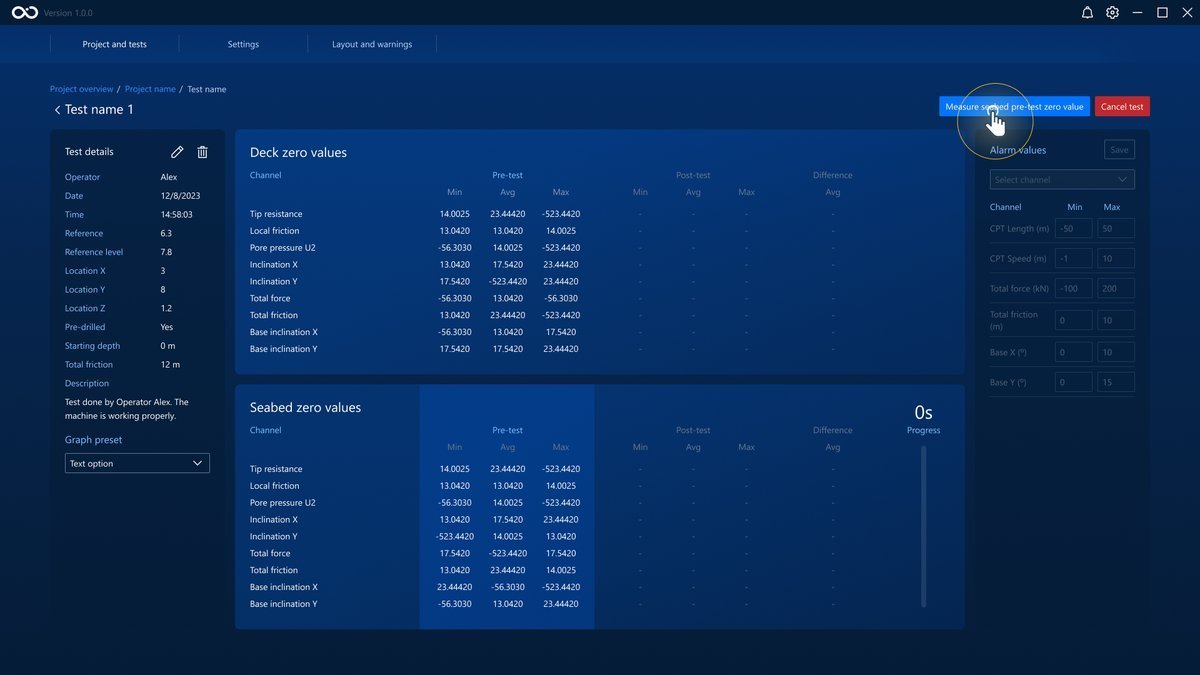
After the countdown, register these measurements by clicking the Measure seabed pre-test zero value button.
Data Acquisition
Once the Pre-Test measurements are registered, you will be taken automatically to the Test Graphs page.
On this page, you can see the received data being plotted against depth in the graphs for each preset that was selected previously (see Alarms).
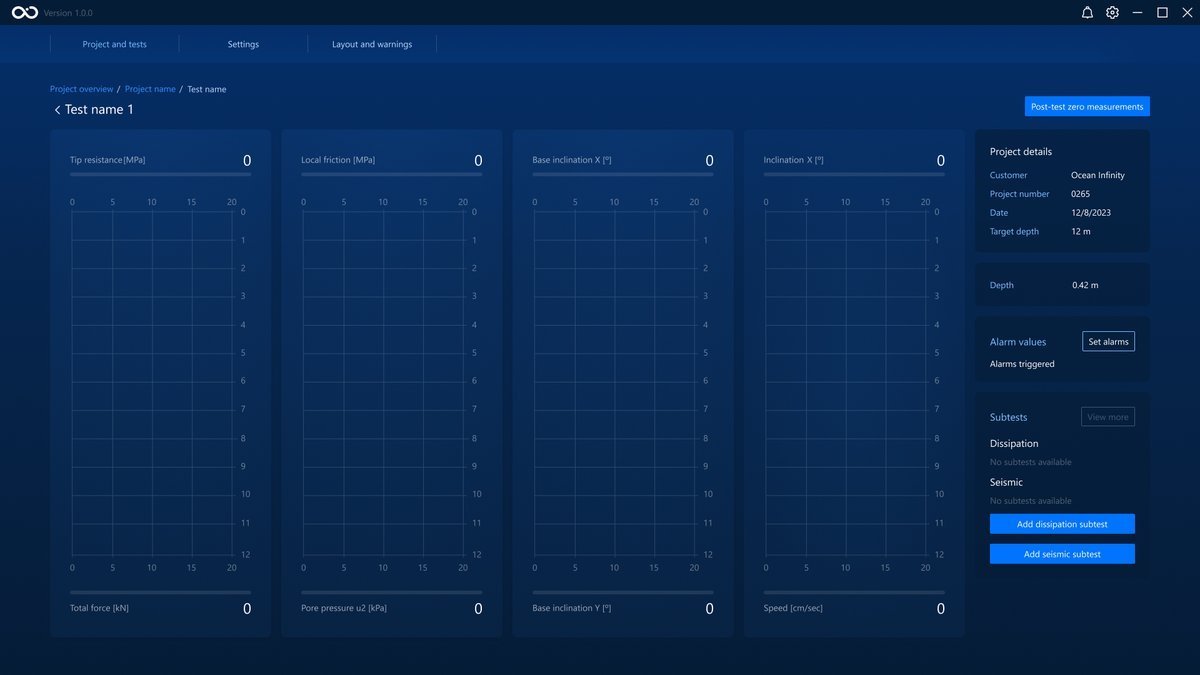
At any point in the data acquisition process, you can revisit the ongoing test or other tests' Test Dashboards. The process will continue in the background. Remember that you cannot start another test while this one is In progress.
If there is a connection to QINSy, after the depth has reached 10cm, a notification will point out that the coordinates will be saved in the GRU file for the test. In case of QINSy not being connected, a notification will highlight that the coordinates were not saved and you should retrieve the coordinates manually.
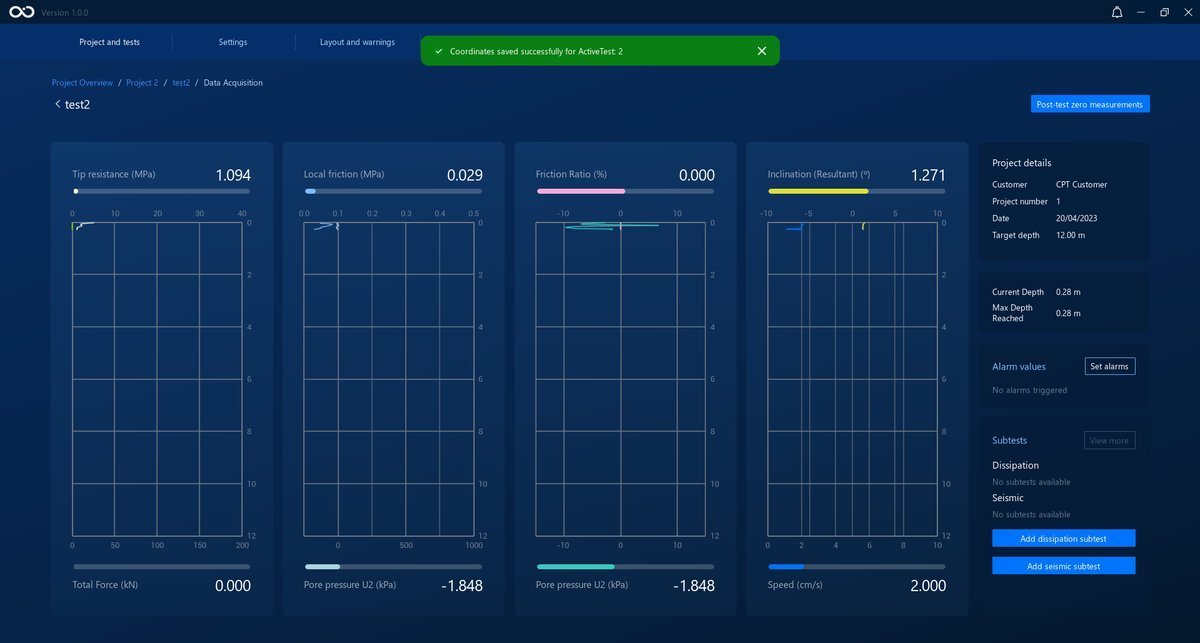
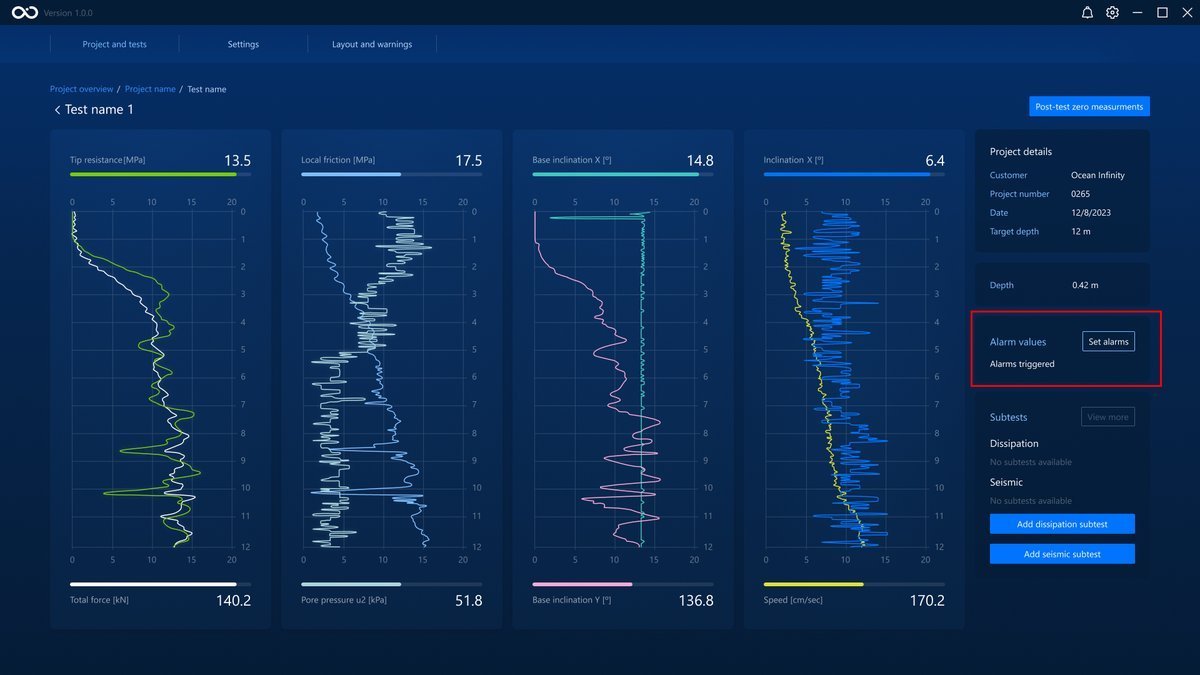
You can set Alarms in this phase (see Set an Alarm) for as many channels as you'd like. When a certain channel goes over the minimum or maximum values set in its alarm, it will stop the Data Acquisition. This will also trigger a Controlled STOP on the Roson. To continue, adjust the Alarm values, and Reset the Alarm using the HMI software (see Reset Alarms).
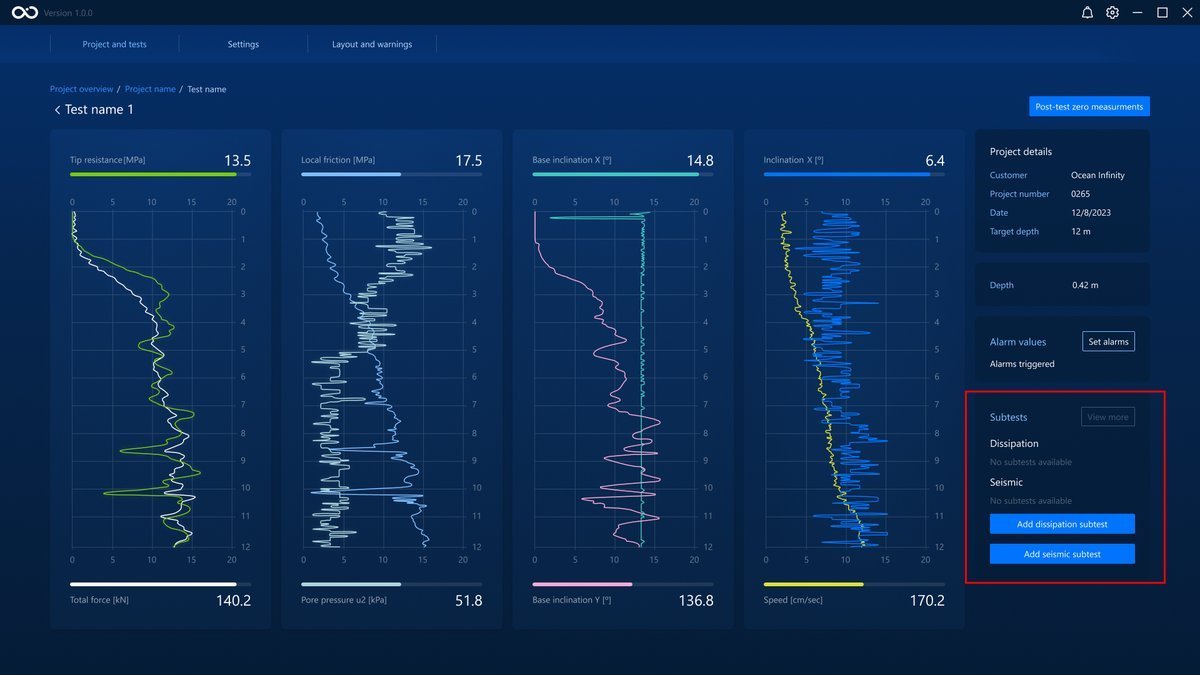
In this phase you can also do dissipation or seismic subtests. Starting a subtest will pause the current data acquisition until you complete the subtest. See sections Dissipation Subtests and Seismic Subtest for more information about the subtests.
To finish the data acquisition, click the Post-test zero measurements button on the Test Graphs page.
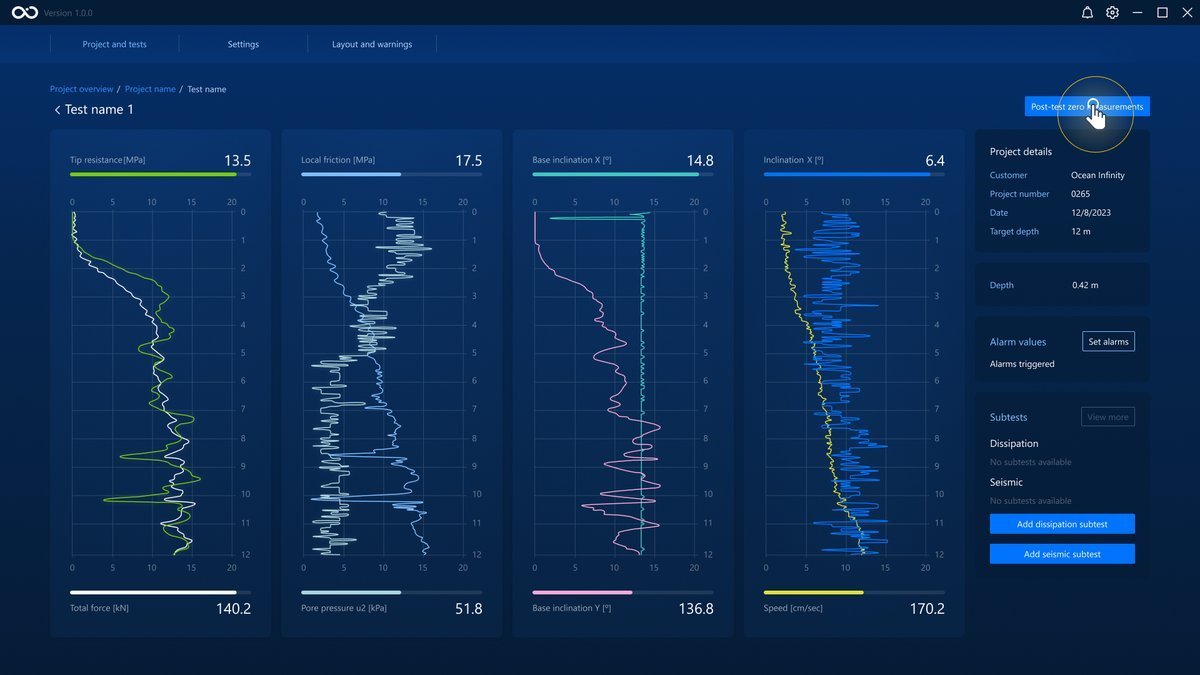
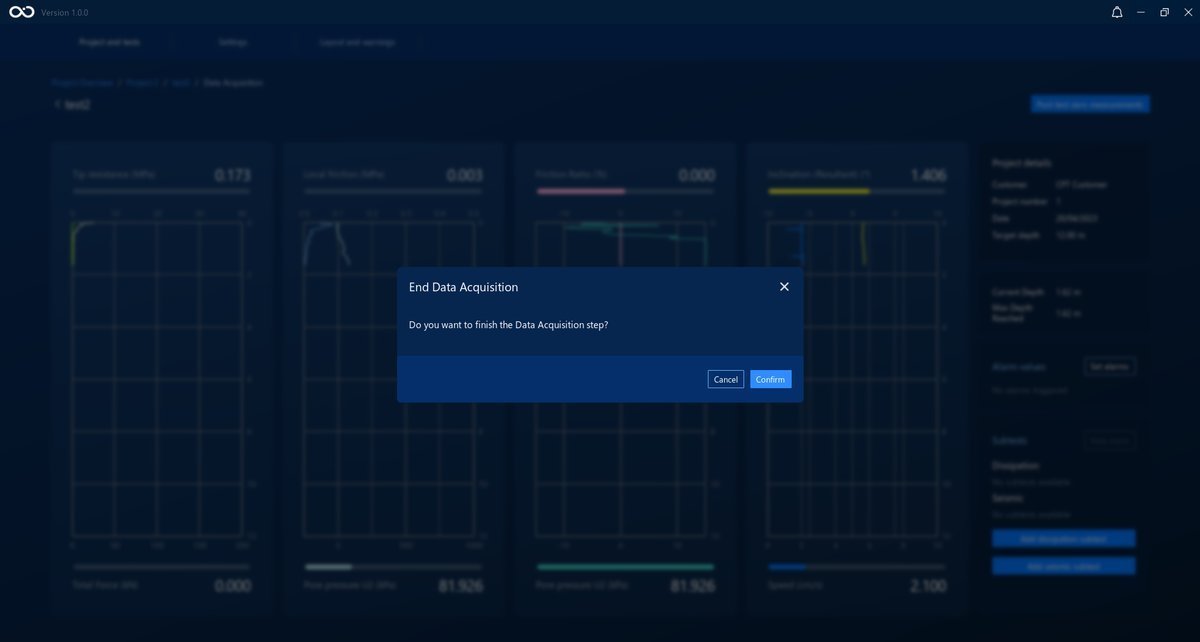
The program will ask for confirmation that you wish to finish the data acquisition. Pressing the confirm button will take you back automatically to the Test Dashboard page and begin the Post-test Zero Readings immediately.
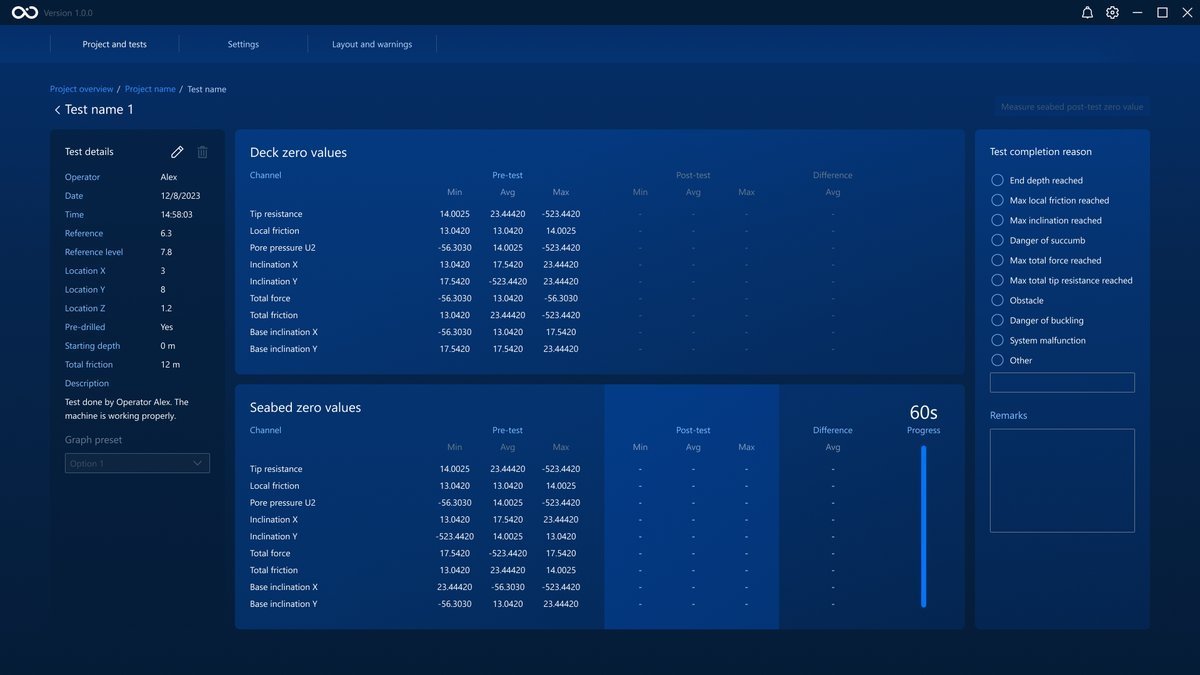
Post-test Zero Readings
The Post-test zero readings and 60 second countdown for the seabed values were started automatically after you finished the Data Acquisition process.
You can revisit the Test Graphs page once these Post-test Zero readings are completed.
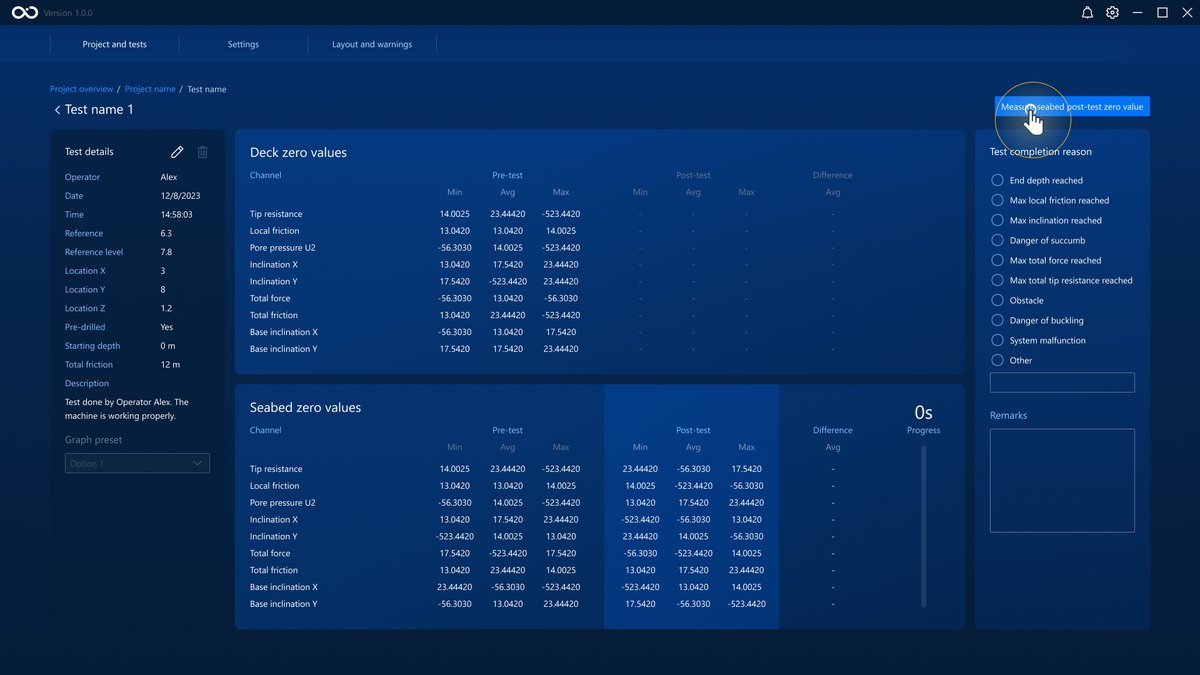
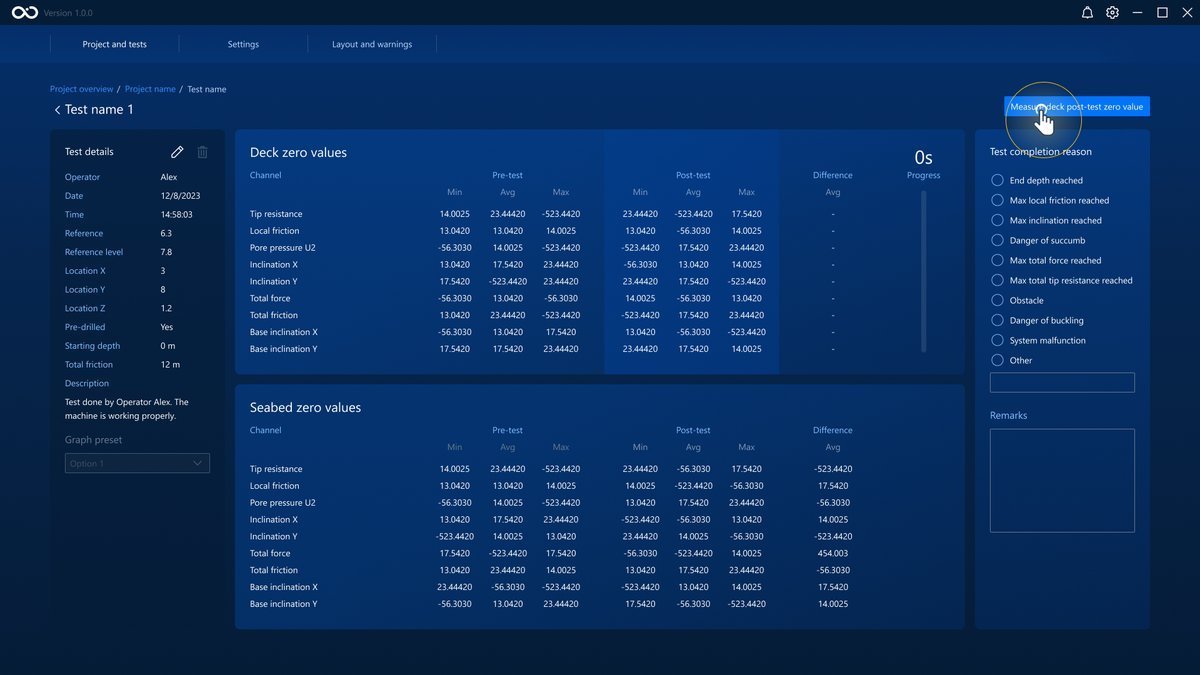
To register the zero values, click the Measure seabed post-test zero value . The difference between the pre-test and post-test values will be shown on the right side of the measurements.
Click the Start 60s countdown button to start the countdown and start receiving post-test Deck Zero values.
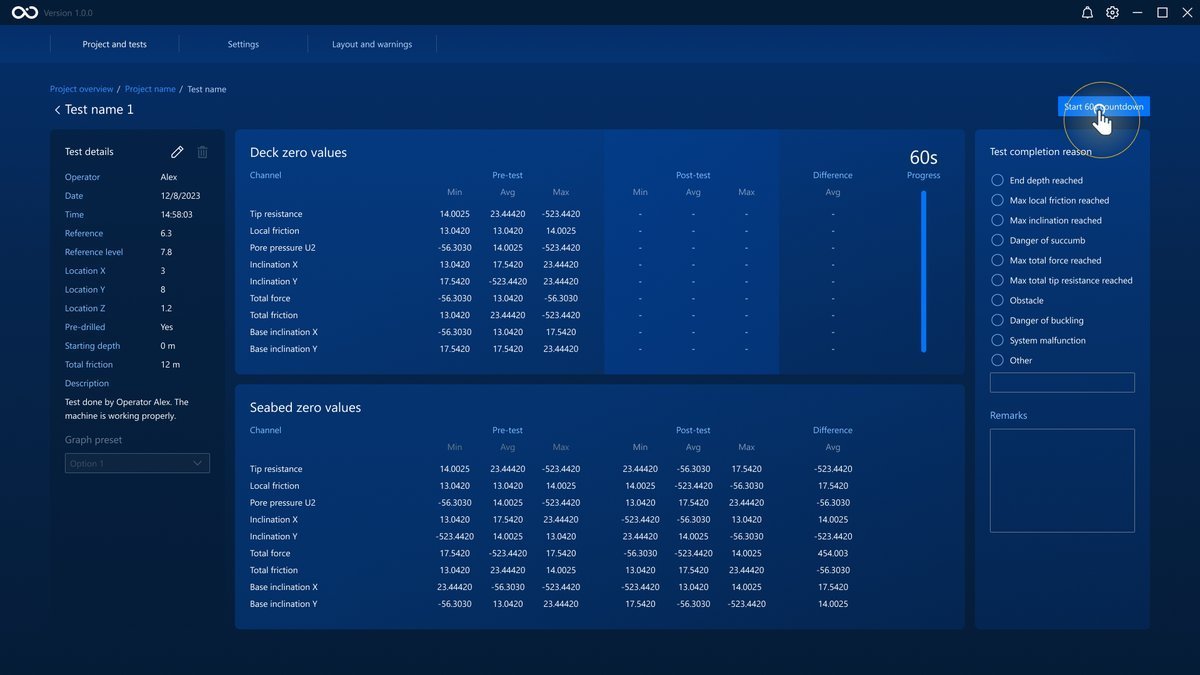
To register the zero values, click the Measure deck post-test zero value .
Complete the Test
Note
If the test finishes or errors but Complete test isn't pressed before the API disconnects, the test becomes Invalid and you'll be returned to the Project Overview automatically — see When a test becomes Invalid.
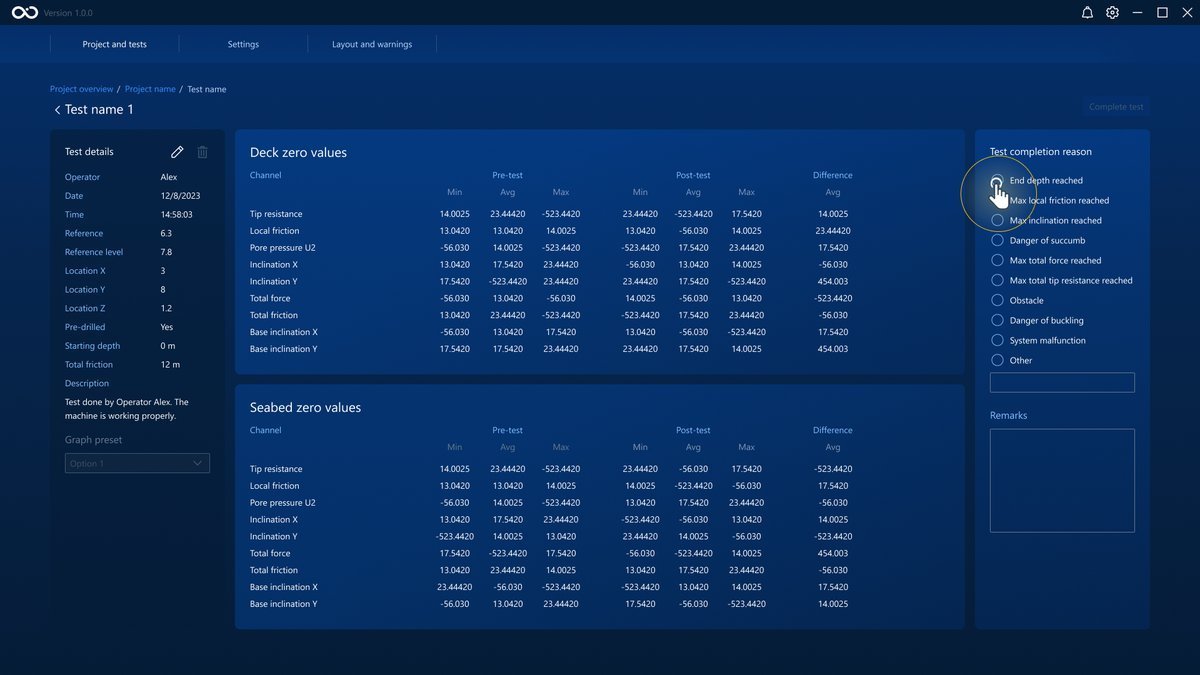
To complete the test, first, choose a Completion reason on the panel on the right. Depending on the reason, the test will either be Completed or To Review (see Completion reasons). A text box is also available to write any additional remarks.
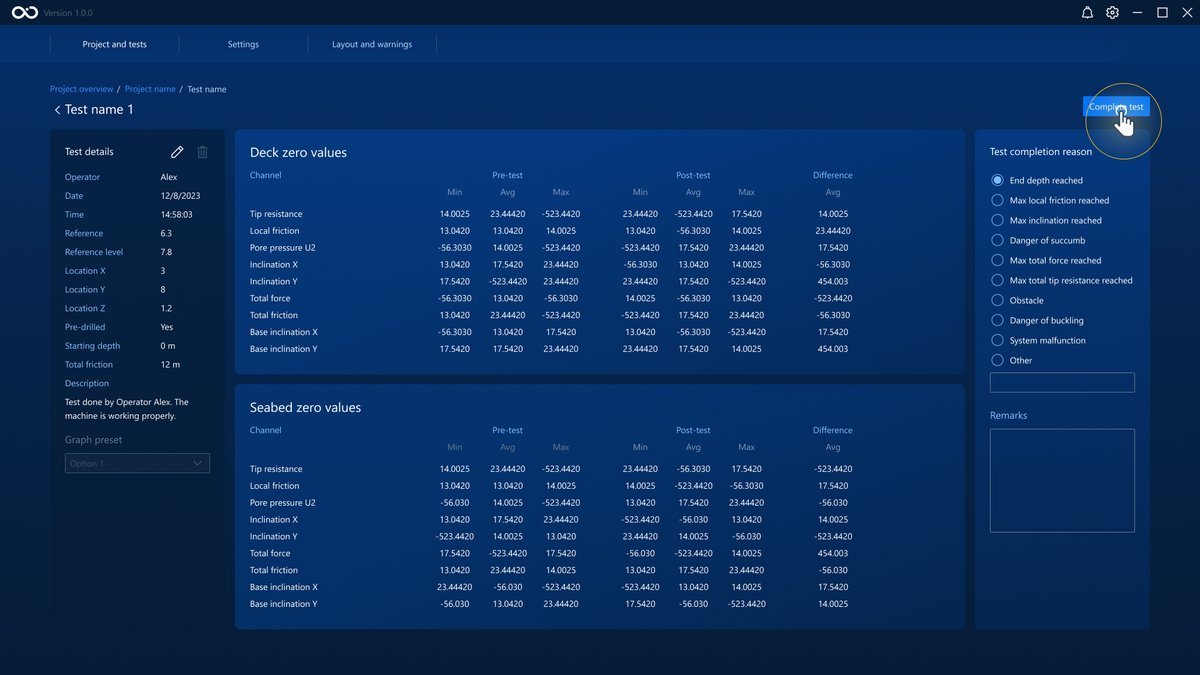
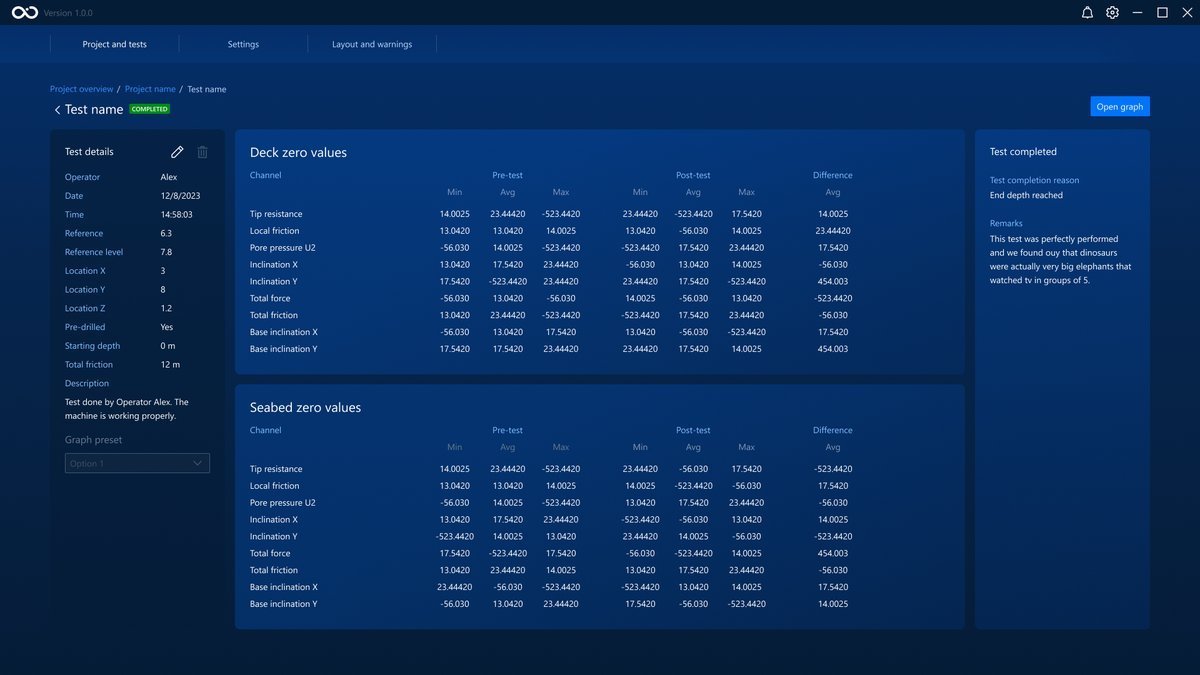
Then, click on the Complete test button. The test will now be marked as either Completed or To Review in the Project Dashboard and on the Test Dashboard.
Subtests
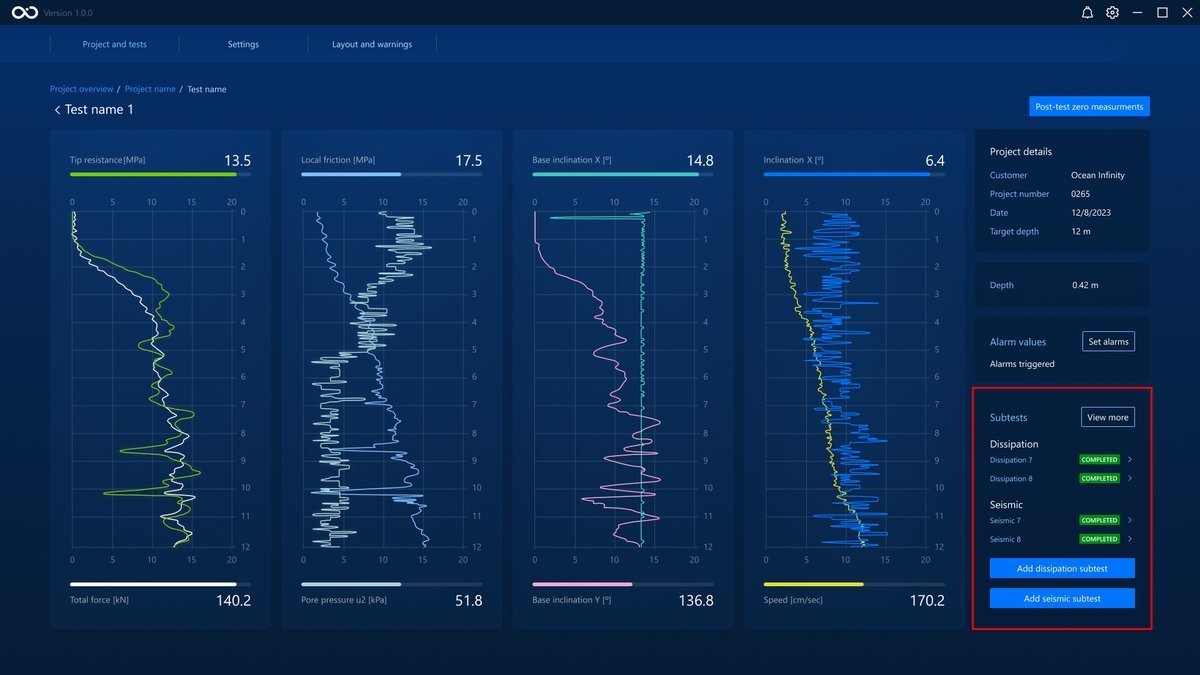
You can create subtests in the Data Acquisition phase. There are two types of tests: Dissipation and Seismic. Whenever you run a subtest, the resistance tests' data acquisition will stop until you complete all running subtests. You can only run one subtest at a time.
The image below shows the panel where you can see the completed and ongoing subtests. This panel can show up to 4 subtests.
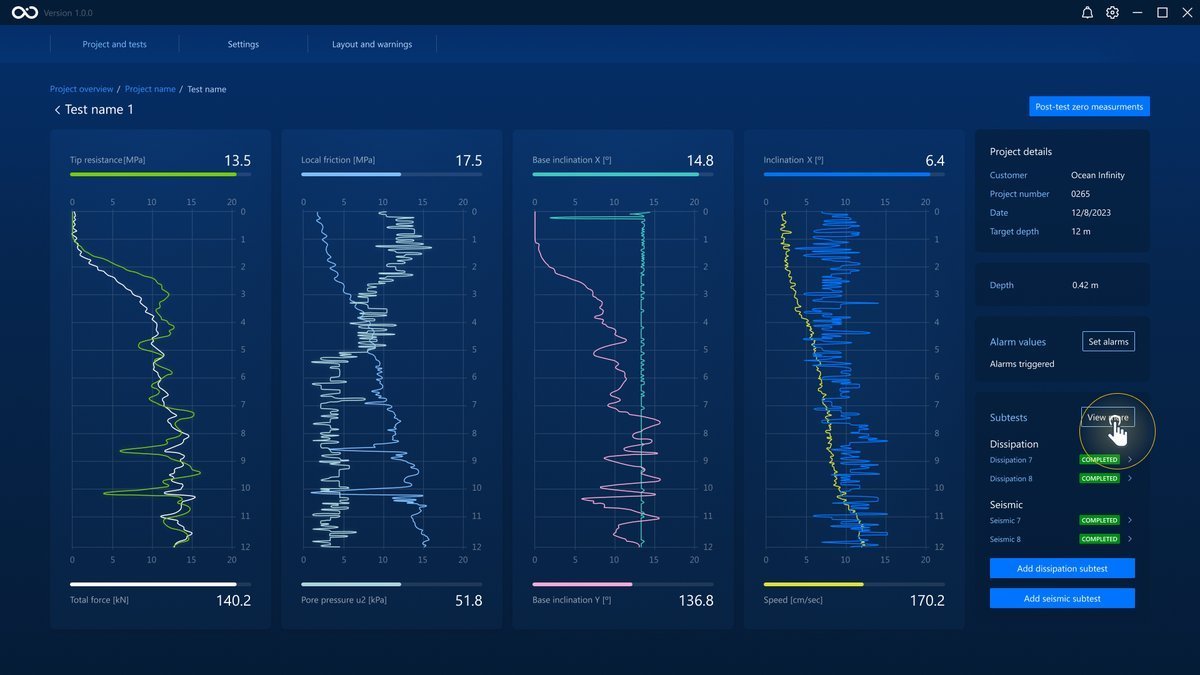
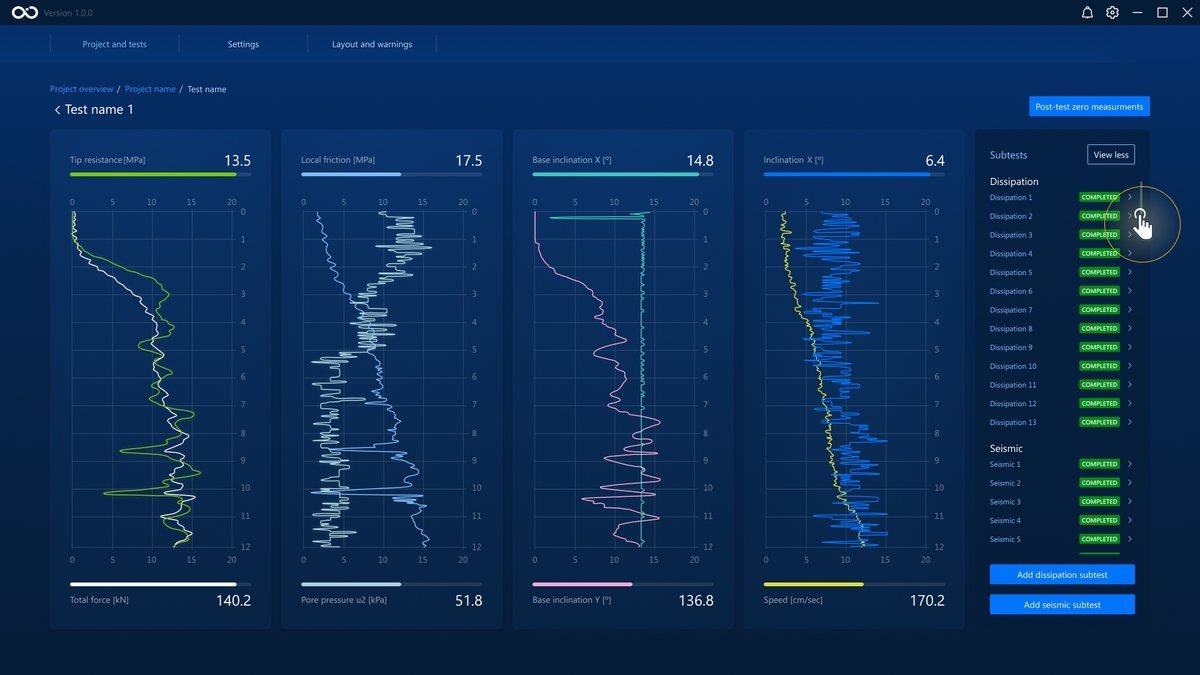
If you want to see all the subtests attached to a test, click on the View more . Clicking on a test will take you to the subtest page.
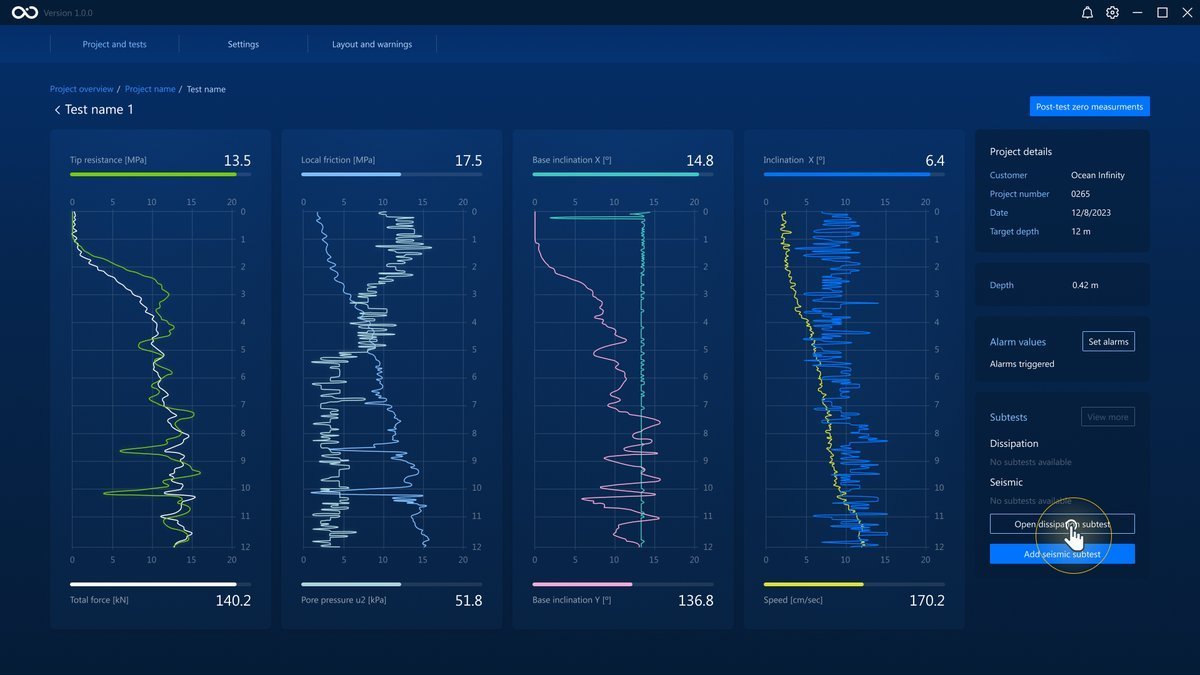
To go back to an ongoing subtest, click on the respective Open subtest button.
Dissipation Subtests
To start a dissipation subtest, click on the Add a dissipation subtest button.
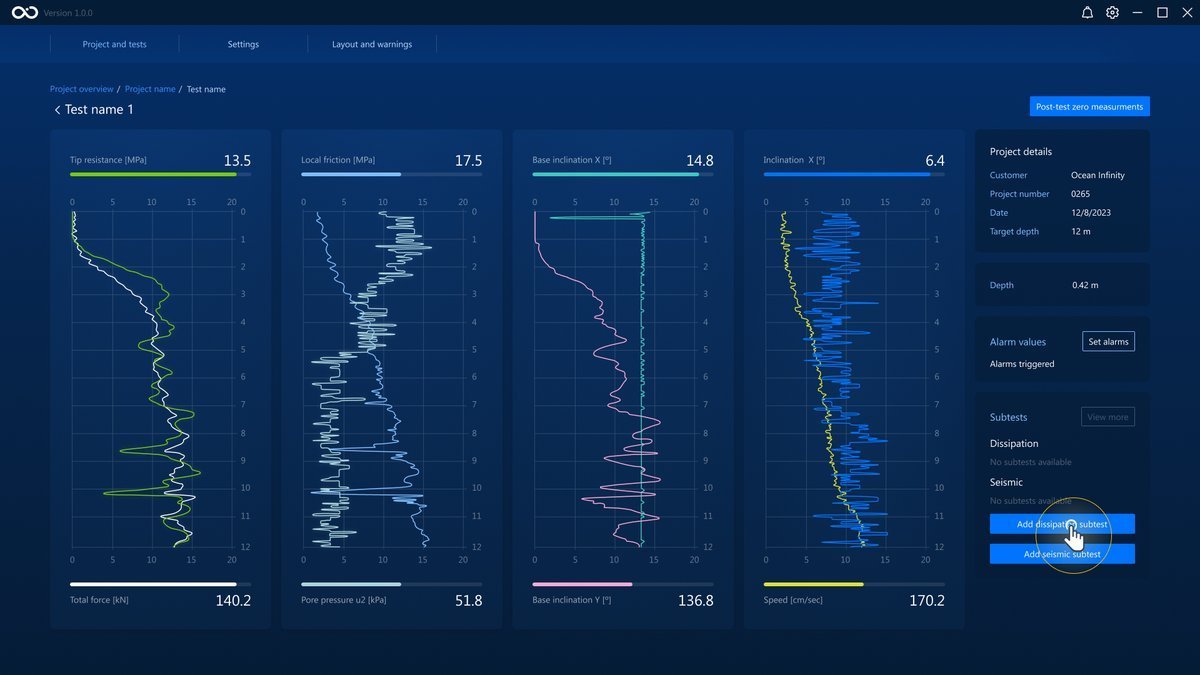
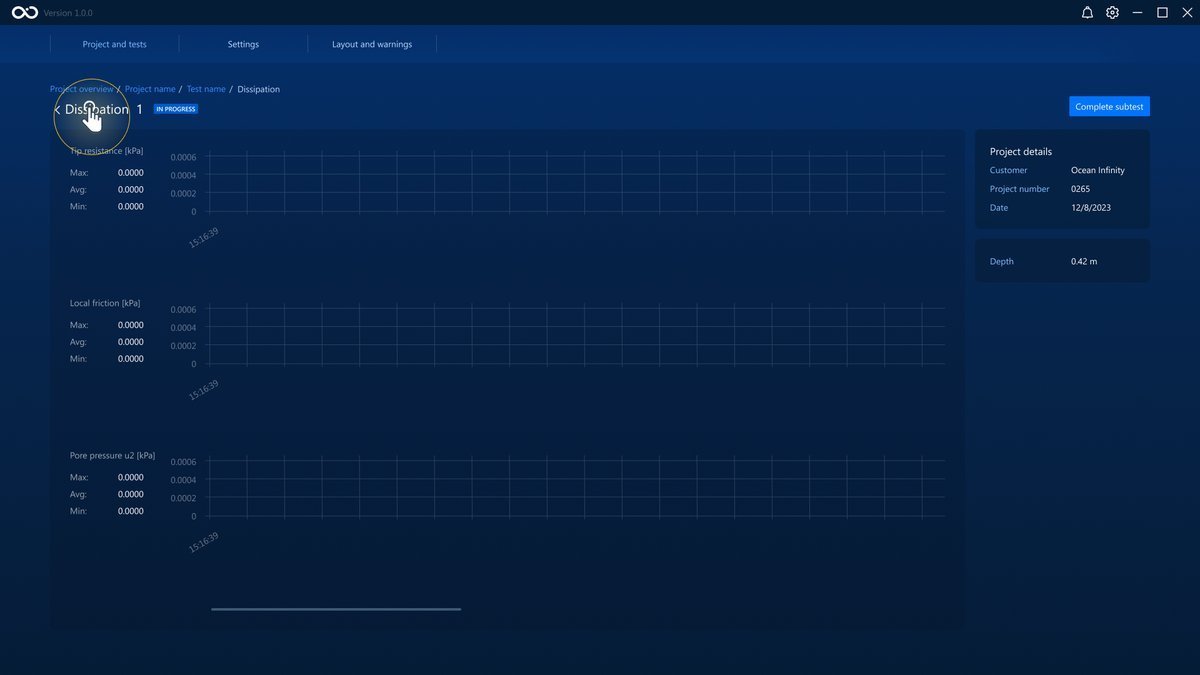
This will take you to the Dissipation Subtest page. The test will start automatically, and you should see data being plotted in the graphs.
You can go back to the Data Acquisition page while the subtest is ongoing. The subtest will continue in the background.
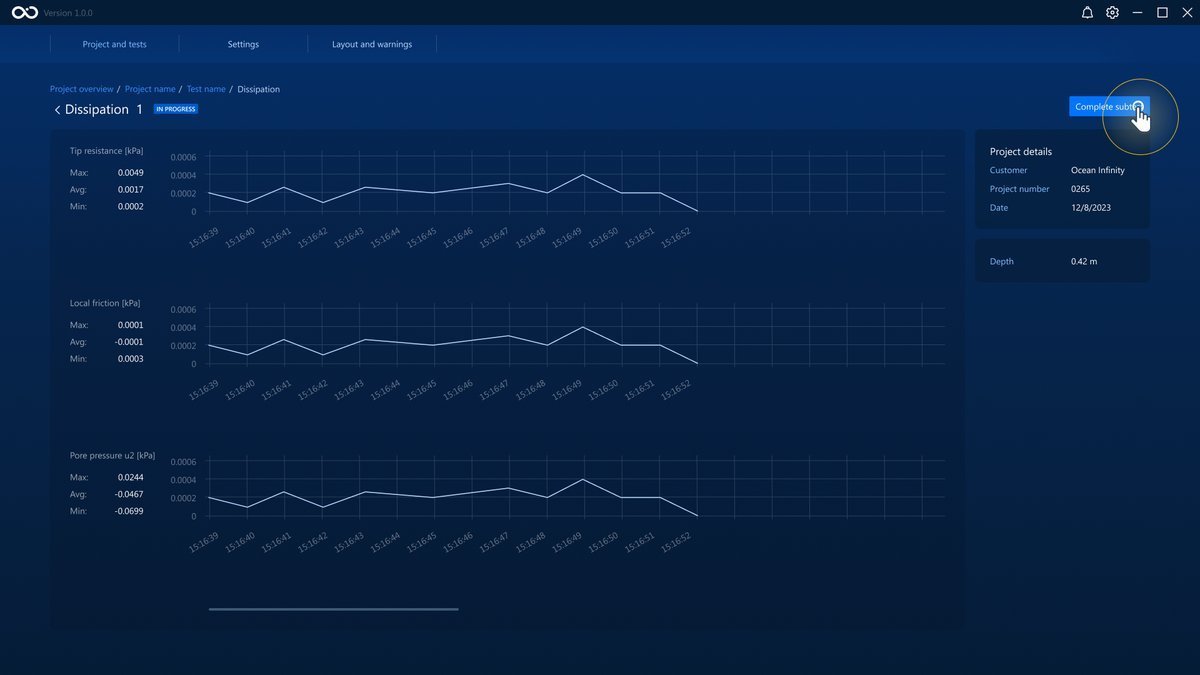
To finish the test, click on the Complete subtest button. This will take you back to the Data Acquisition page.
Seismic Subtests
To start a seismic subtest, click on the Add a seismic subtest button.
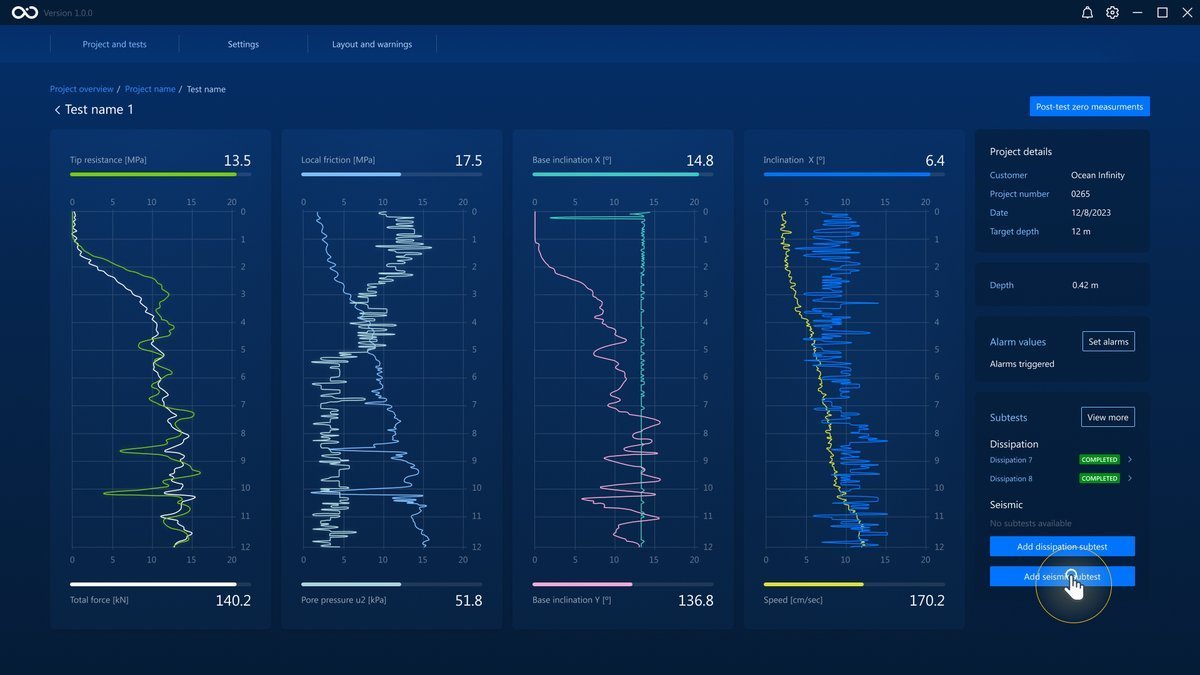
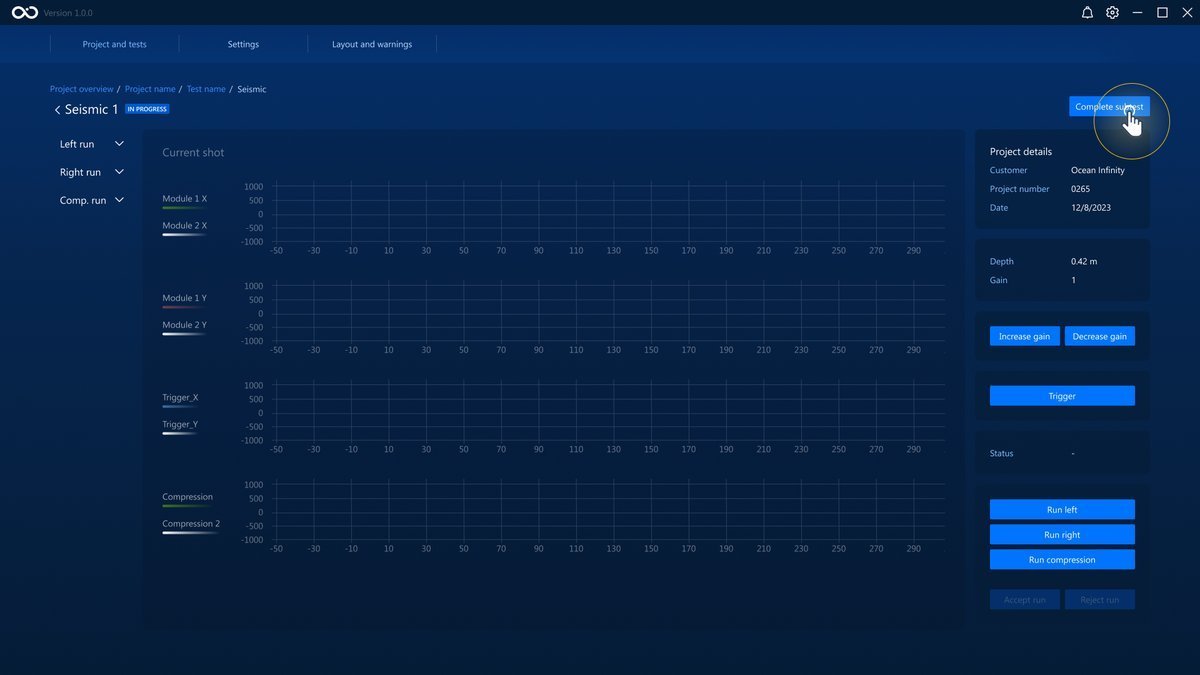
This will take you to the Seismic Subtest page. This type of test supports multiple shots.
You can return to the Data Acquisiton page unless there is an ongoing shot; the back button will be frozen in this case.
Before starting a shot, you can customize the gain by using the Increase gain and Decrease gain .
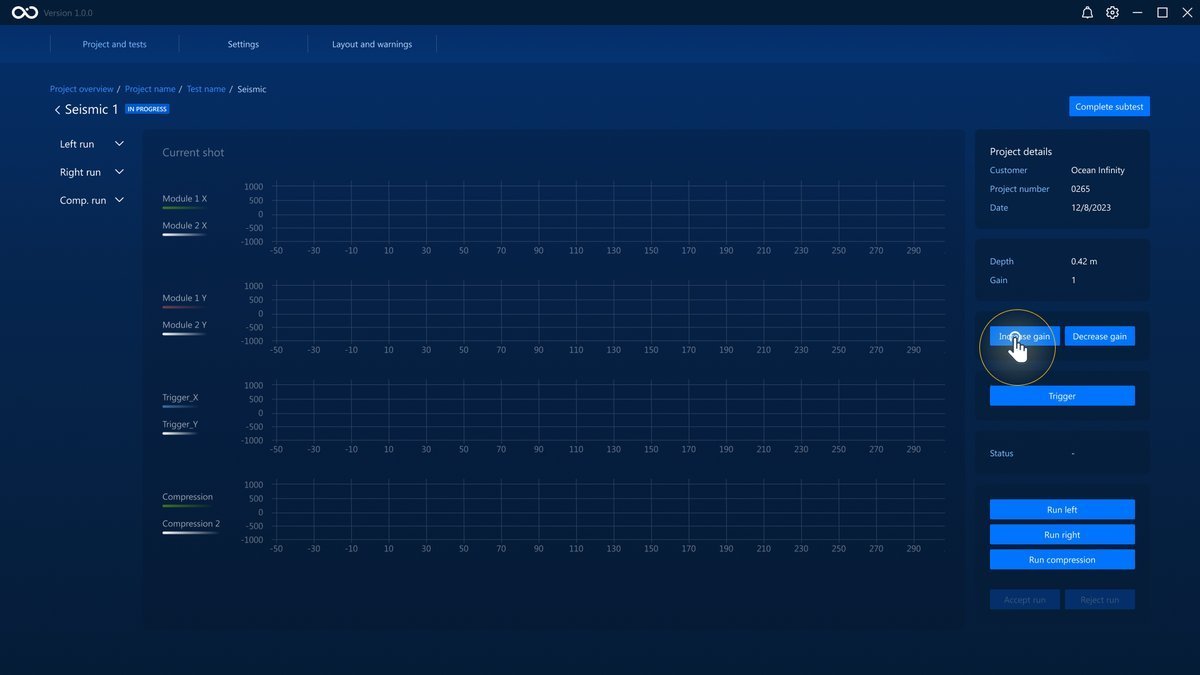
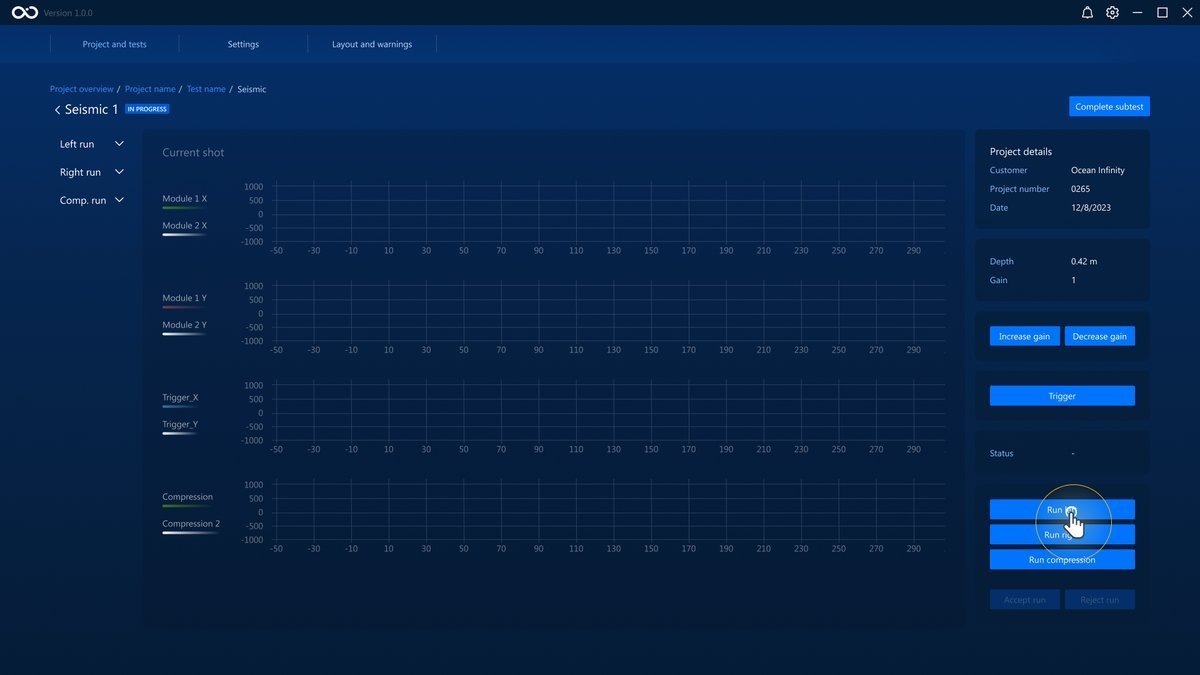
To start a shot, click on one of the three buttons on the bottom-right corner: Run left , Run right or Run compression . This will start plotting data on the graphs.
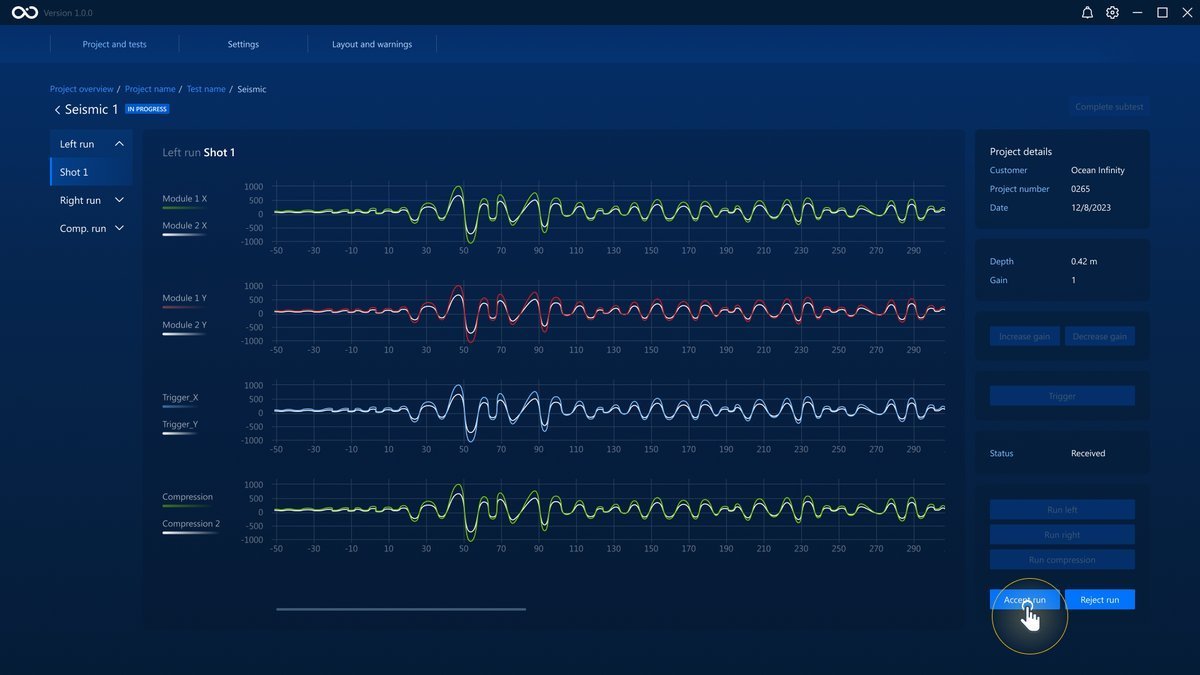
When the run is over, you can Accept run or Reject run by clicking on the respective buttons.
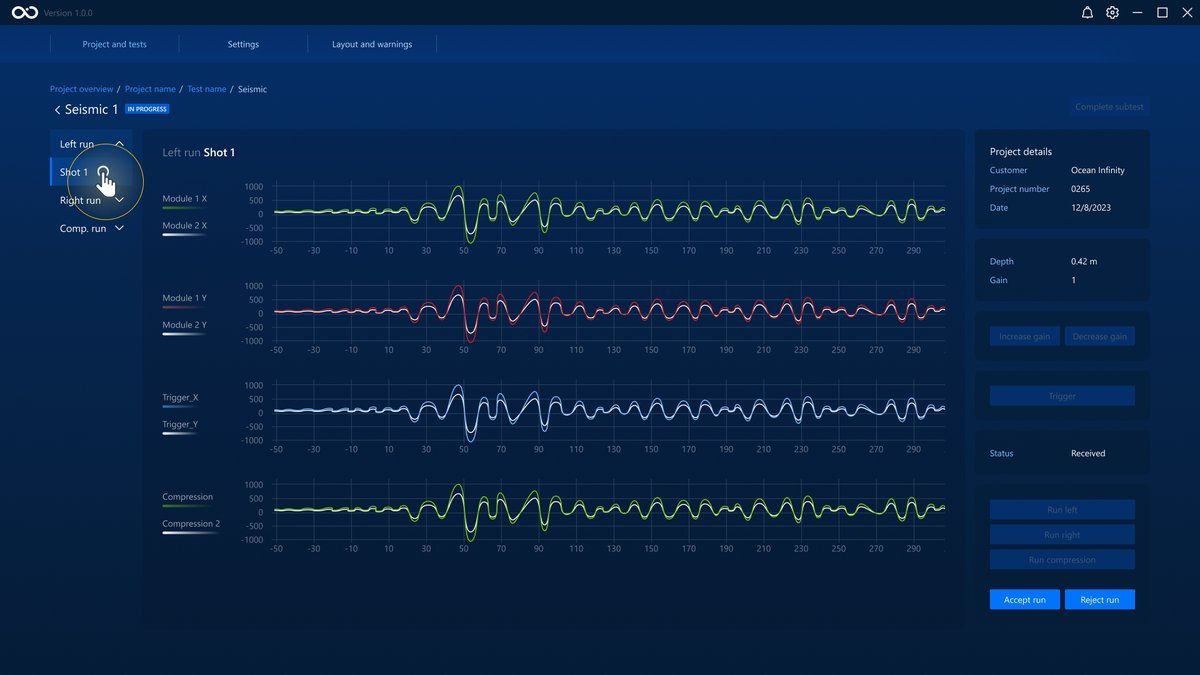
All completed runs will be stored and can be viewed by clicking on them on the panel to the left.
To complete the test, click on the Complete subtest button. This will take you back to the Data Acquisition page.
Settings
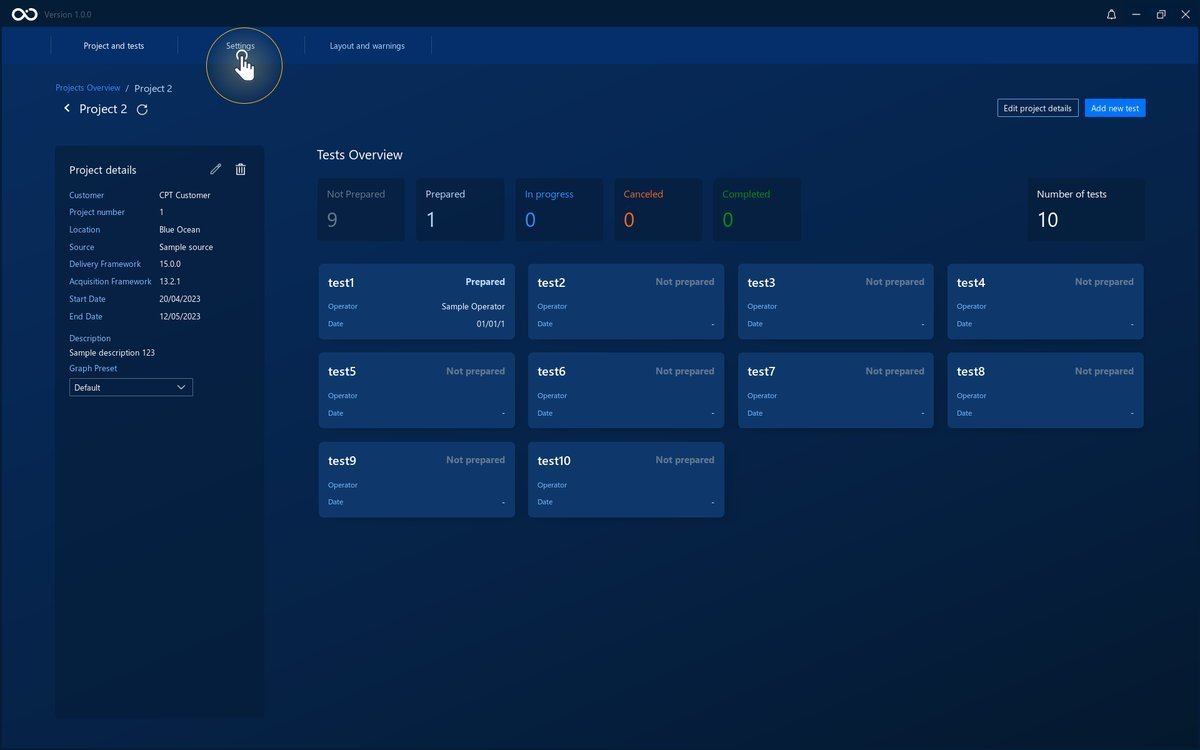
The settings page lets you change settings in the IField software. To do so, start by navigating to the project dashboard that you want to change the settings of.
Then click on the Settings button on the navigation bar at the top.
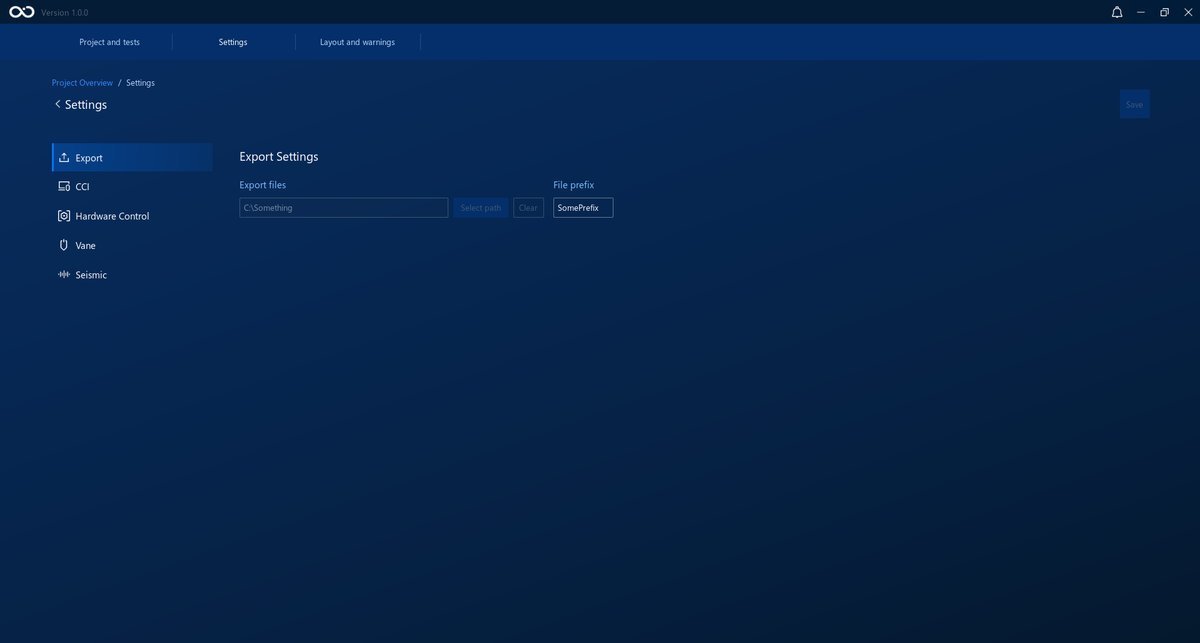
On the left of the settings there are five tabs that you can use to navigate to different settings categories.
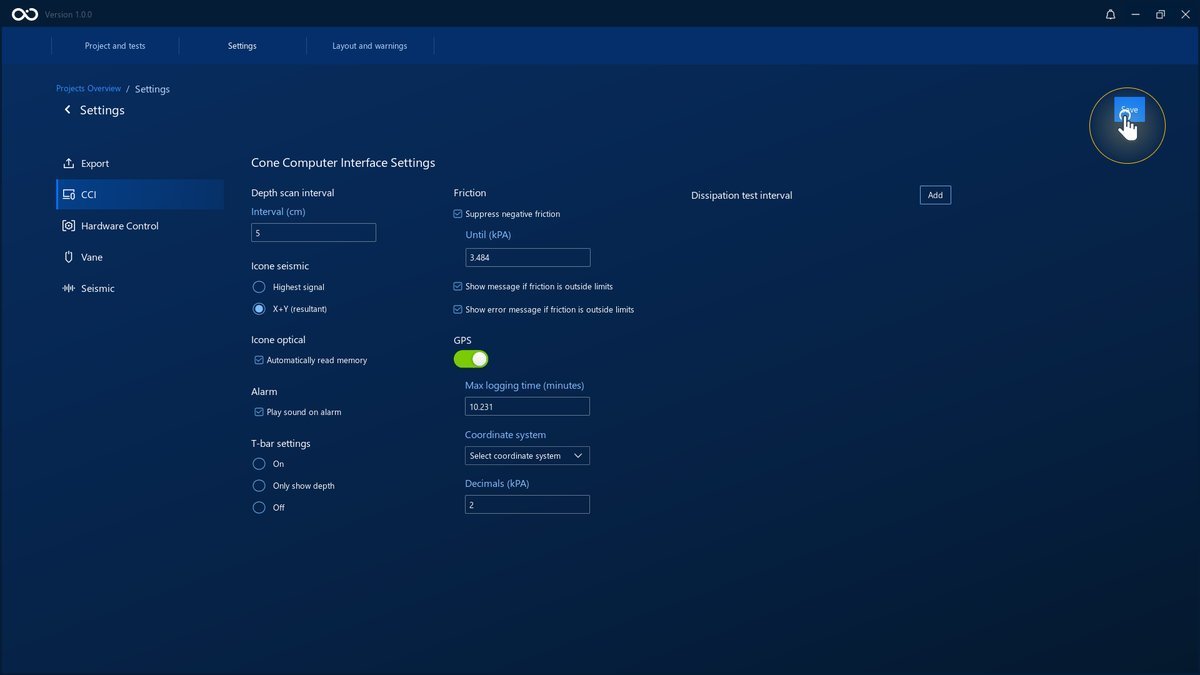
Save new Settings
Whenever a change is made to the settings, the Save button will become enabled. If you want to keep the changes, click on it.
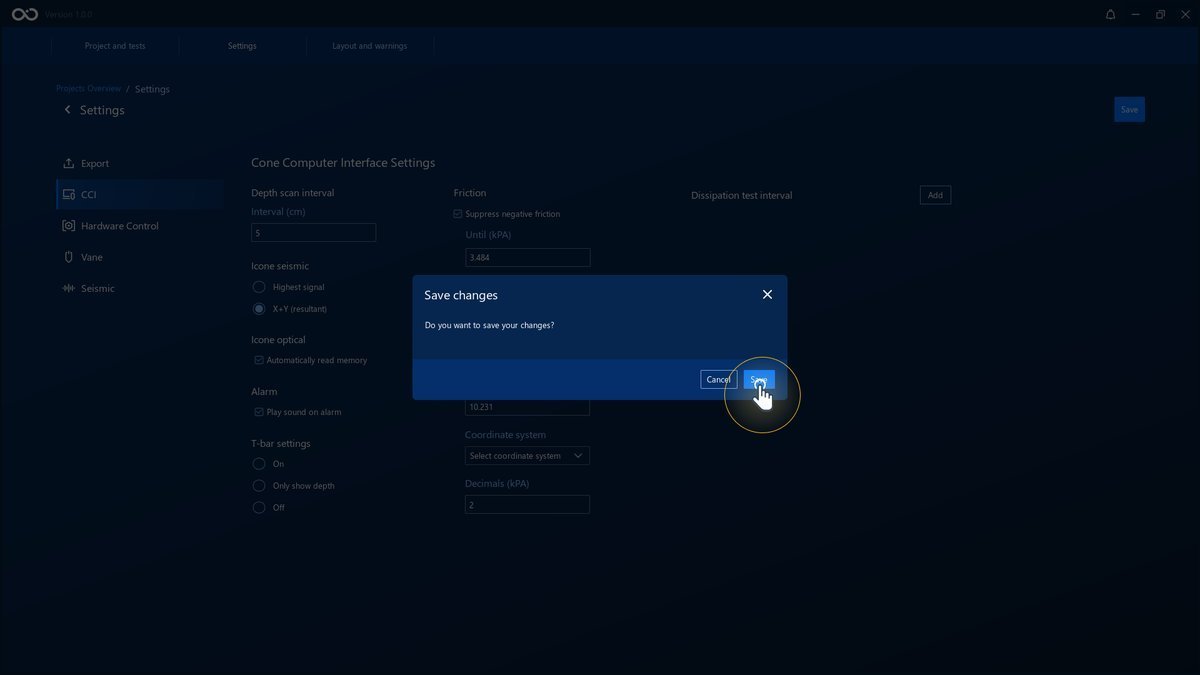
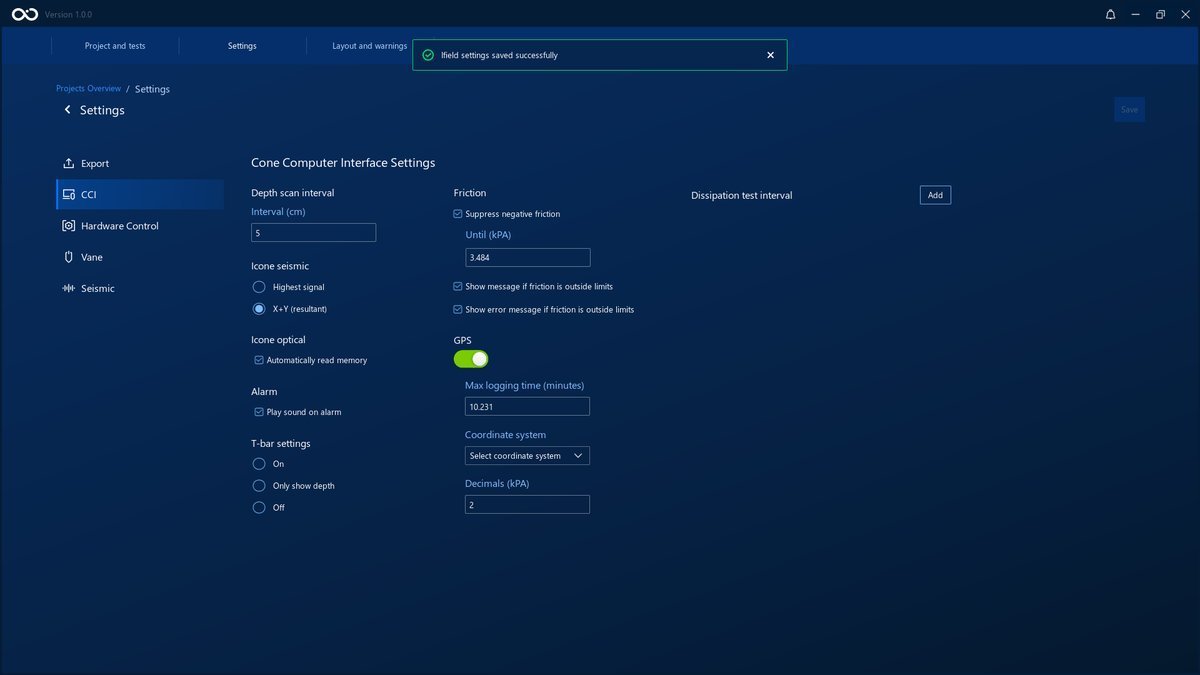
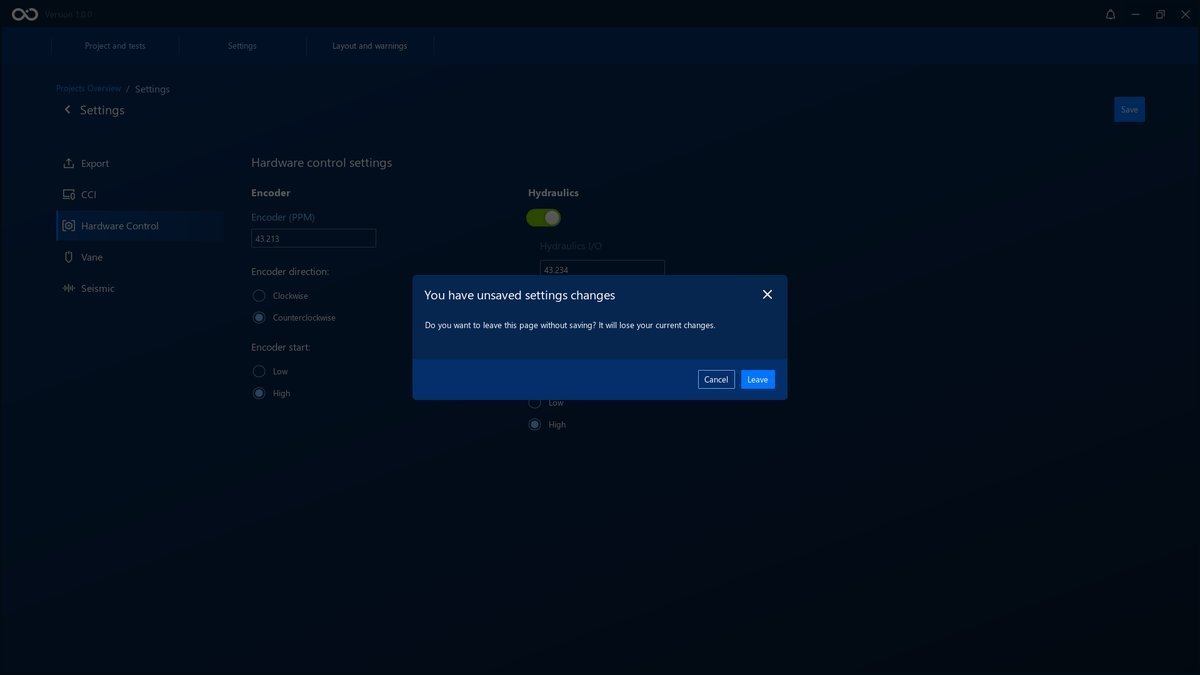
If you want to discard the changes that were made, just leave the Settings page or close the application. A window will show before closing warning that there are unsaved changes.
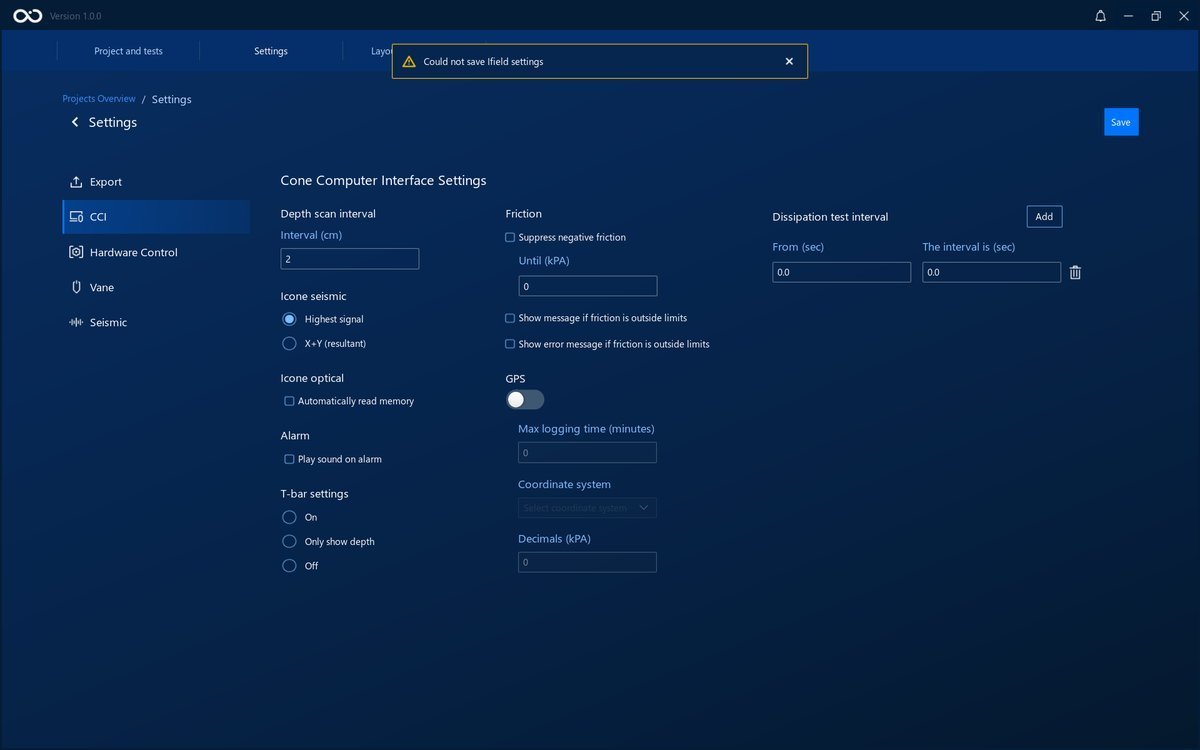
Error in Saving Settings
There might be cases in which you won't be able to save the settings. An error will show on top of the page. In this case, please contact the support team with the error message.
Retrieve GRU Files
Our software generates two GRU files per test:
- Original (from APV software)
- Prepared (our improved version)
These are automatically created upon test completion.
How to Retrieve GRU Files
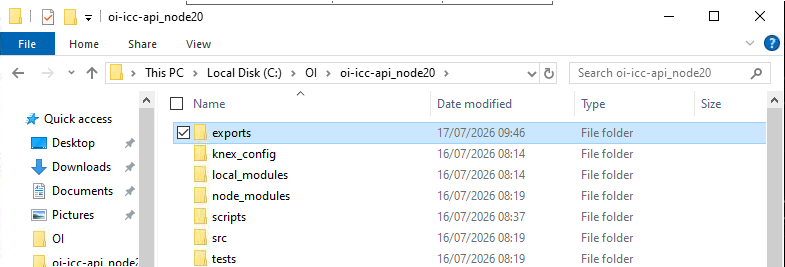
Double-click the Exports shortcut on the Desktop to jump straight to the base exports folder (see Ocean Infinity Shortcuts). From there, navigate into the specific project folder, then the specific test folder.
Alternatively, you can navigate there manually:
C:\OI\CPT\oi-icc-api_node20\exports
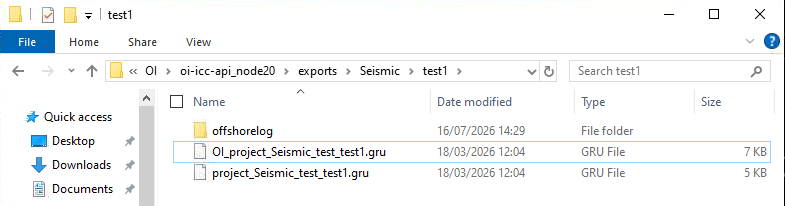
Locate the folder matching the project name and test name. GRU files will be inside.
Examples:
File Structure Requirements
To move GRU files from ICC to shore (M:/ drive), follow these structures:
1. ICC File Structure
C:\PATH\TO\APV\API\FOLDER\EXPORTS
└── <project_name>
    └── <test_number>
        ├── OI_project_<project_name>_test_<test_name>.gru
        └── project_<project_name>_test_<test_name>.gru
2. M:/ Drive Structure
M:\projects
└── 2024
    └── <project_name>
        └── 2_Raw_Data
            └── A7803
                └── iFieldICC
                    ├── GRU
                    │   ├── Original
                    │   │   └── project_<project_name>_test_<test_name>.gru
                    │   └── Prepared
                    │       └── OI_project_<project_name>_test_<test_name>.gru
                    ├── LOG
                    └── SE2
                        └── [Location]
3. Syncing Files
A watcher process should monitor ICC exports and move files to the M:/ structure. This will then be made available on the DATA environment to whoever has permissions to access the project folder
Export GRU files
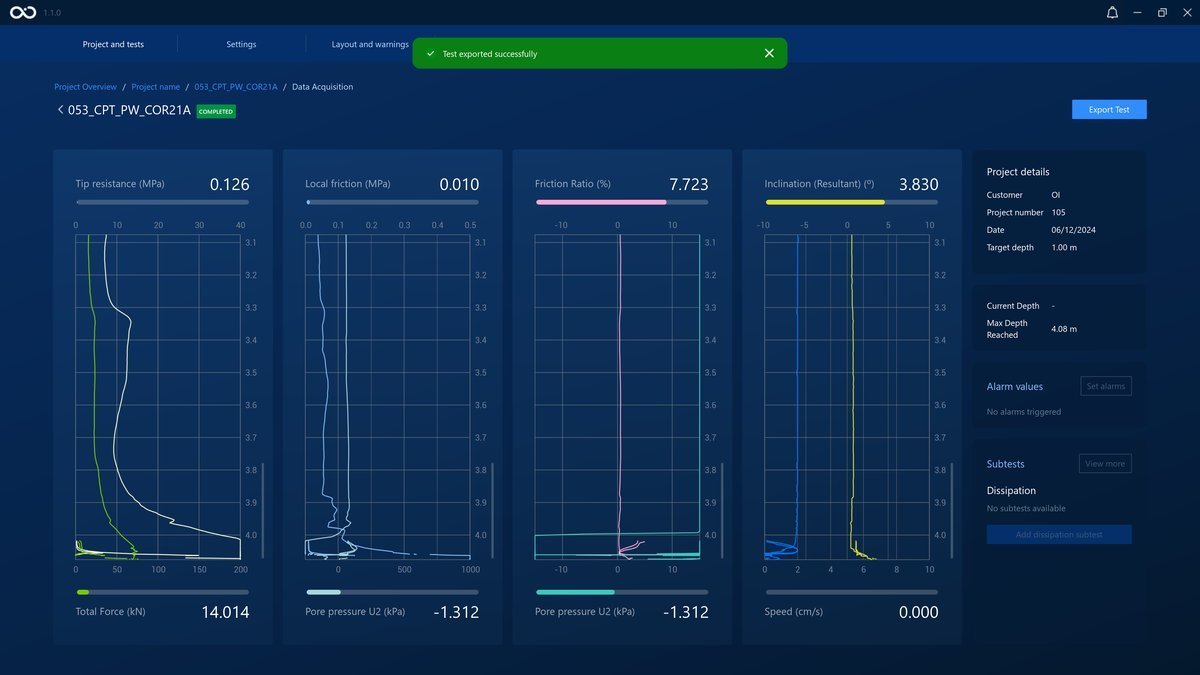
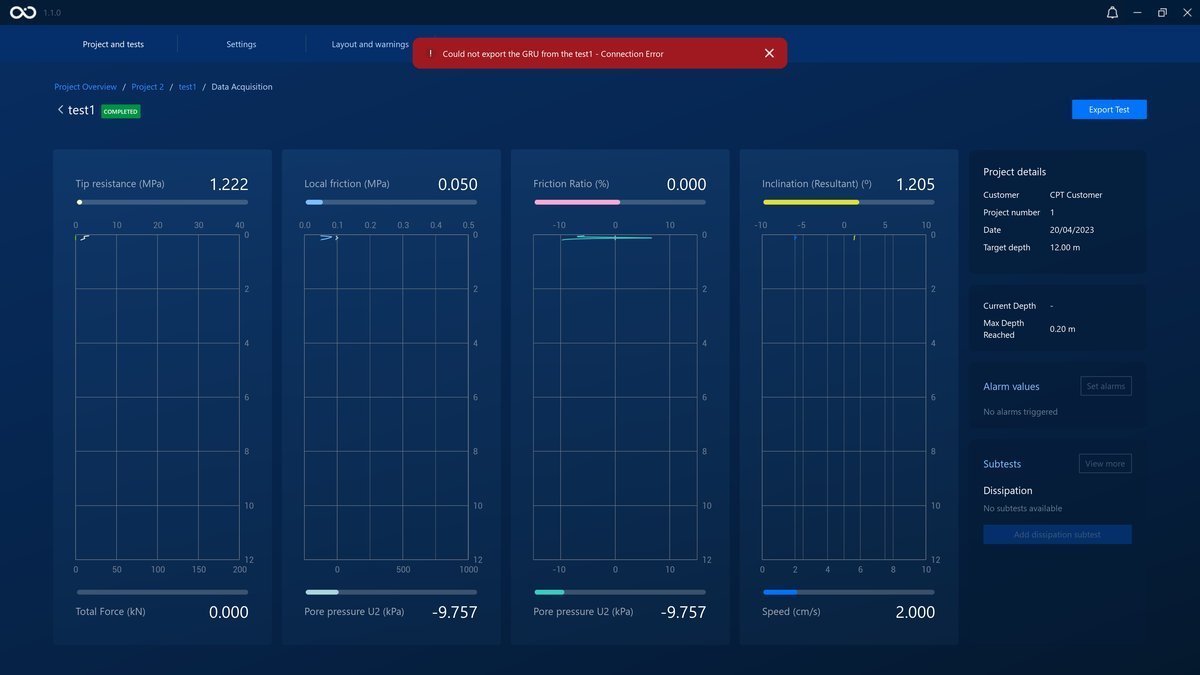
After the completion of a test in iField, usually the test is exported automatically. However, as a redudancy mechanism, inside of the data acquisition screen there will appear an Export button that will trigger the generation of the test GRU, overwriting the previous GRU if it existed. The export procedure will export any data that the test contains, even if incomplete.
Visit Retrieve GRU Files from this documentation to learn where to find the exported .GRU file.
Note
In case of having an issue obtaining a GRU automatically at the end of the test, meaning that the test is marked as completed or to review (it should be created already in the project > test folder), it can be generated through this feature.
Tests marked as Invalid (see Test states) can still have their data retrieved this way — follow the same Export route described above, and the resulting GRU files will be written to the same location as any other test's.
Generate Offshore Logs
After a test has completed, an offshore log can be generated for it. This is done using the Generate Offshore Logs shortcut found on the desktop, which runs a small tool in a terminal window.
How to Generate an Offshore Log
1. Launch the tool
Double-click the Generate Offshore Logs shortcut on the desktop. A terminal window will open and prompt you to enter a test name:
Enter test name (blank to quit):
Type the name of the test you want to generate an offshore log for and press Enter.
2. What happens next depends on how many tests match that name
A test name unique to a single project
If only one test with that name exists, the tool generates the offshore log for it straight away — no further input is required.
The test name exists in more than one project
If the same test name exists in multiple projects, the tool lists every project the test was found in, along with the date the test was run, and asks you to choose one:
Found 10 tests named "test1", 2 of which had offshore logging enabled.

Multiple tests named "test1" found, in projects:

     Project        TestDate
  1. Seismic         2026-03-06 13:25
  2. test-API-09     2026-02-23 11:48

Enter the project name or number:
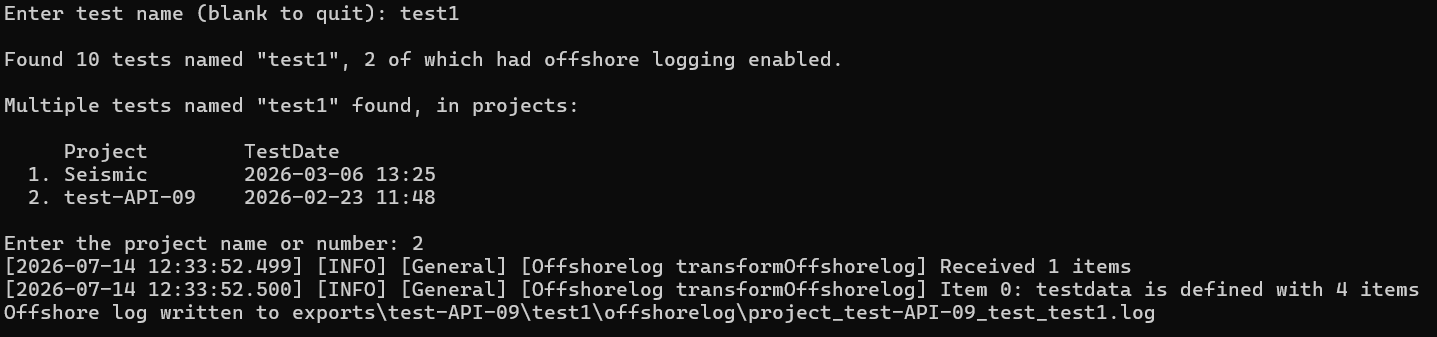
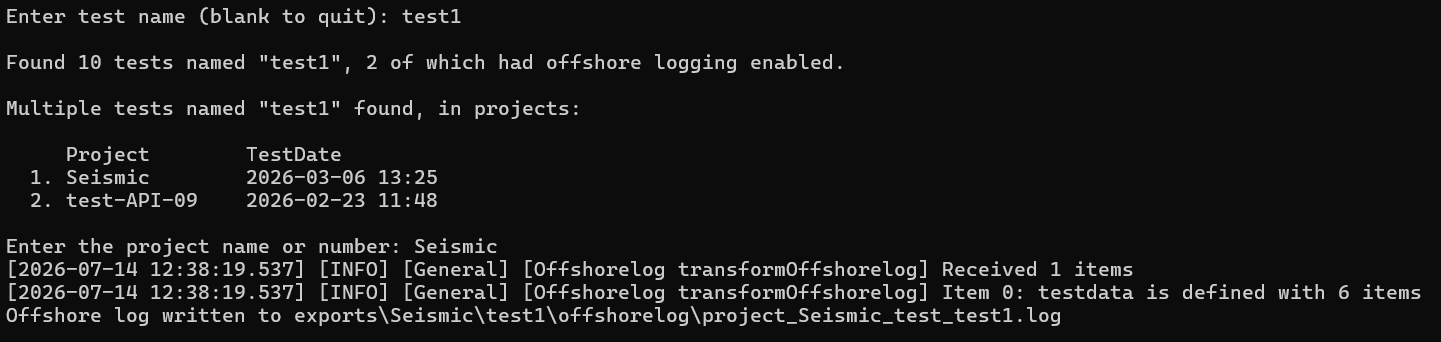
You can respond either by number or by typing the project name directly:
Note
The tool only lists projects where the test had offshore logging data available — in the example above, 10 tests were found named "test1", but only the 2 with offshore logging enabled are offered as options. All tests should have offshore logging enabled, but older tests may not.
No test found with that name
If no test matches the name entered, the tool reports this and stops. Double-check the spelling of the test name and try again.

Tests found, but none have offshore logging data
If one or more tests are found with that name, but none of them have offshore log data available, the tool reports this and stops:

Warning
This means offshore_logging wasn't enabled, or no offshore hardware was detected, during the test itself. Offshore logs cannot be generated retroactively for a test that didn't capture this data — offshore logging must be enabled before/during test acquisition.
3. Offshore log generated
Once generation succeeds, the tool prints where the log was written, for example:
Offshore log written to exports\test-API-09\test1\offshorelog\project_test-API-09_test_test1.log
The folder containing the generated offshore log then opens automatically.
Output Location
Offshore logs are written to:
oi-icc-api_node20\exports\<project_name>\<test_name>\offshorelog\<log_file>.log
Where <project_name> and <test_name> match the project and test selected during generation.
Ended: Ifield
Troubleshoot ↵
Current Software Limitations
Dissipation Tests
Dissipation tests should not be run for more than 120 minutes at risk of crashing iField and losing all related test data. Be mindful that in order to reach two hours of test, the resource consumption of the machine has to be stable (CPU,GPU).
Test Names
Tests cannot have the any special characters in their names at risk of not generating GRU files correctly, such as \ / : * ? " < > |
Software running very slow
If the software is running very slow, it might be one of the following issues:
-
Dissipation test's graphs have a big impact on performance. If you perform a dissipation test, you might notice the software running less smoothly. If this happens, please be patient and only click the buttons once. The application will run smoothly again once you go back to the data acquisition screen.
-
The gateways consume the machine's memory if they run for too long without restarting the VM. If the software is extremely slow outside of the dissipation screen, please open Task Manager and check the VM's memory stats. If the gateways are consuming too much memory, we recommend restarting the VMs.
iField Settings not loading
If the iField settings do not load at first, please close and open the application again. They will load eventually.
FPS Drop when Window is out of focus
If the application is running very slowly when you stop focusing on its window, go to:
Nvidia Control Panel > Manage 3D Settings > Global Settings > Background Application Max Frame Rate
And set it to 60 FPS.
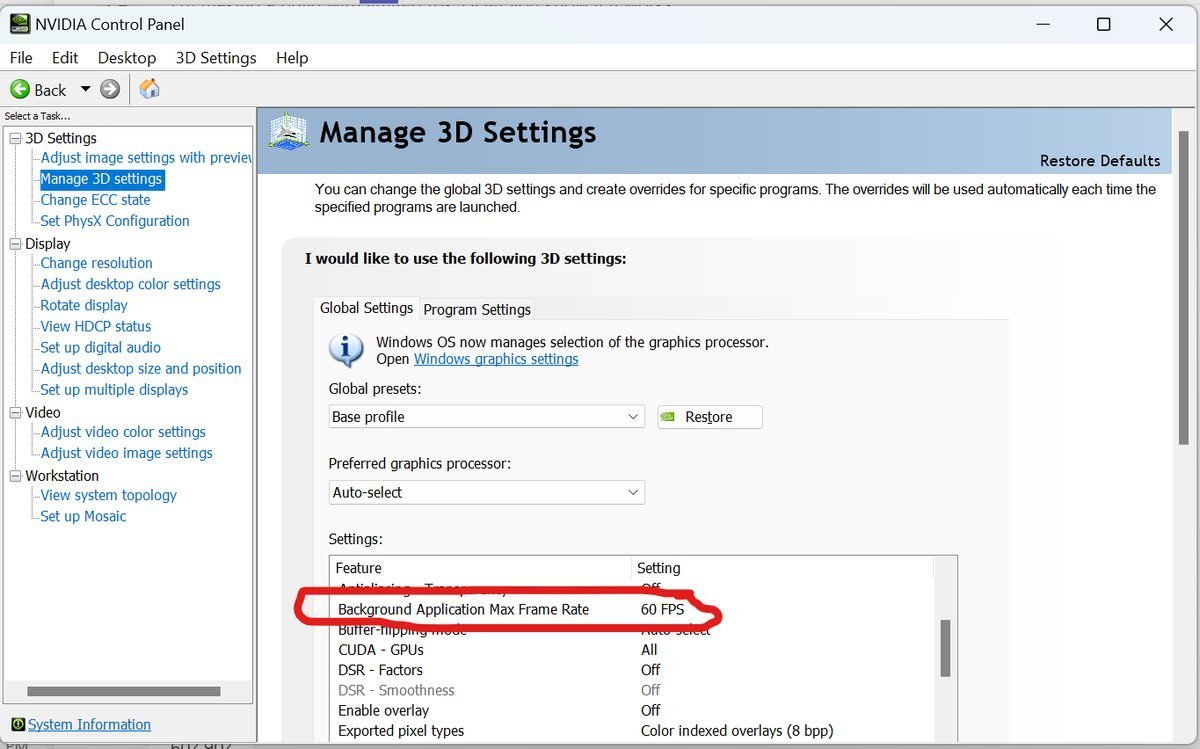
Setting "Background Application Max Frame Rate" in nvidia control panel
GRU files not generating
Sometimes, the GRU files are not generated after completing a test, and they will show as empty. When this happens, the APV software can be used to export just the original GRU files (see Use APV software page).
If the files are being generated empty, please restart the API. In order to do this, please run the following Desktop shortcut.
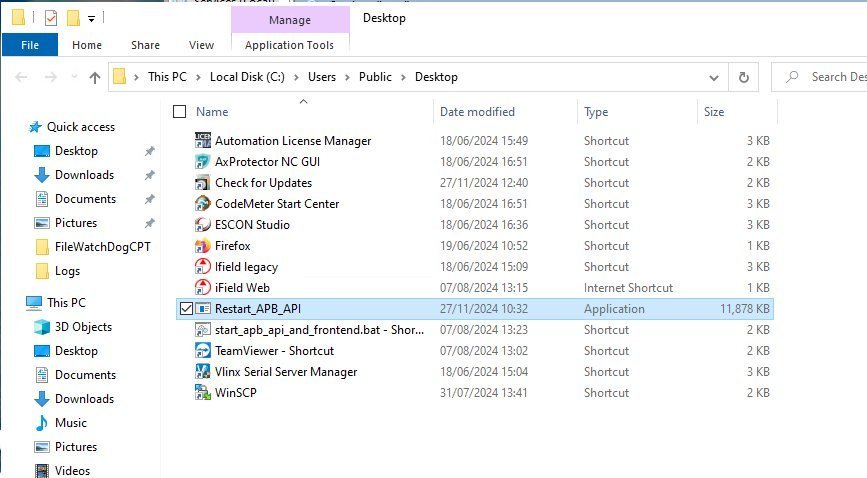
This is the same Restart OI API shortcut listed on the Ocean Infinity Shortcuts page.
Offshore Logs
Two Desktop shortcuts are available to help with generating and locating offshore logs. See Generate Offshore Logs for the full walkthrough of the generation process itself.
Generate Offshore Logs
Double-click this shortcut to launch the Offshore Logs tool and generate an offshore log for a test.
Exports
Double-click this shortcut to open the base exports folder, where generated offshore logs (and other test exports) are stored — no need to generate a new one first. From there, navigate into the specific project folder, then the specific test folder. See Ocean Infinity Shortcuts and Retrieve GRU Files for more detail.
Open APV software
There are two ways to run the APV software:
- Using our API (the common way) — APV's Frontend and iField Web run against Ocean Infinity's own ICC API, which is already running as a service. This is what you'll use most of the time, e.g. if a GRU file comes out blank.
- Full APV software (rare, last resort) — both the API and Frontend are run from APV's own software instead of ours. Only use this if something has gone seriously wrong with our version of the API.
APV Desktop Shortcuts
The original APV software is started using a set of Desktop shortcuts:

| Shortcut | What it does |
|---|---|
| ICC-OI | Opens the folder containing the APB ICC API and Frontend source folders. |
| Ifield | Runs the original APV software directly — see Ifield Shortcut below. |
| iField API Check | Checks the iField API. Use this before opening iField Web if the Frontend doesn't load. |
| iField Web | Opens the APV iField Web frontend, once the Frontend Server and ICC API are running. |
| Start iField Frontend Server | Starts the APV Frontend Server. Must be running before opening iField Web. |
| Start iField ICC API | Starts the APV iField ICC API. Only needed for the Full APV software route below — must be running before you run the APV Frontend Server. |
Common way — using our API
Ocean Infinity's own ICC API is already running as a service, so you only need to start APV's Frontend:
-
Start iField Frontend Server
-
iField Web

-
If the Frontend doesn't load, open iField API Check before opening iField Web

-
-
Log in with credentials user: cpt pass: cpt
Full APV software — only if something is seriously wrong with our API
This route runs both the API and Frontend from APV's own software. Before starting it, first stop Ocean Infinity's own ICC API using the Stop OI API shortcut — see Ocean Infinity Shortcuts. Both versions of the ICC API cannot run at the same time.
-
Start iField ICC API
-
Start iField Frontend Server
-
iField Web
-
If the Frontend doesn't load, open iField API Check before opening iField Web
-
-
Log in with credentials user: cpt pass: cpt
Ifield Shortcut

This shortcut runs the original APV software directly. Operators only use this if they really and truly need to — it's a way to check that everything is okay from a foundational point of view, working directly against APV's software rather than through iField Web.
Ocean Infinity Shortcuts
In addition to the original APV software (see Open APV software), a set of Desktop shortcuts are provided for Ocean Infinity's own tooling:
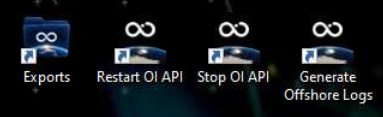
Exports
Double-click this shortcut to jump straight to the base exports folder. From there, navigate into the specific project folder, then the specific test folder, to find its GRU files. See Retrieve GRU Files for the full folder structure.
Restart OI API
Restarts Ocean Infinity's own ICC API. See GRU files not generating for when to use this.
Stop OI API
When an operator needs to kill Ocean Infinity's own ICC API before starting up the Full APV software route, they need to run this — see Open APV software.
Generate Offshore Logs
Generates an offshore log for a completed test — see Offshore Logs for the full walkthrough.
Troubleshoot
If there is an issue with this OI Software you are unable to resolve, please follow the standard Technology Operations procedure to log a support ticket.
Submit a ticket using the portal at https://itsupport.oceaninfinity.com or email support@oceaninfinity.com.
Please include all relevant detail, for instance:
- A screenshot of the problem
- The precise time (hh/mm/ss) of when the problem happened
- A detailed description step by step of what was done so the team can replicate the problem
If this is an operationally blocking issue, we recommend the usage of APV's software until the issue can be fixed (see Open APV software). If this is not possible and consequently the issue needs to be fixed to prevent operational downtime, please register an emergency P1 ticket.
You must call IT directly (020 8075 3905) after submitting a P1 ticket. If raising a P1 incident via email, the subject line should be prefixed with "P1".
An IT Operations Engineer will ask you to cite the ticket ID (emailed to you on generation of the ticket), review the impact and if agreed to be a genuine IT related P1 Incident they will begin troubleshooting. All progress will be logged in the ticket, which you can monitor and update at https://itsupport.oceaninfinity.com.
It is important that you can be reached for critical tickets in case more information or assistance is required.
Ended: Troubleshoot
Release Notes ↵
📦 Release Notes - 1.1.0
🛠️ Bug Fixes
- Improved graph loading in CPT iField – graphs now load correctly and completely.
- Performance improvements for long tests – reduced freezing and lag during streaming and test viewing.
- Fixed export issues – GRUs and coordinate systems now export correctly, even manually.
- Resolved freezing bugs in both iField and HMI apps during extended use.
- Fixed dissipation and CPT test loading errors in iField.
- Memory leaks resolved in UE and Integration layer.
- UI bugs fixed – long press issues, misbehaving buttons, and missing navbar buttons now corrected.
- Improved FPS for smoother performance.
✨ New Features & Improvements
- Export Button added on Test Completed screen.
- Location Data now visible in Test Details. Operator is now informed if not receiving data from QINSy upon start.
- Confirmation Modal added before finishing a test.
- Control Pane Added toggle to lock controls to avoid misclicks
📦 Release Notes - 1.4.0
🛠️ Bug Fixes
- [CPT iField] The Start or Complete Dissipation button doesn't send the command when pressed.
- [CPT iField] Data is saved on DB after having problems with API.
- [CPT iFIeld] The Reset Alarm action is inverted when the CPT Length is reached as soon the Data Acquisition screen is displayed.
- [CPT iField] The graph shows a line on 0 depth after a dissipation test is added.
- [CPT iField] The Settings are not loaded when the application is opened
- [CPT iField] Disconnection toast message on RCC connection loss is displayed when in Vessel mode
- [CPT HMI] The Base X and Y are not displaying the values when a test is started for the first time after the CPT is powered on.
- [CPT HMI] The Rods are not sync with the real CPT rods.
- [CPT HMI] HMI sporadically is not receiving topics when the Gateways are open before the application
- [Real Operation] Unreal iField app crash and closes when entering the graphs screen after 2 hours in the zeros screen.
- [iField API] The API disconnects when a not completed test is called on the endpoint oi/export/cpt
- [DDS Tools] The command Async push is not stopping on the set depth.
✨ New Features & Improvements
- [CPT iField] Update to latest ICC API (Jan 2026).
- [CPT iField] Show loading when waiting for Zeroes
- [CPT iField] View Dissipation Elapsed Time
- [CPT iField] Reorder Test List
- [CPT HMI] 3D Twister - Report When Clamps are Closed.
- Optimize Topic Messaging and Prioritization.
- Review Log Strategy for Gateways